
Why Your MT5 Backtest Sharpe Ratio Looks Too Good (and How to Read It Properly)

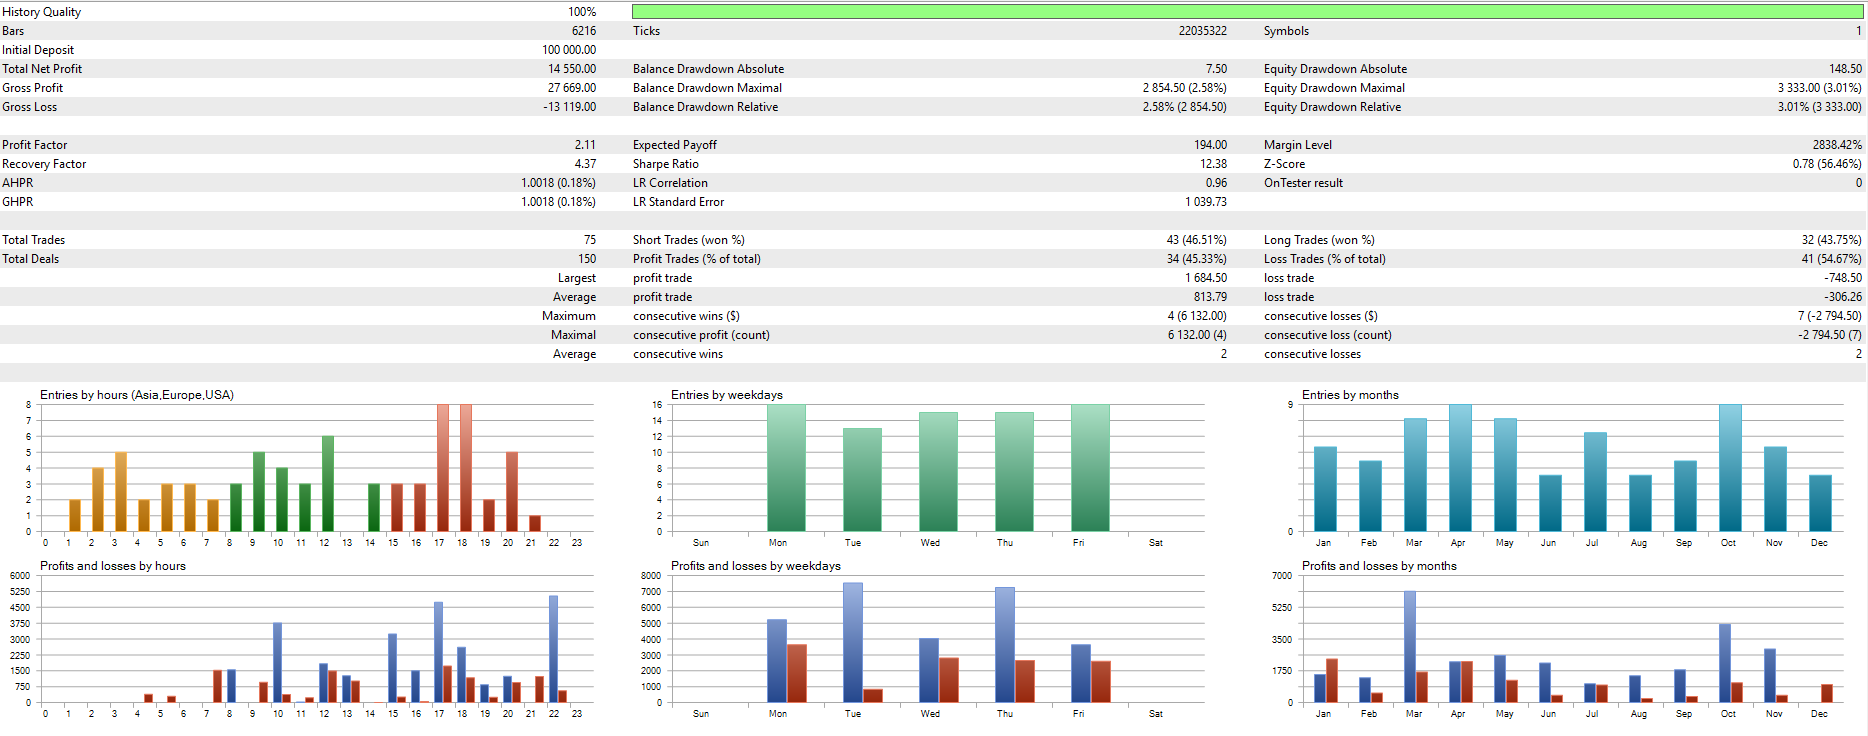
If you've run an Expert Advisor through the MetaTrader 5 Strategy Tester, you've probably seen a Sharpe ratio that looks absurd. Mine shows 12.38. A world-class hedge fund is thrilled with 2. So is the EA six times better than Renaissance Technologies? No. The number means something different, and once you know what, it becomes useful.
What MT5 is actually calculating
The textbook Sharpe ratio is annualized: average yearly return above the risk-free rate, divided by the yearly standard deviation of returns. MT5 doesn't do that. It takes the results of each individual trade, computes the average profit per trade divided by the standard deviation of profit per trade, and reports that. It's a per-trade Sharpe, with no time scaling and no risk-free rate.
That matters because a per-trade figure and an annual figure aren't comparable at all. A strategy that makes a small, consistent profit on each trade can show a per-trade Sharpe of 10 or more while delivering a perfectly ordinary annual return.
Converting it yourself
Here's the rough conversion, and you can do it with any backtest report. Export the trade list, compute the mean and standard deviation of profit per trade, then annualize by multiplying the per-trade Sharpe by the square root of trades per year.
Worked example from my EA, 75 trades over one year on EURUSD:
Average trade: about 194 dollars. Standard deviation of trade results: about 650 dollars. Per-trade Sharpe: 194 divided by 650, about 0.30.
Annualized: 0.30 times the square root of 75 trades per year, about 2.6.
So the honest number for this backtest is roughly 2.6, not 12.38. That's still good, but it's in the range of real strategies, not fantasy. And it comes with the usual caveat: it's a backtest, over one year, with 75 trades.
Why 75 trades is the bigger caveat
A Sharpe ratio from 75 trades has a wide margin of error. The standard error of a Sharpe estimate is roughly 1 divided by the square root of the number of trades, so with 75 trades the estimate could easily be off by 0.1 or more on the per-trade figure, which is a lot after annualizing. The same strategy would need several hundred trades before the Sharpe estimate is tight enough to lean on.
That's why I report the out-of-sample result alongside it. On data the strategy was never optimized on, the profit factor came in at 1.7 versus 2.11 in sample. A drop is expected. A collapse would be the red flag.
How to check any EA you're considering
Download the free demo from the Market. Run it in the Strategy Tester on the symbol and period the seller shows. Then look past the Sharpe to the things that survive the conversion: profit factor, win rate, average win versus average loss, maximum drawdown, longest losing streak, and the trade count. If the seller only shows a huge Sharpe and a smooth equity curve, ask for the trade count and the out-of-sample result.
The numbers above are from FibRetrace, which you can run in the Strategy Tester yourself from the free demo on the Market. Check my math.



![[iVISTscalp5]: XAUUSD. Forecast First. Market Reaction Afterwards](https://c.mql5.com/6/1035/splash-preview-777232.png "[iVISTscalp5]: XAUUSD. Forecast First. Market Reaction Afterwards")