A common problem with published trading tests is selection you cannot see.
The trades were chosen after the outcomes were known. The bad days are
described as "outliers." The screenshots are the good ones.
I ran this differently, and the constraint is the whole point: I wrote the
rules down first, and then I took every single setup that met them. No
skipping a signal because the session felt wrong. No quietly dropping a trade
that went badly. Seventeen setups qualified, seventeen trades were taken, and
all seventeen are in this article with a screenshot.
Seven reached target. Six closed at breakeven. Four hit the full stop.
XAUUSD, M5, 3 to 19 August 2026, in a simulator. Here is all of it.
The rules
Four rules, fixed before the first trade.
Trade only between 10:00 and 17:00 broker time — from the London open into the New York morning. This is an entry window, not an exit rule. Any trade already open was allowed to run beyond it.
Go long when the broader Structure was bullish and a confirmed buy signal
printed. Go short on the mirror image.
Put the stop on the Adaptive SuperTrend. Not a round number, not a guess.
Risk about 1% per trade. Move the stop to entry at 1R. Exit at roughly 2R.
I placed the targets by hand in the forex simulator, so they were not identical. Across the
seventeen trades the reward-to-risk landed between 2.00 and 2.13. I am saying
that plainly because "approximately 2R" is true and "exactly 2R" is not.
How to read one setup
Three questions, in the same order every time.
Structure is the broader directional context, bullish or bearish.
Regime is the directional state right now, and Smart Trend states it in words
on the panel: BUY ONLY or SELL ONLY. You will see it in the top-left corner
of most of the trade screenshots below.
Timing is the confirmed event that says the setup is here.
For this experiment I used Structure as a hard filter. Bullish Structure plus
a confirmed buy signal meant long, and nothing else was allowed. That was my
choice for this test, not something the indicator forces. Smart Trend shows
you Structure, Regime and Timing separately precisely so you can decide which
of them binds for your own style.
One more thing you will see repeatedly. The numbered ladder on the right of
each chart is the simulator's risk ruler: 0.0 is the stop, 100 is entry, 200
is 1R, and 300 is the 2R target. Once you know that, every screenshot below
reads itself.
Week one
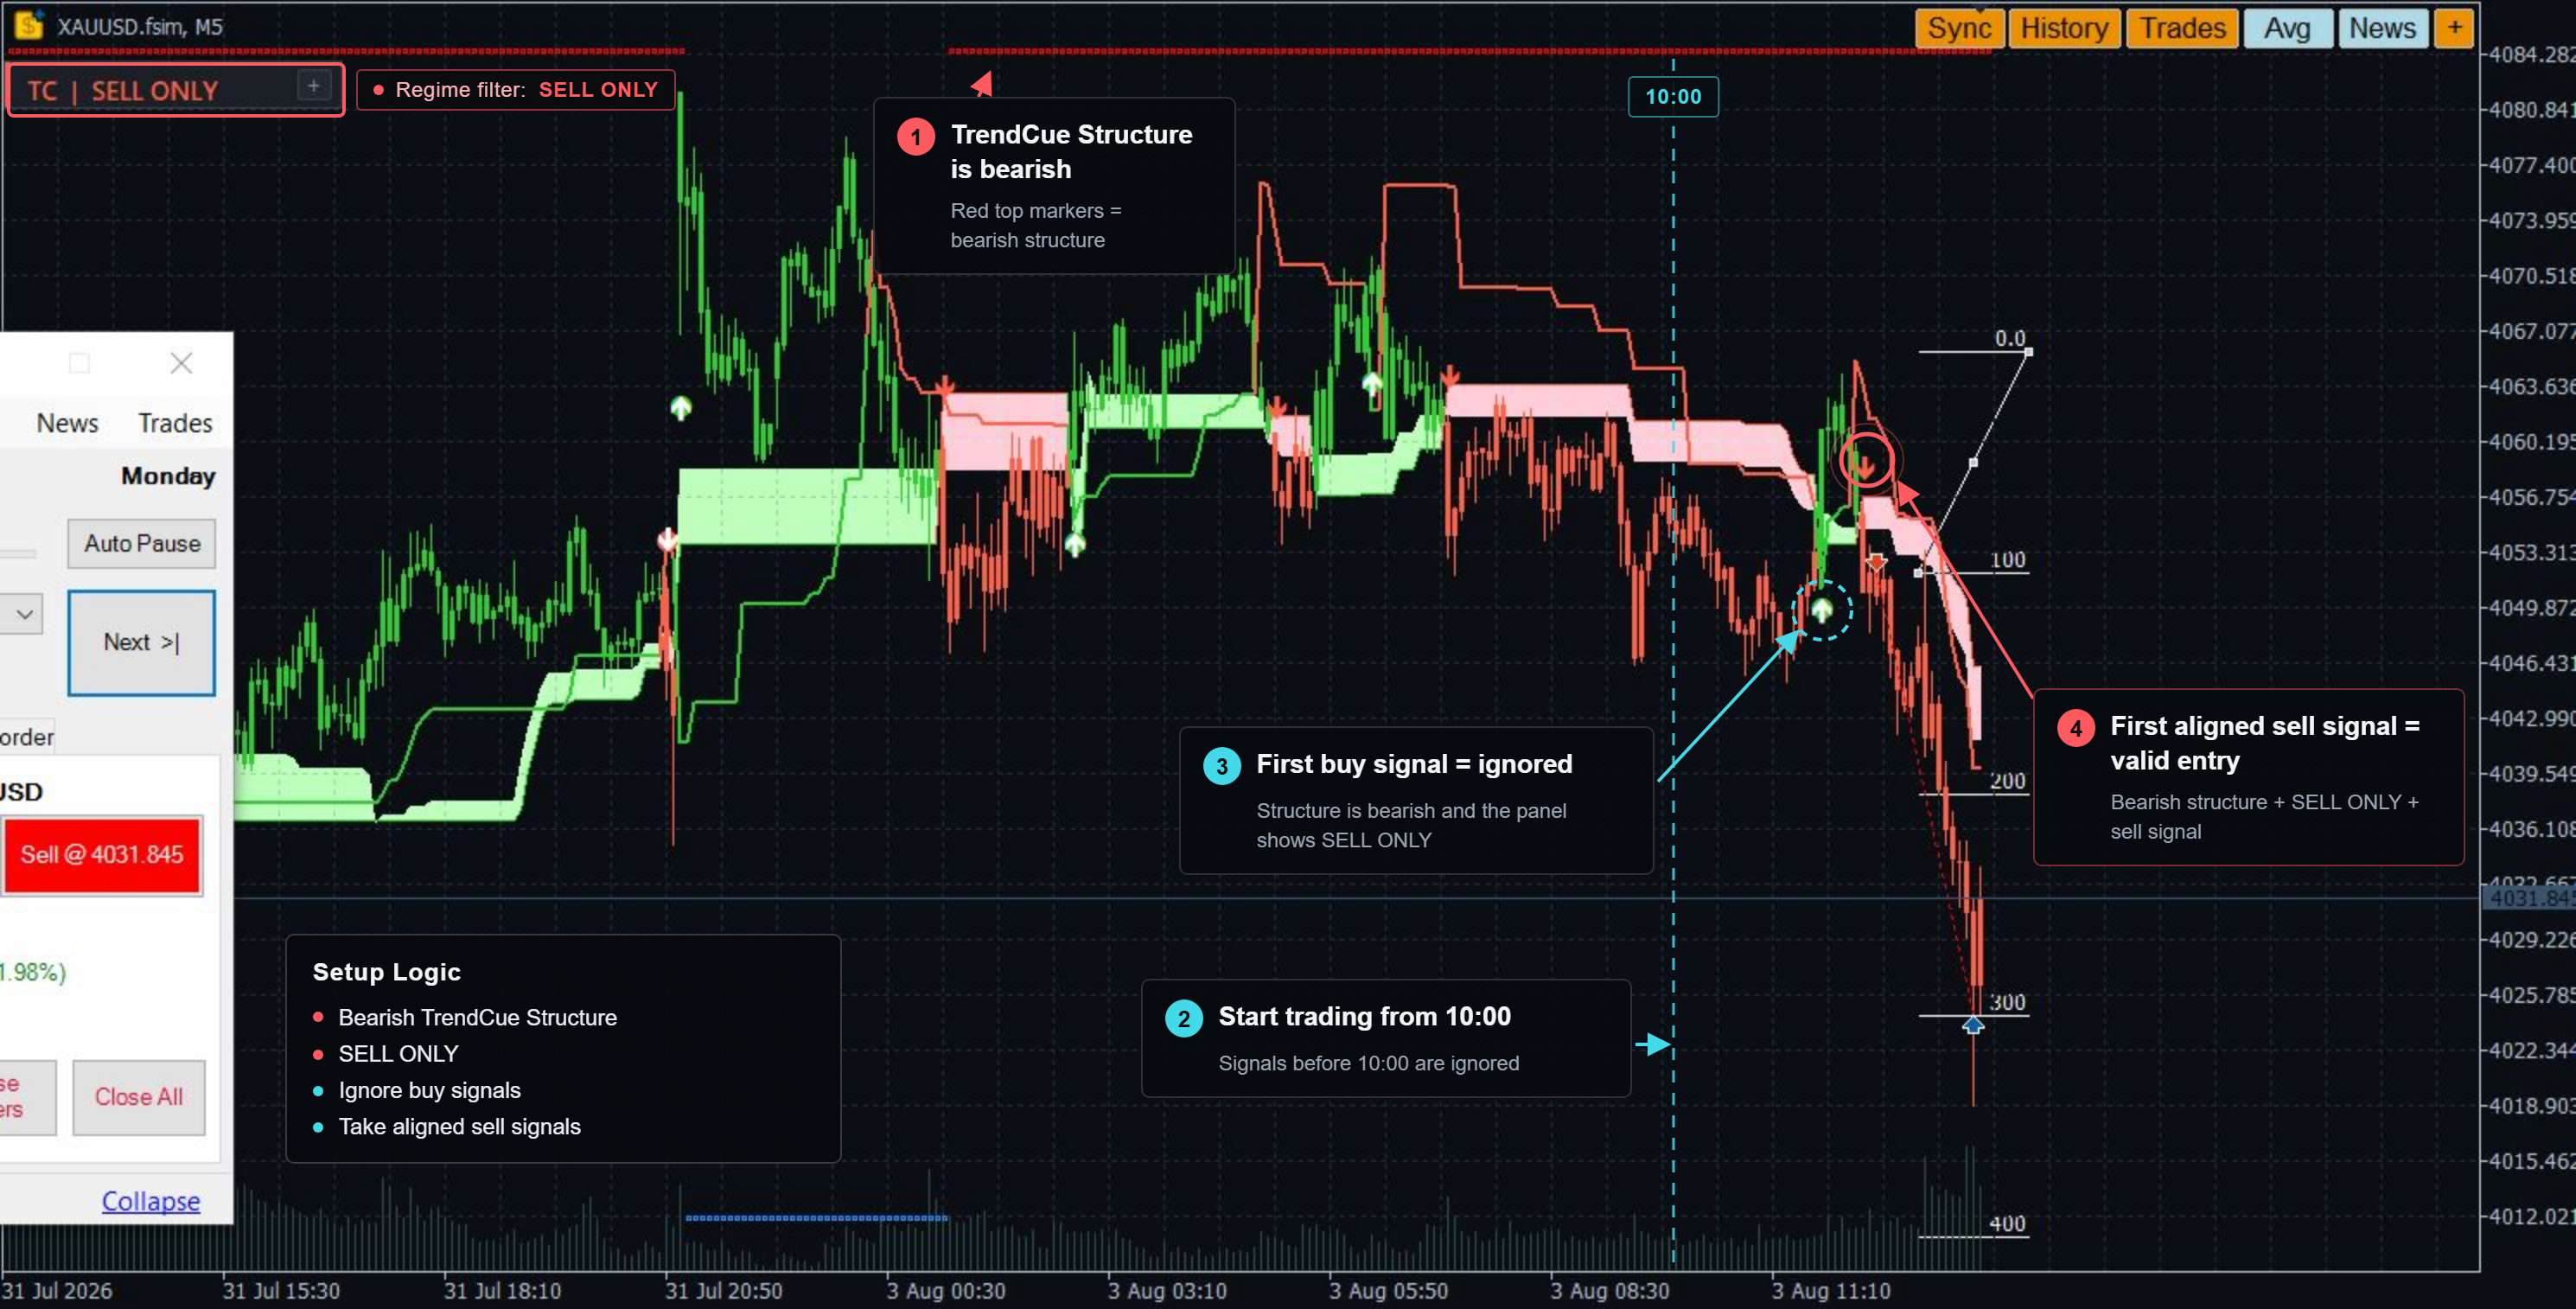
**Monday 3 August - Trade 1, short, target.** The first setup of the test
went straight to 2R. A start like this is pleasant and proves nothing.
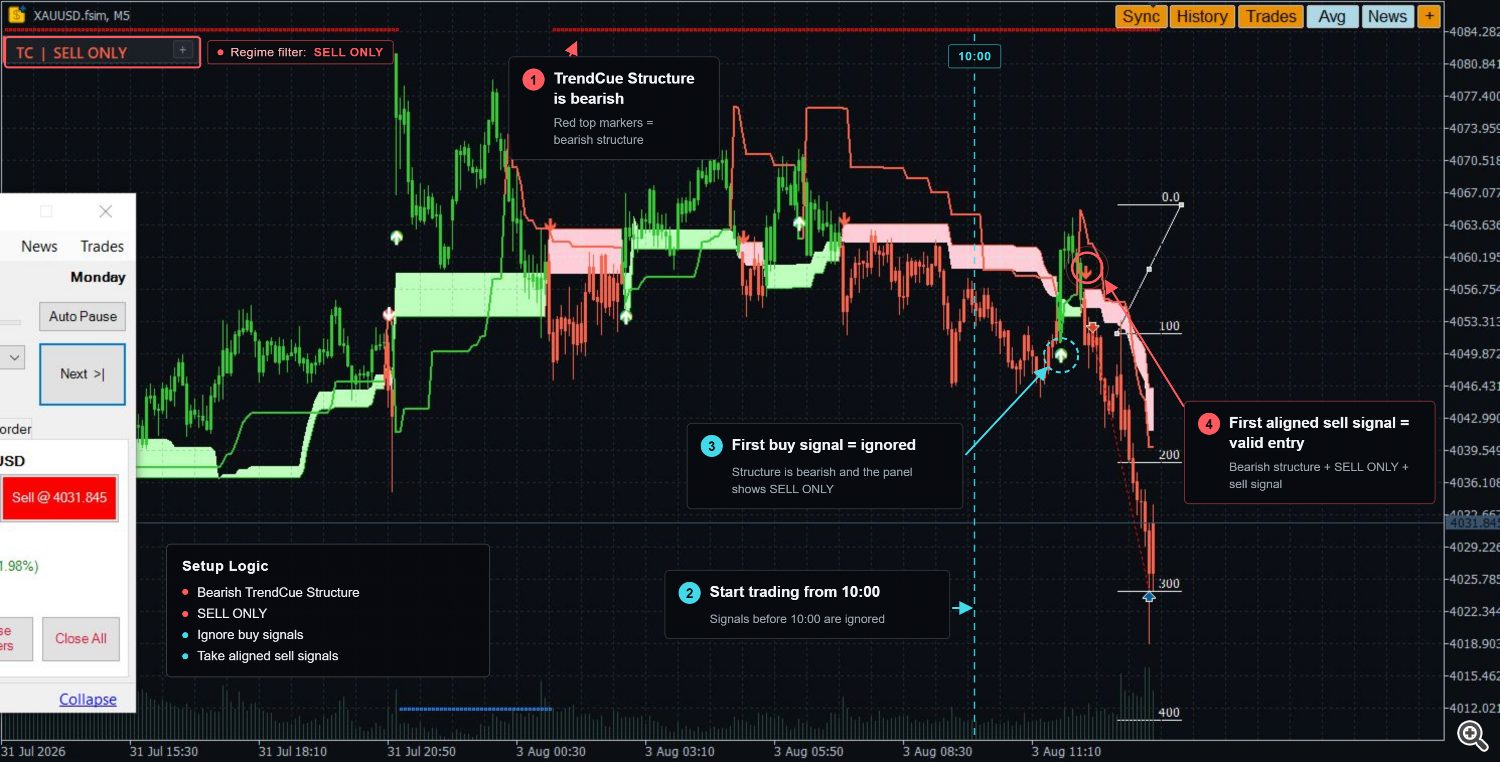
Trade 1, 3 August. Short, target reached.
**Tuesday 4 August - Trade 2, long, breakeven.** It moved in my favor, the
stop went to entry, and then it came back and took me out flat. On the same
screen you can see what Gold did afterwards.
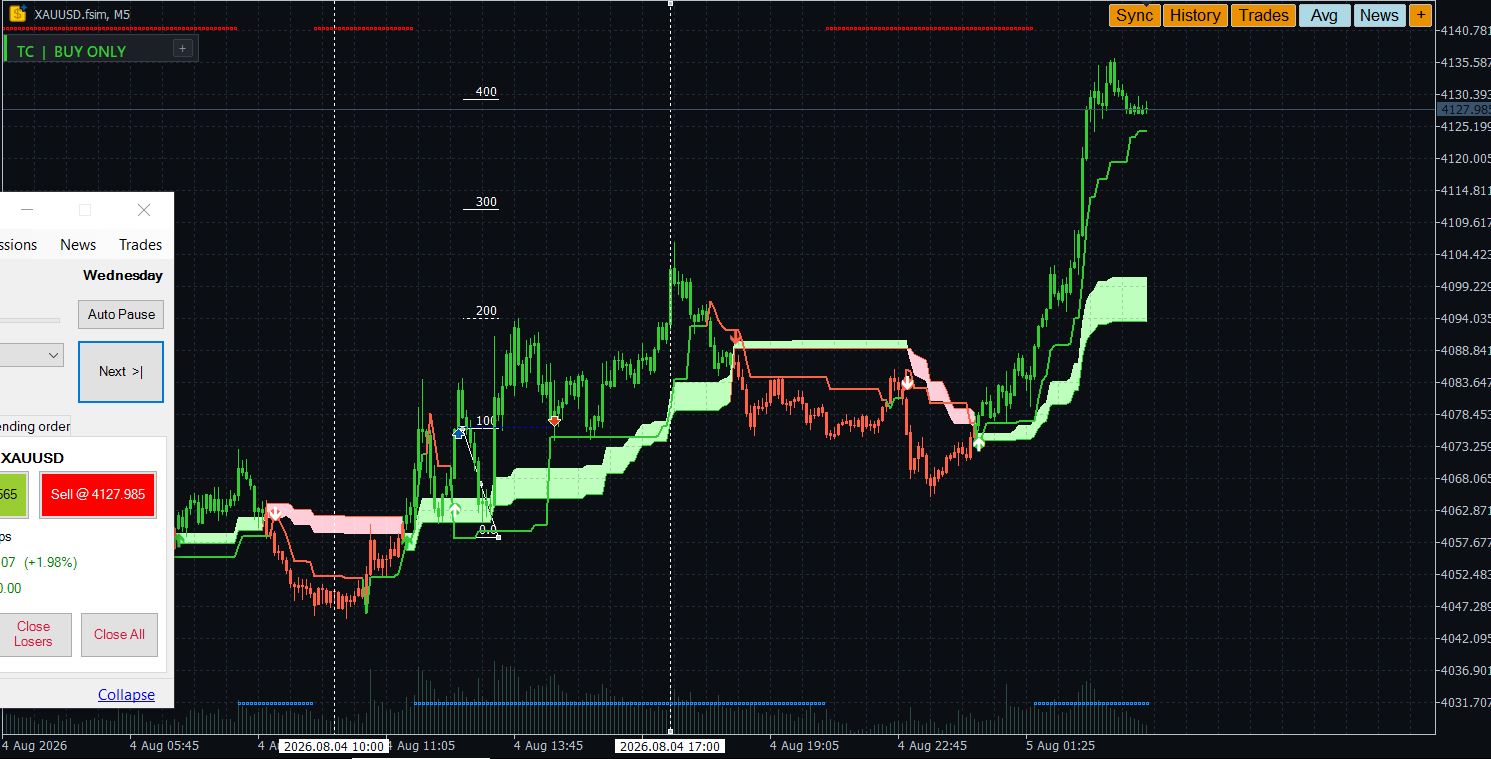
Trade 2, 4 August. Stopped at entry, then Gold ran without me.
The trade moved to breakeven, then price continued in the original direction. This is where traders are often tempted to change the rules after the fact. Don’t. Execute the written plan like a machine — the same discipline that may cost you a winner here will protect you from a much larger loss somewhere else.
**Wednesday 5 August - Trades 3, 4 and 5, all long, all target.** Three
setups, three targets, and the account went from +2% to +8% in a session.
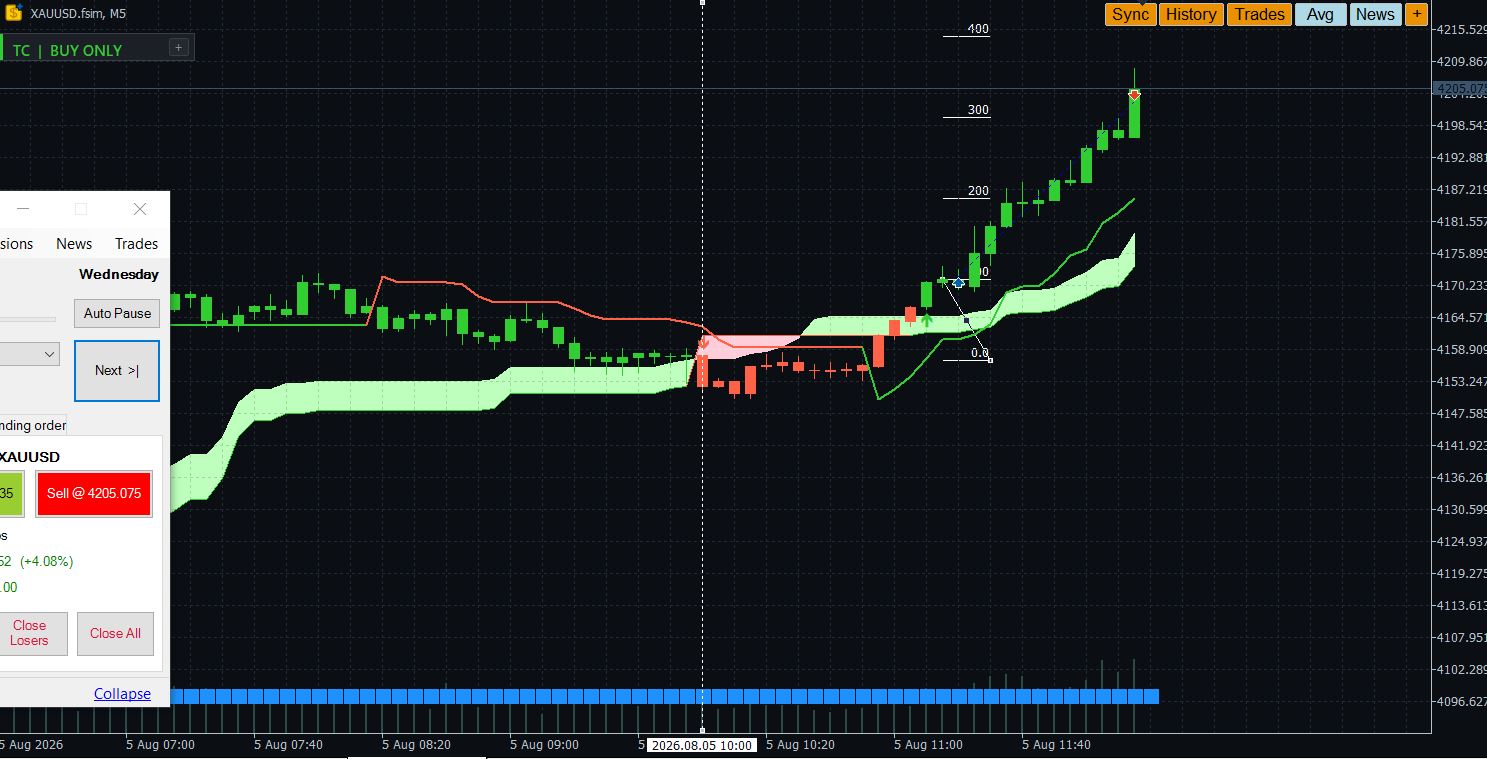
Trade 3, 5 August. First of three that day.
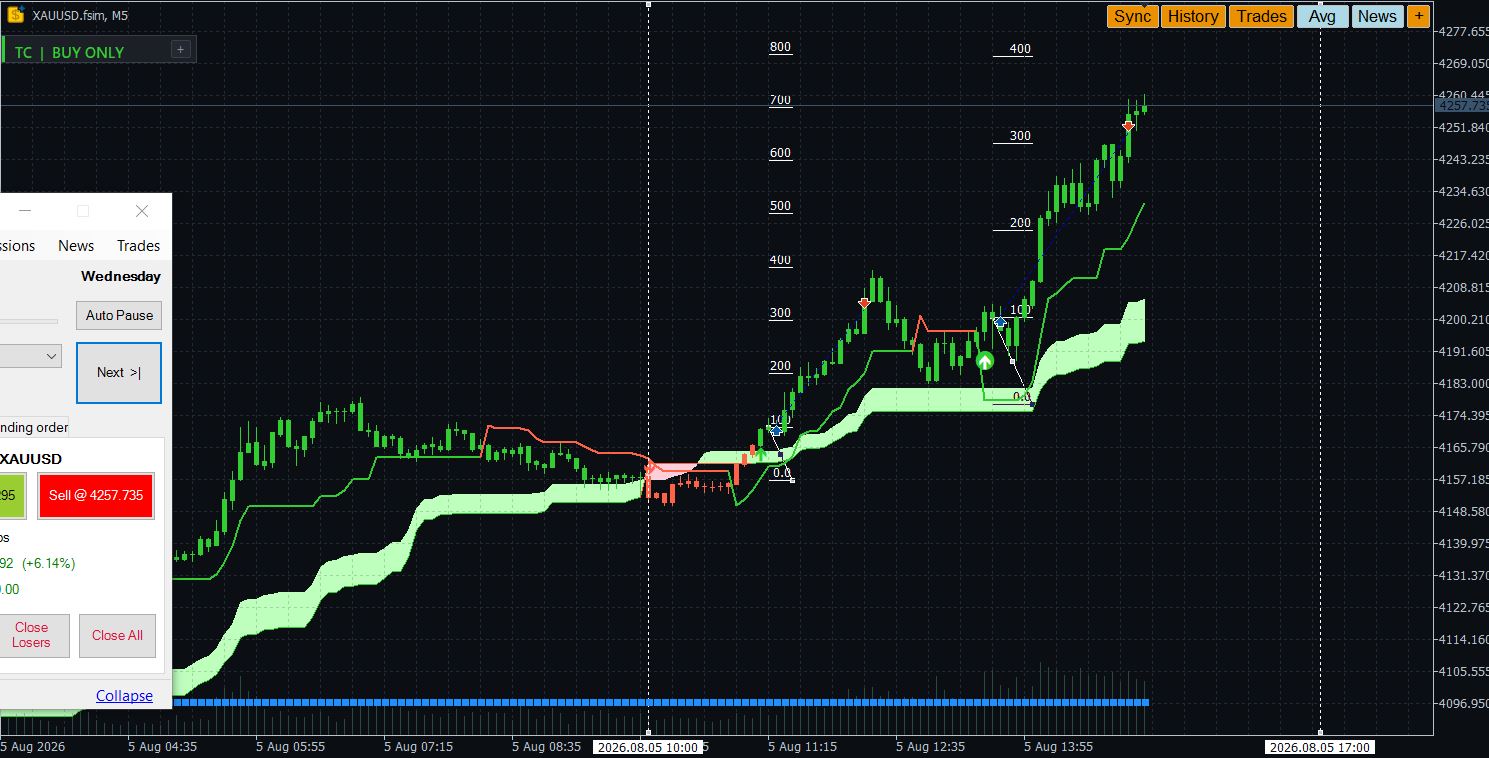
Trade 4 closed at target too. Both rulers from that morning are still on the
chart.
Three consecutive targets did not mean I had solved Gold. They were three
outcomes produced by the same rule set during a session that happened to suit
it. The rules on Wednesday were the same rules that produced two flat days
immediately afterwards.
Trade 5 is worth one extra note. I entered at 16:35, inside the window, and
it closed at 23:37, long outside it. The window decides when I may start a
trade, not when I must end one.
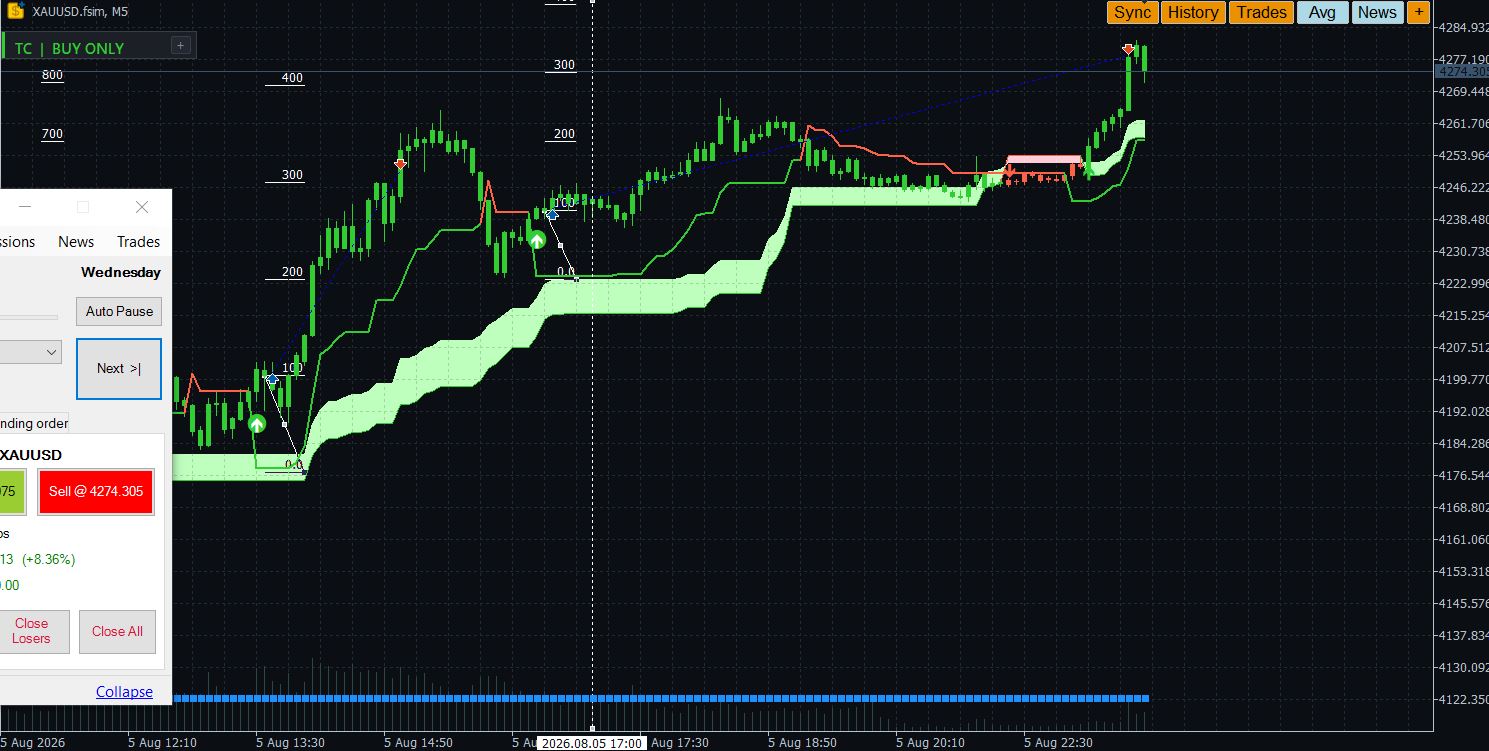
Trade 5 entered at 16:35 and closed at 23:37. The window governs entries, not
exits.
**Thursday 6 August - Trades 6 and 7, both short, both breakeven.** This is
the day that teaches the most, so here is the full progression.
Trade 6 worked. It moved past 1R and the stop went to entry.
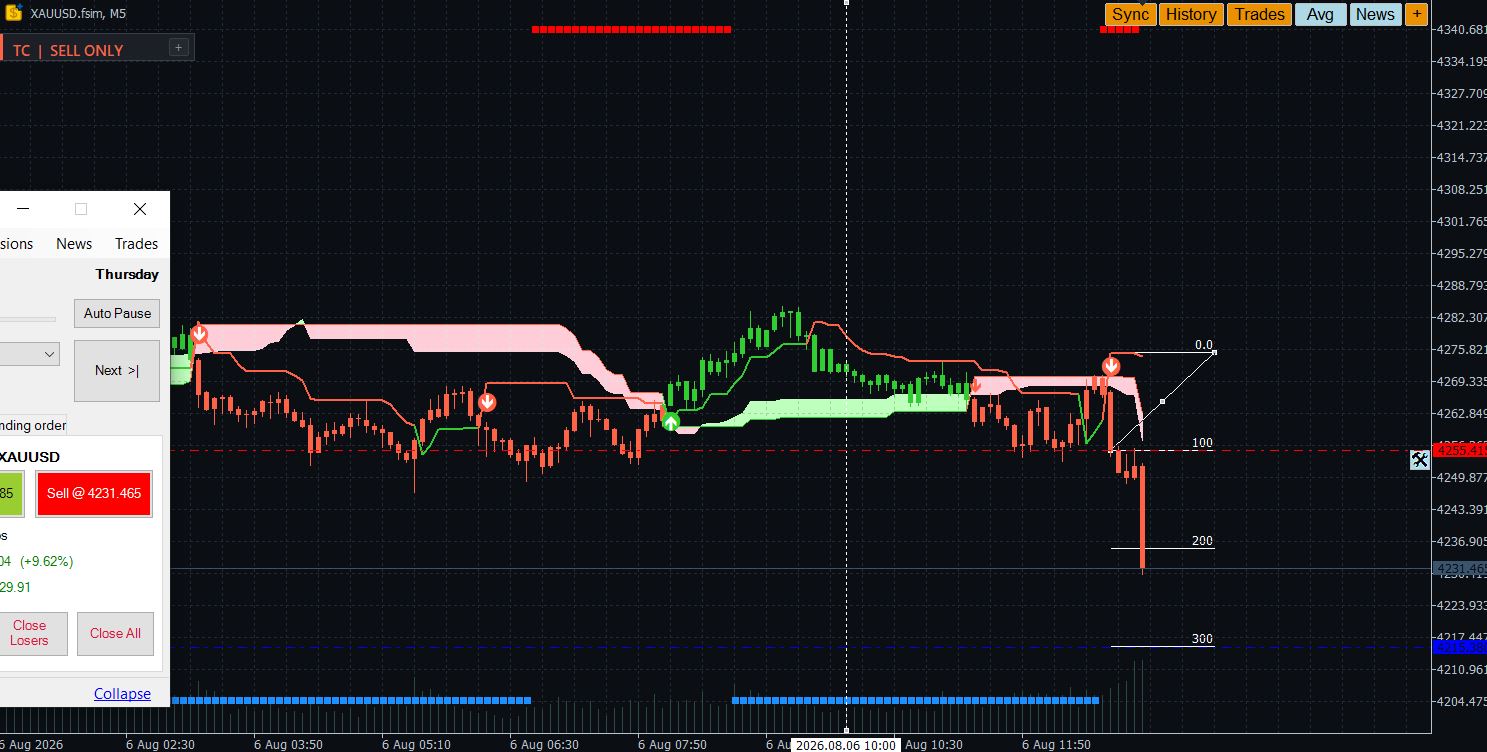
Trade 6, 6 August. It worked, moved past 1R, and the stop went to entry.
Then Gold came back and took it out at entry.
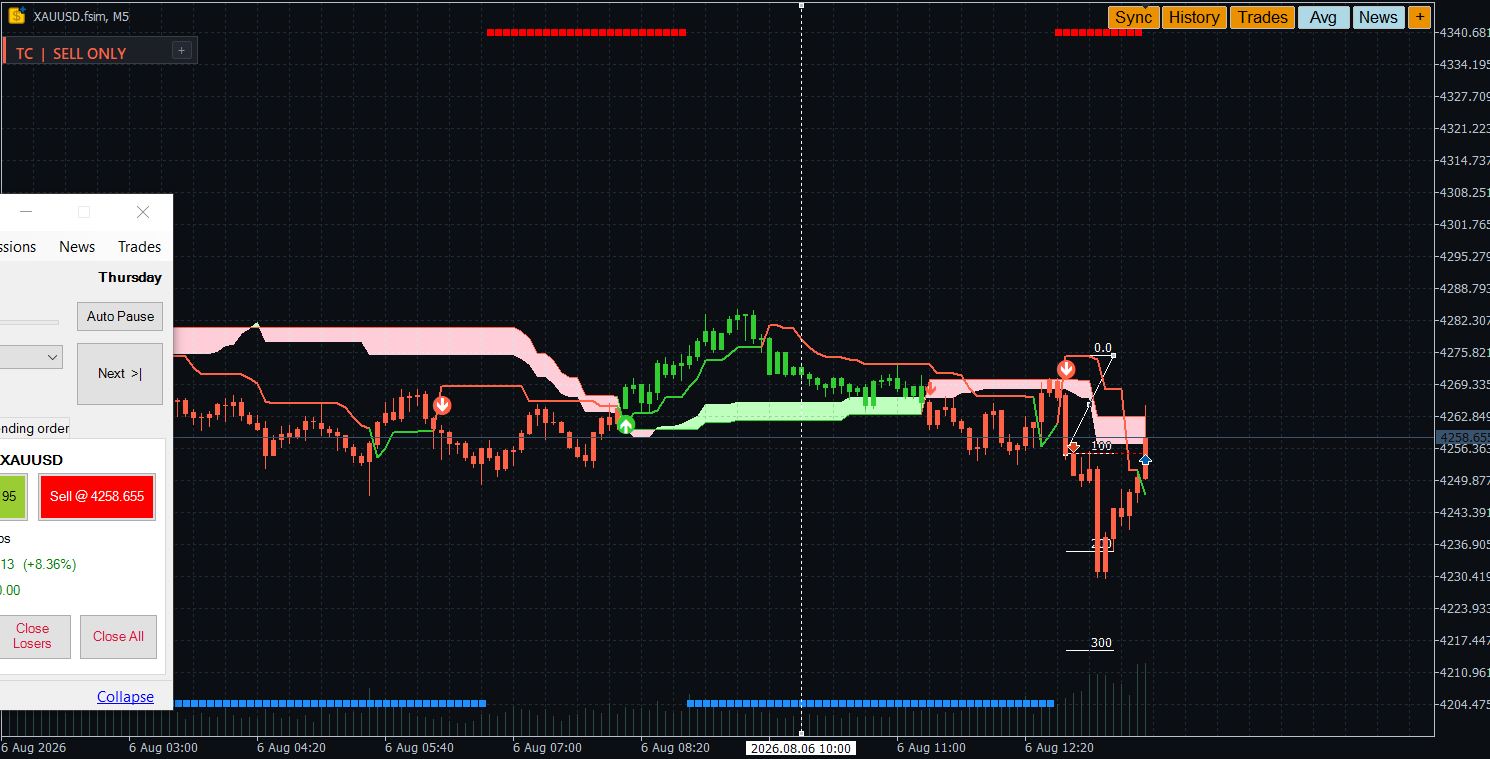
Then it came back. Flat instead of red.
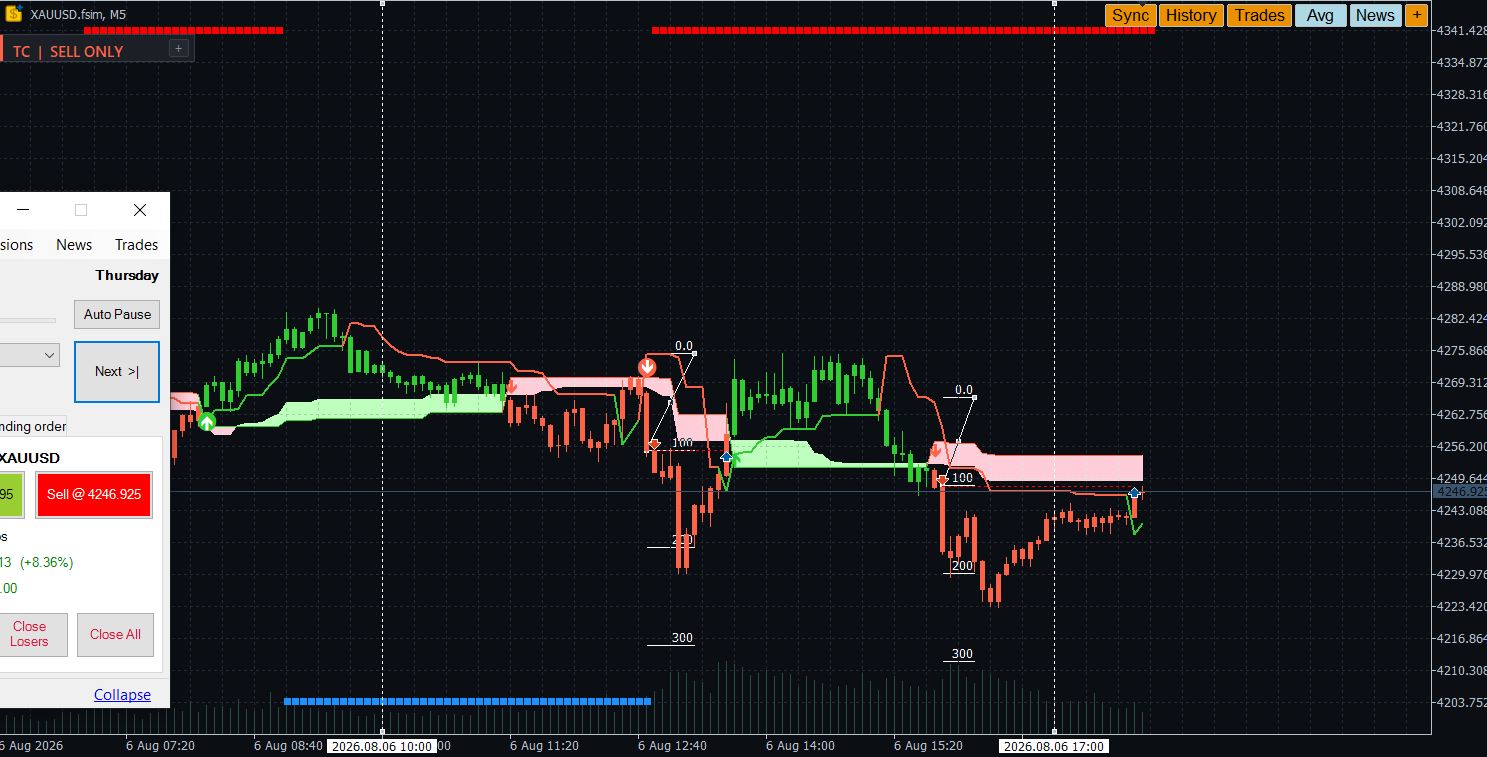
Trade 7 did exactly the same thing an hour later. Two correct reads, one flat
day.
Two correct directional reads, a full session of work, and the day closed at
exactly zero. Six of my seventeen trades looked like this. Not wins. Not
losses. Trades that were right for a while and then were not.
**Friday 7 August - Trade 8, long, breakeven.** The widest stop of the test
and therefore the smallest position. I held it through the weekend and it
closed flat on Tuesday morning, four days later, after trading past 1R.
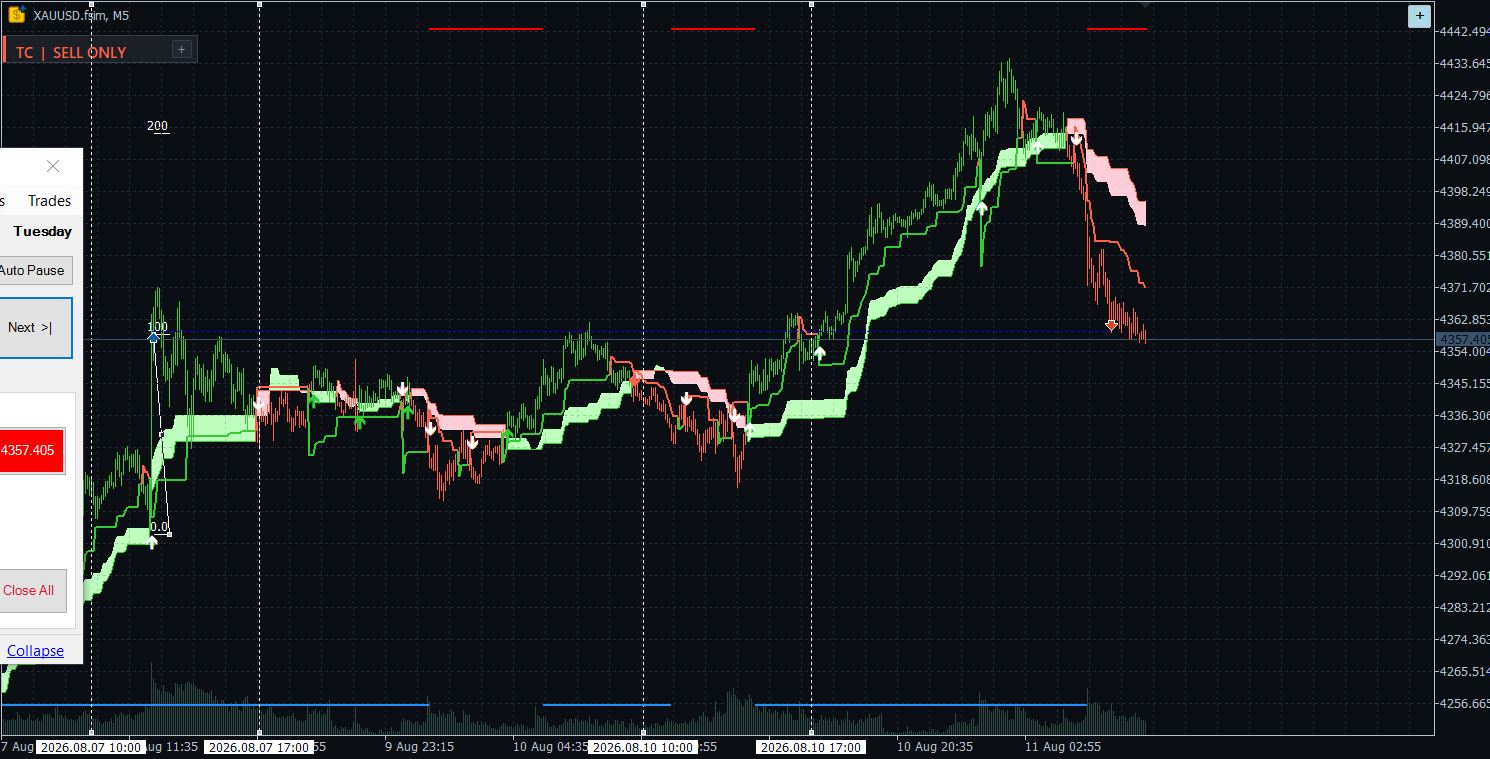
Trade 8 was held for four days, moved beyond 1R, and still finished at breakeven. While it remained open, no new trade was taken. One position, one decision at a time — the next setup only matters after the current trade is resolved.
Week two
**Tuesday 11 August - no trade.** No setup met the rules, so nothing was
taken. Doing nothing is a result too, and it is the part of a rule set most
people abandon first.
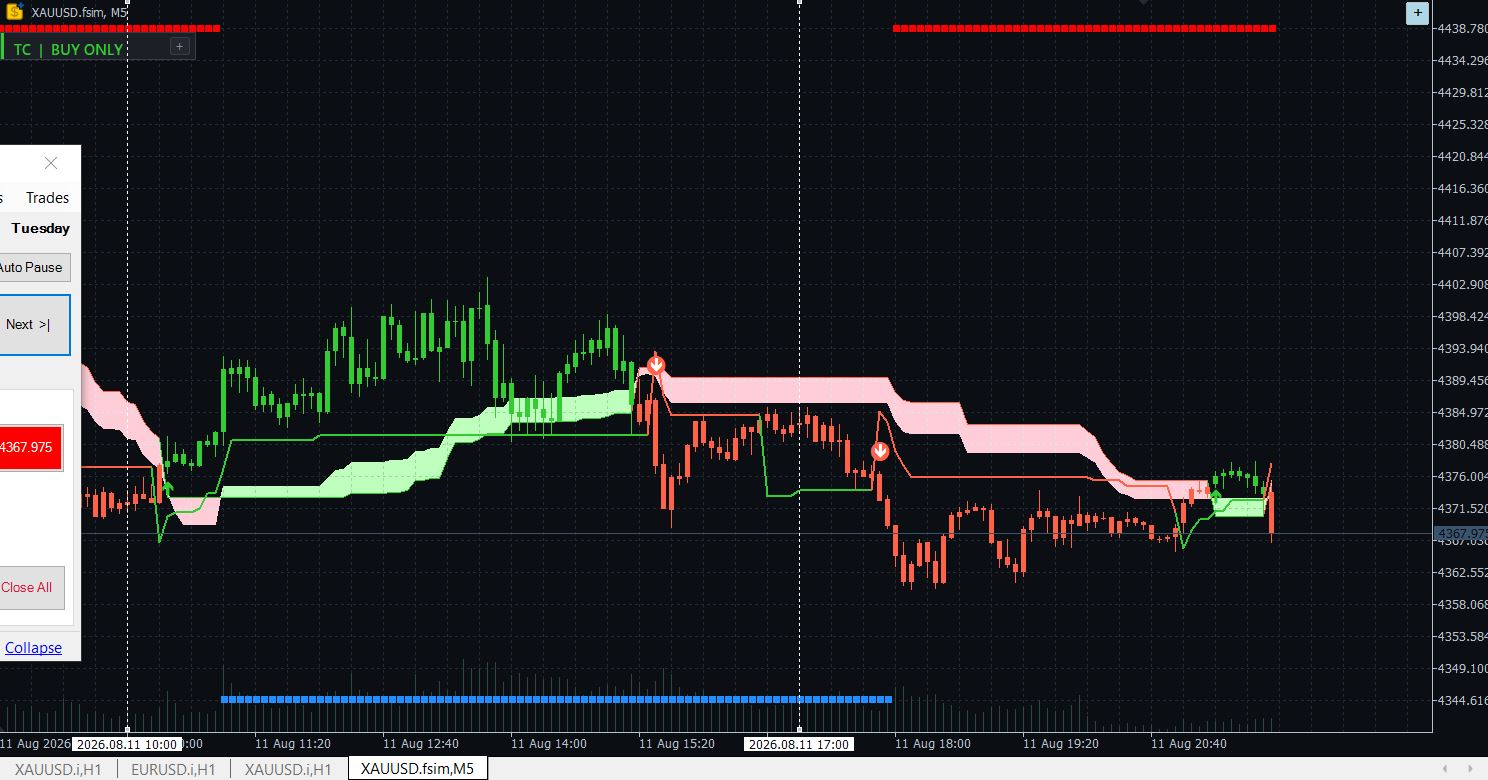
11 August produced no valid setup, so there was no trade. That is also part
of the rule set.
**Wednesday 12 August - Trade 9, long, full stop.** This is the trade I got
wrong, and not in the way you would expect.
The trade crossed 1R. At that point my own rule said the stop should move to
entry.
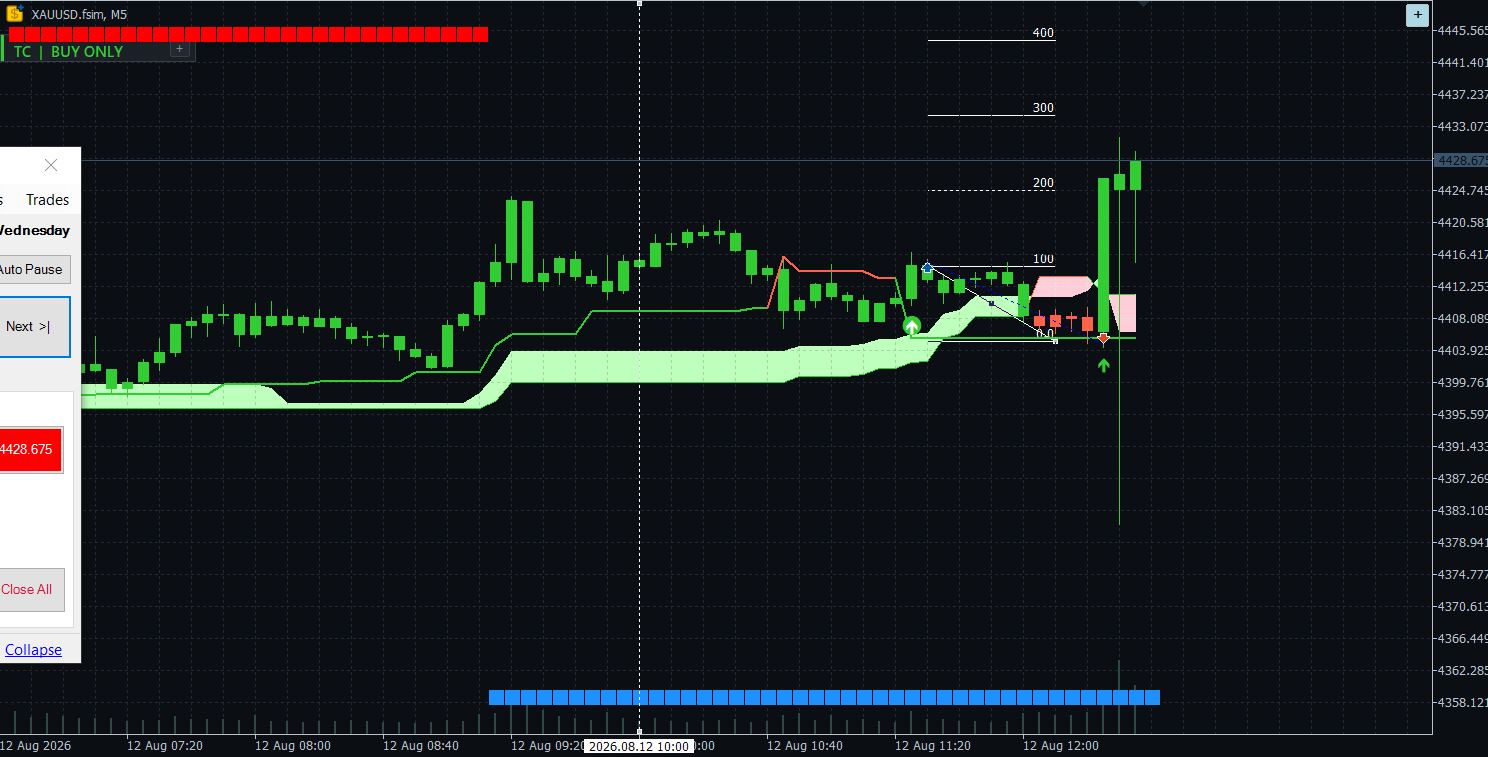
Trade 9, 12 August. It crossed 1R here. The stop was still at its original
level.
I did not get it moved. The reversal came inside a handful of M5 candles,
price ran back through the original stop, and the trade took the full 1%
loss. Then Gold turned around and went where I had expected it to go all
along.
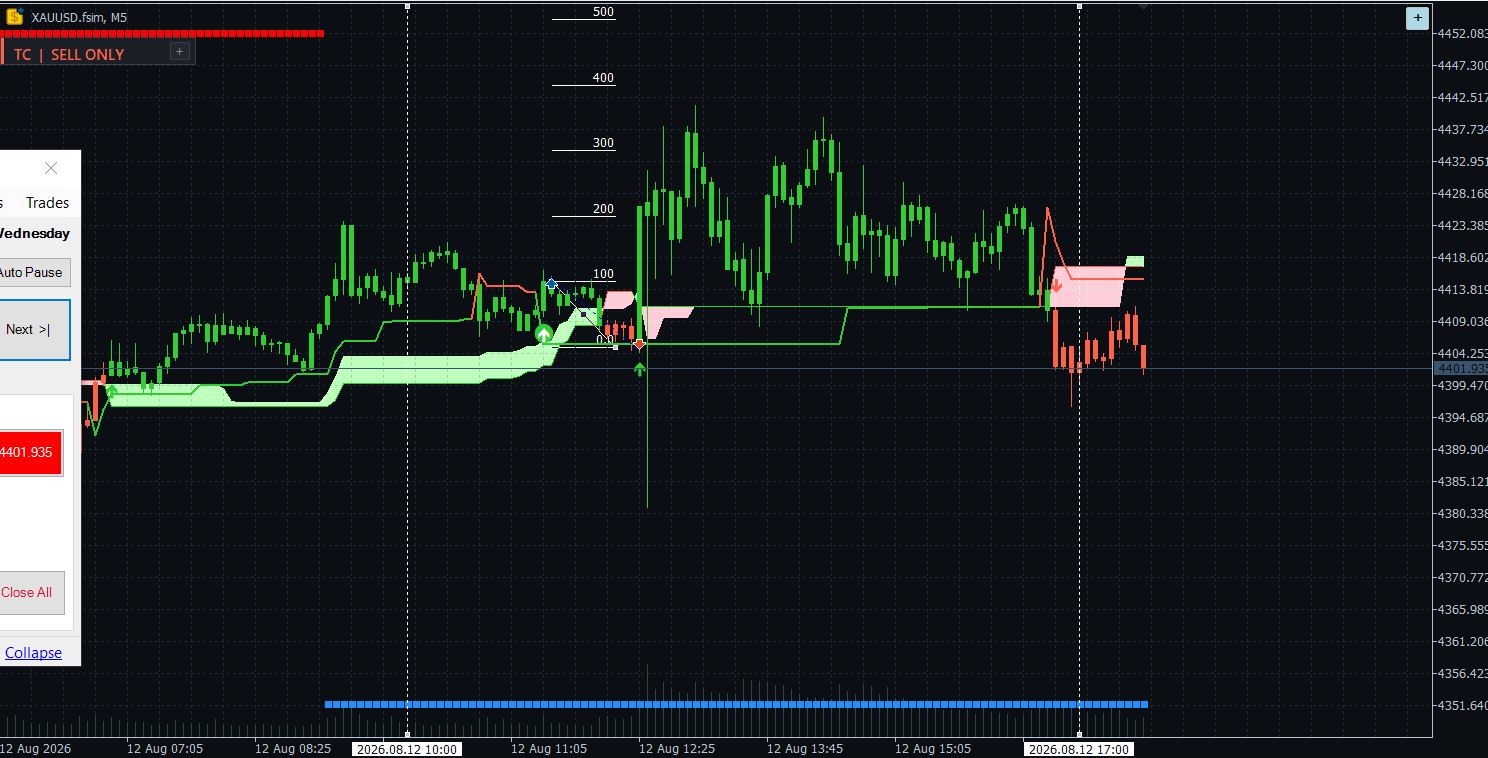
Minutes later it reversed through the stop. Then Gold went where I had
expected - without me.
Two things about this trade, and I want to be precise about both.
Having a risk-management rule is not the same as executing it. The plan said that once price moved beyond 1R, the stop had to move to breakeven. I was managing the trade manually, reacted too late, and the reversal turned what should have been a protected trade into a loss.
This is one reason I use Guardian for trade management. It is not there to predict the market — it is there to execute the rules I have already decided on, without hesitation, distraction or emotion. Once the conditions are met, the management action is automatic.
There is another lesson here: being right about direction does not make a losing trade a winner. Price eventually moved lower, but the trade I actually executed was a loss, so it remains a loss in the results. A trading journal should record what happened, not what could have happened.
**Thursday 13 August - Trades 10 and 11, breakeven and breakeven.** A long in
the morning and a short in the afternoon. Both worked, both came back, both
closed flat.
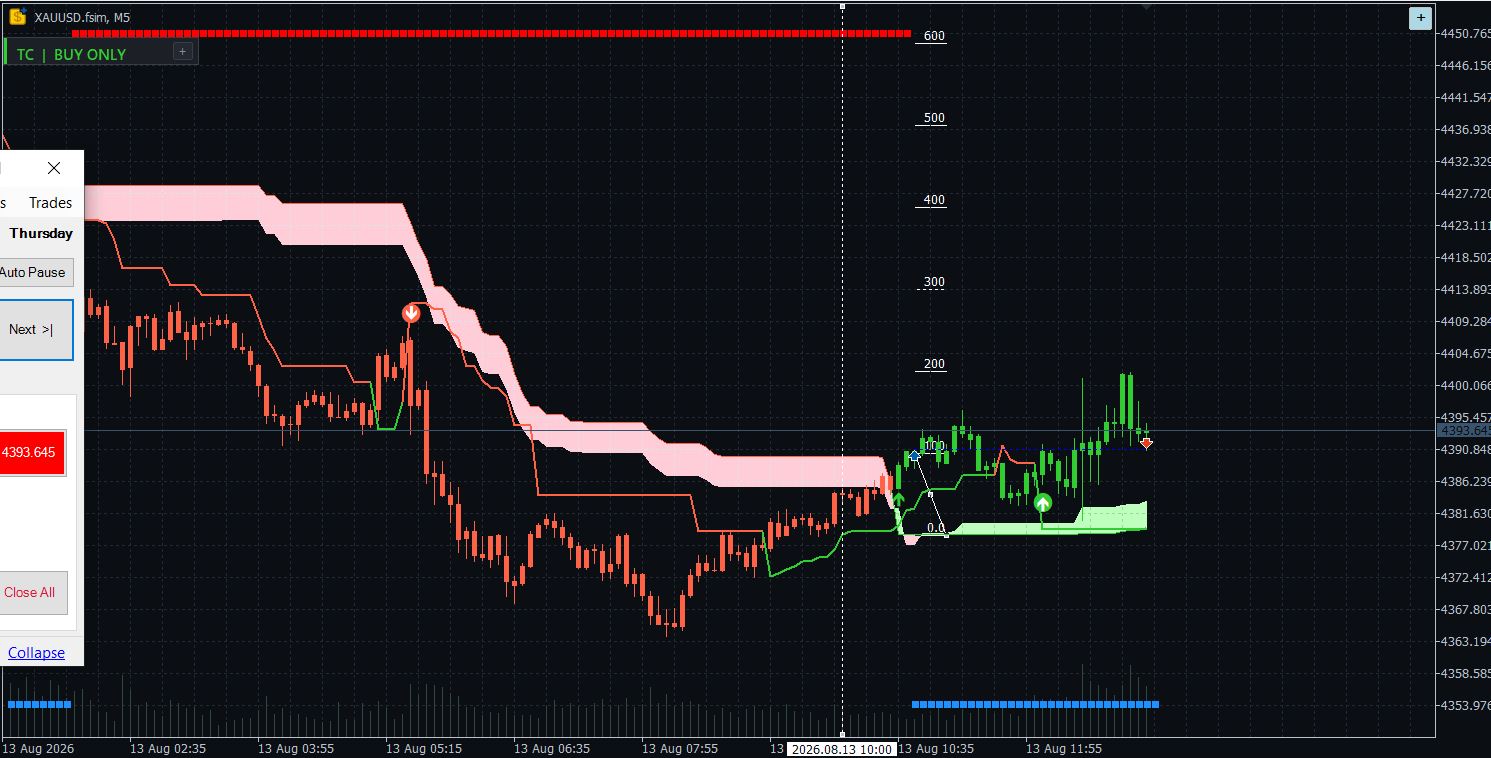
Trade 10, 13 August. Breakeven.
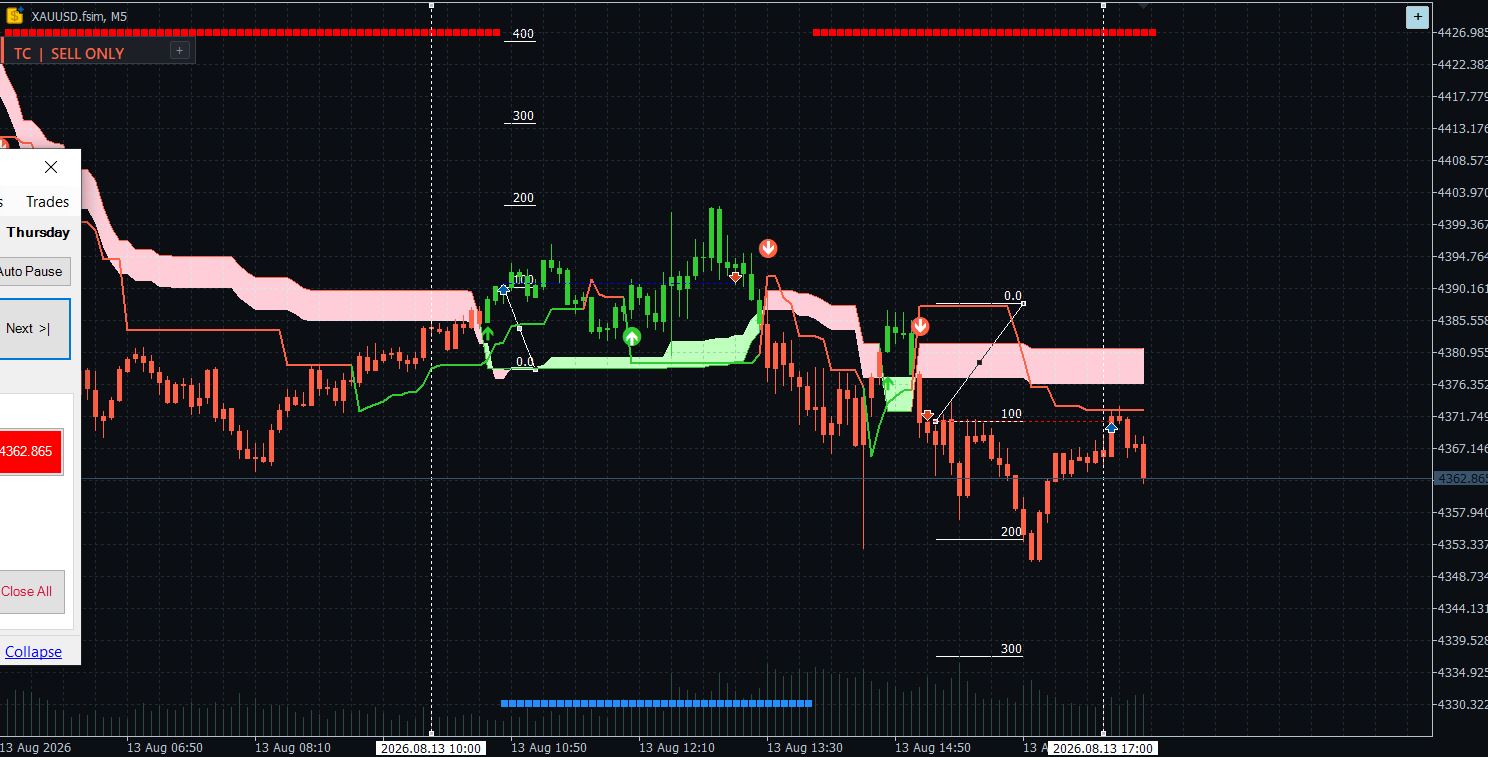
Trade 11 the same afternoon. Also breakeven.
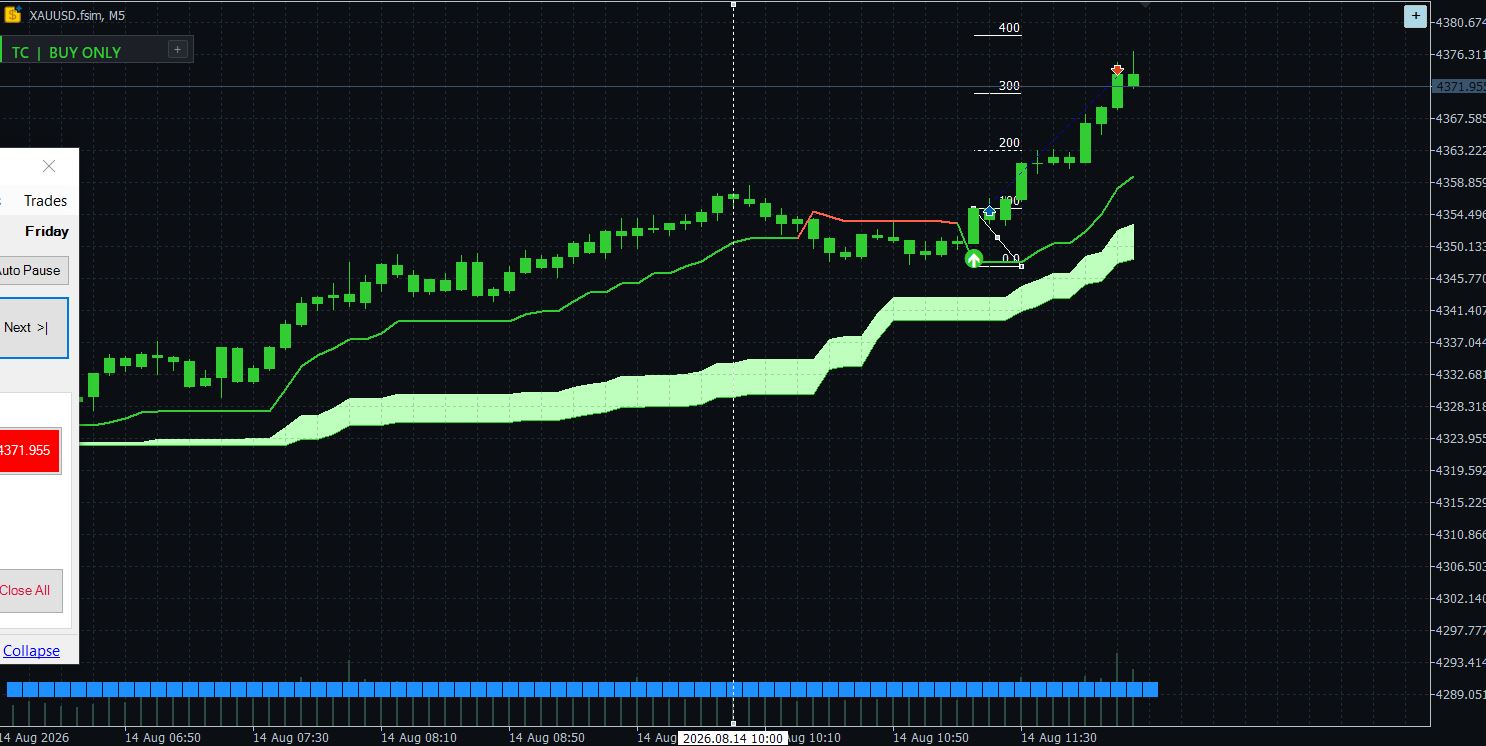
Trade 12, 14 August. Target in forty-two minutes.
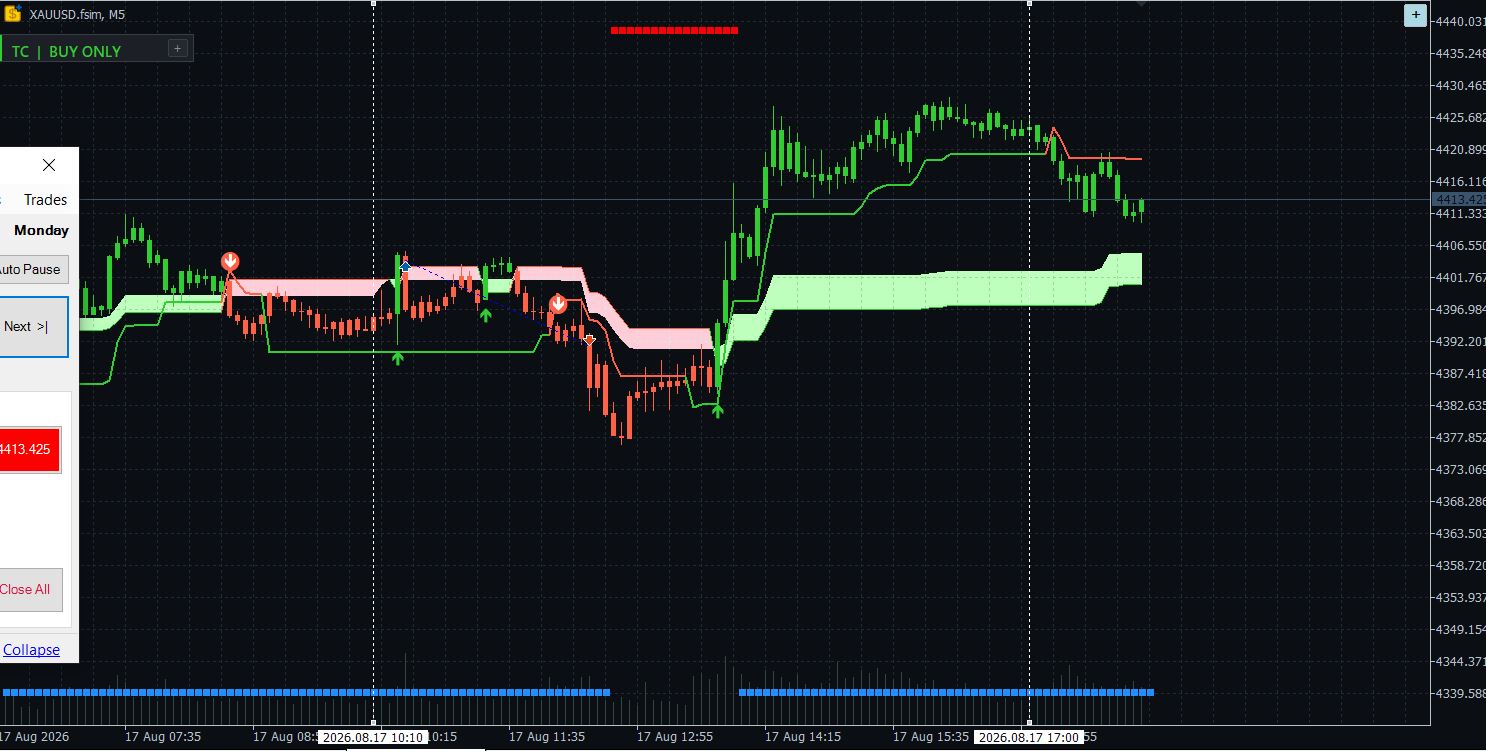
Trade 13, 17 August. Full stop. Other signals were ignored because they were not aligned with TrendCue Structure. This one was valid — and it lost.
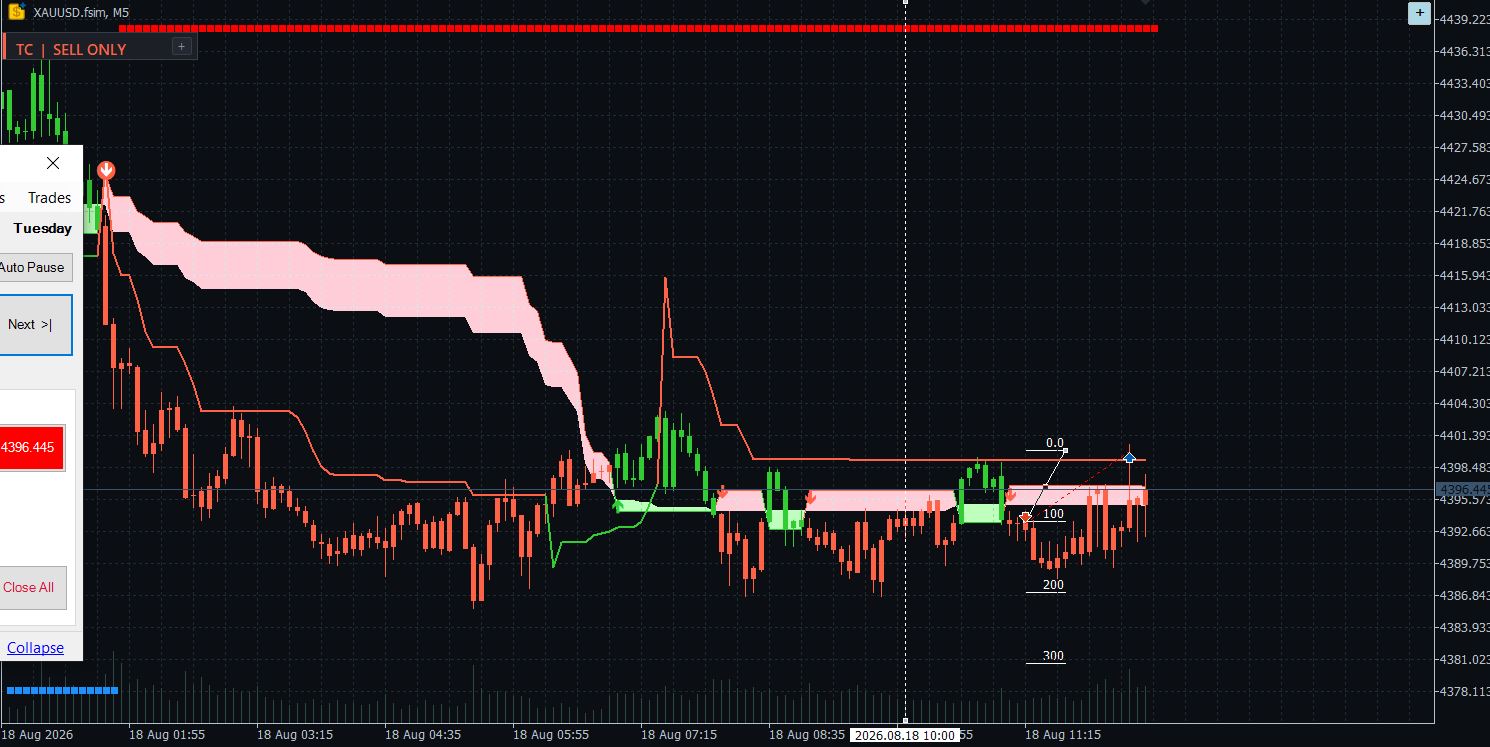
**Tuesday 18 August - Trades 14, 15 and 16.** The worst day of the test, and
then the best argument in it.
Two shorts, two full stops, about 1% on each.
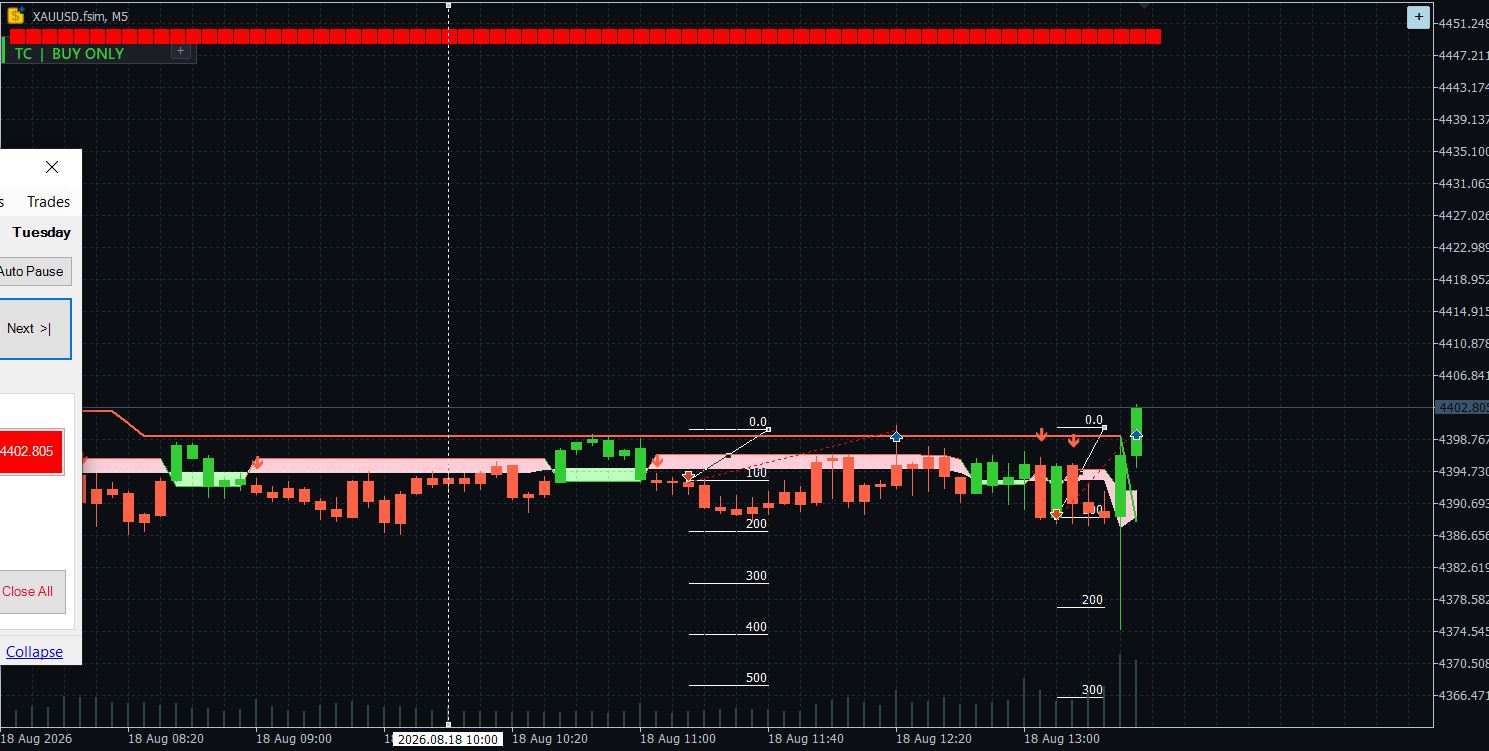
Trade 14, 18 August. Full stop.
Trade 15, ninety minutes later. Full stop again.
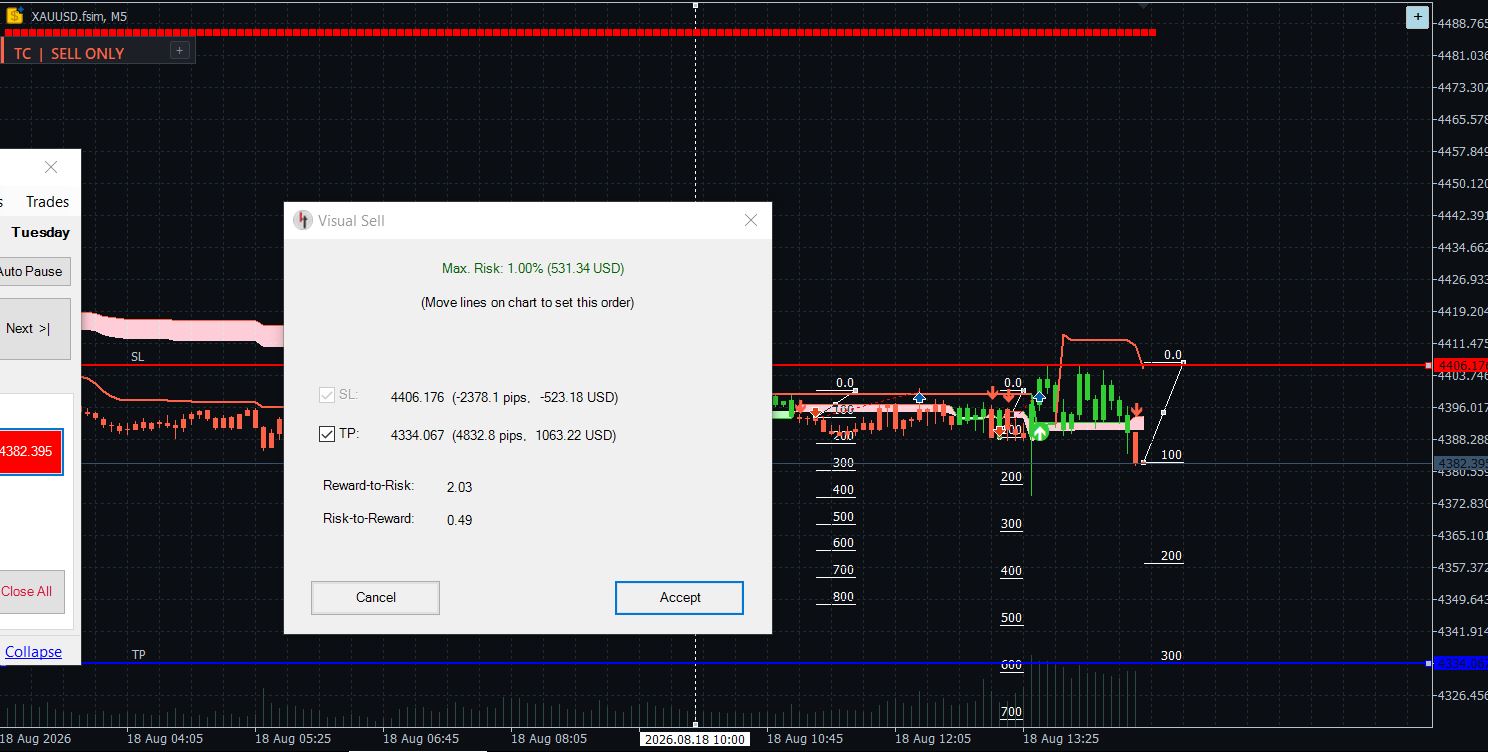
Then the rules produced a third short that afternoon. I took it because the
rules said to.
This is the moment the whole experiment was really testing. After two stops
in a session, the instinct is to stop trading, or to double the size and win
it back. A written rule set has no opinion about how your morning went.
It reached target. The day closed almost exactly flat.
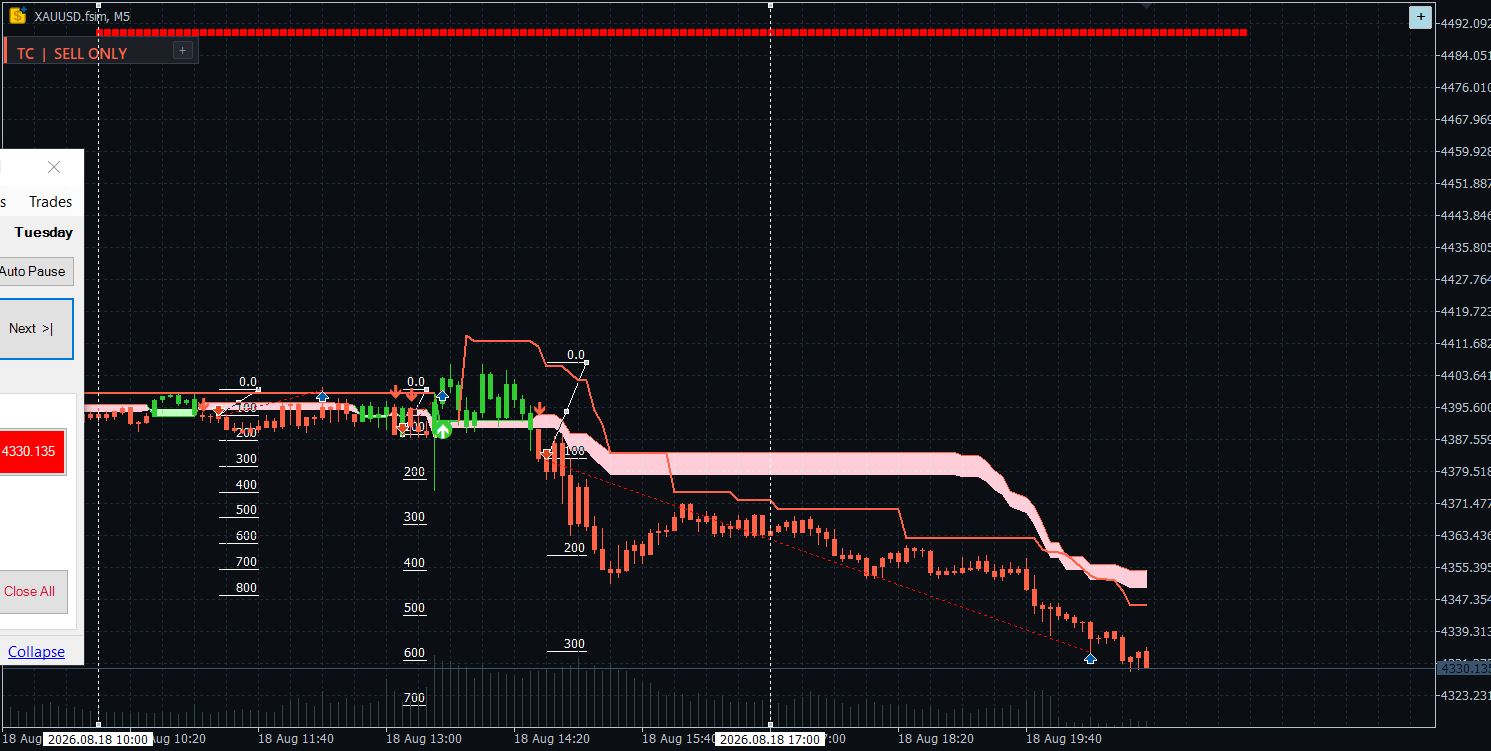
Trade 16 reached target. The day finished almost exactly flat.
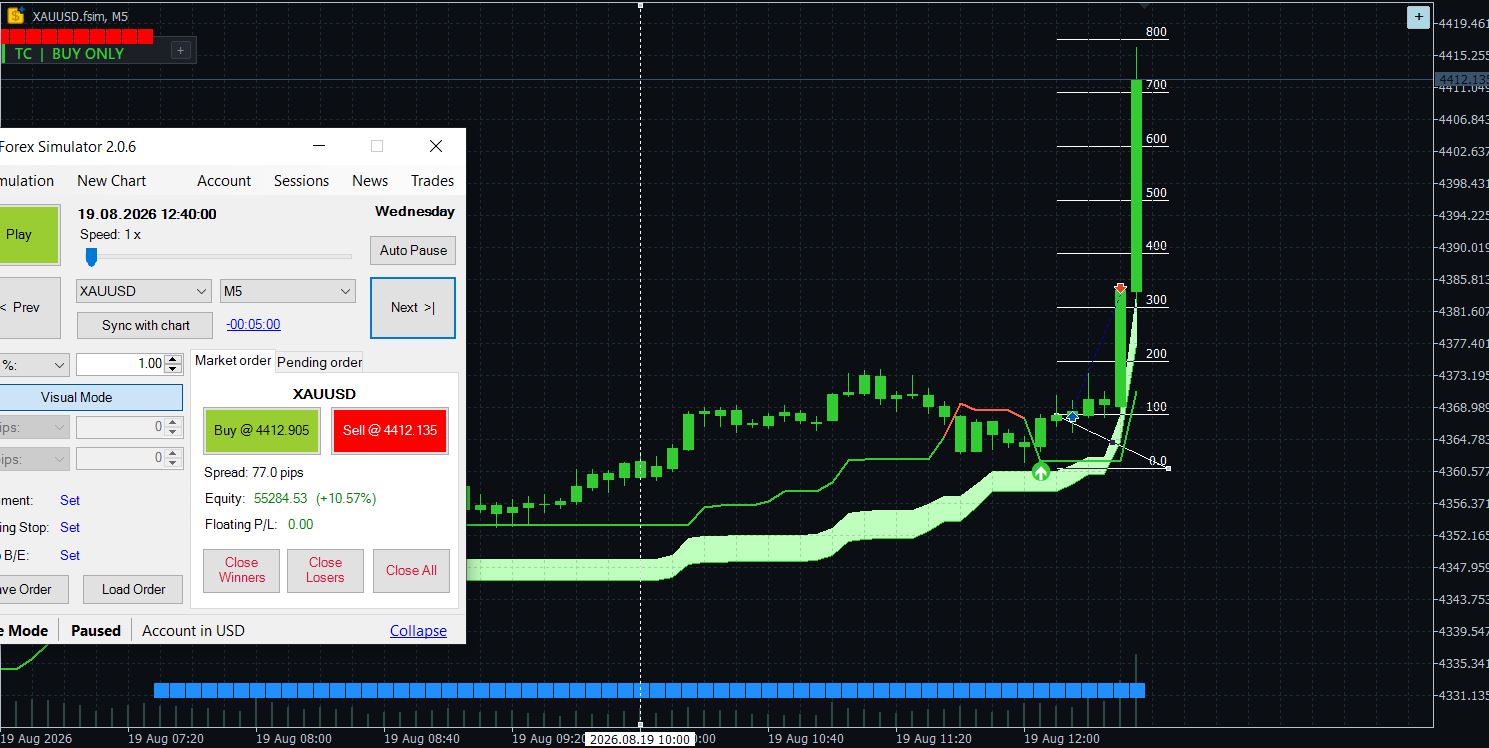
The last trade closed at target - and Gold carried on to roughly 7R. That is
what a fixed exit costs.
The complete result
Trade Date Dir Entry Stop Target R:R Result
1 03 Aug SELL 4052.055 4065.807 4024.553 2.00 Target
2 04 Aug BUY 4076.385 4058.668 4112.433 2.03 Breakeven
3 05 Aug BUY 4171.865 4157.070 4202.790 2.09 Target
4 05 Aug BUY 4201.335 4177.655 4250.354 2.07 Target
5 05 Aug BUY 4241.245 4223.945 4278.152 2.13 Target
6 06 Aug SELL 4255.415 4275.021 4215.380 2.04 Breakeven
7 06 Aug SELL 4248.095 4265.680 4212.321 2.03 Breakeven
8 07 Aug BUY 4359.405 4303.922 4470.110 2.00 Breakeven
9 12 Aug BUY 4415.545 4404.743 4437.392 2.02 Full stop
10 13 Aug BUY 4390.905 4378.602 4415.616 2.01 Breakeven
11 13 Aug SELL 4371.045 4387.849 4337.302 2.01 Breakeven
12 14 Aug BUY 4355.895 4347.383 4373.346 2.05 Target
13 17 Aug BUY 4404.325 4391.433 4430.308 2.02 Full stop
14 18 Aug SELL 4393.355 4399.888 4380.148 2.02 Full stop
15 18 Aug SELL 4388.875 4400.075 4366.060 2.04 Full stop
16 18 Aug SELL 4382.395 4406.176 4334.067 2.03 Target
17 19 Aug BUY 4368.535 4360.918 4383.851 2.01 Target
Starting balance 50,000. Final balance 55,284.53. Net +5,284.53, or +10.57%.
Profit factor 3.47. Maximum balance drawdown 3.21%.
Because every trade risked about the same 1%, the result also normalizes
cleanly: the seven targets produced +14.39R, the four stops cost -4.00R, and
the six breakevens contributed nothing either way. Net +10.39R across
seventeen trades, with an average winner of 2.06R.
One note on the report: it shows ten losing trades. Six of them closed at exactly 0.00 — those were breakevens. The simulator includes zero-result trades in the losing-trade count. Only four trades actually lost money.
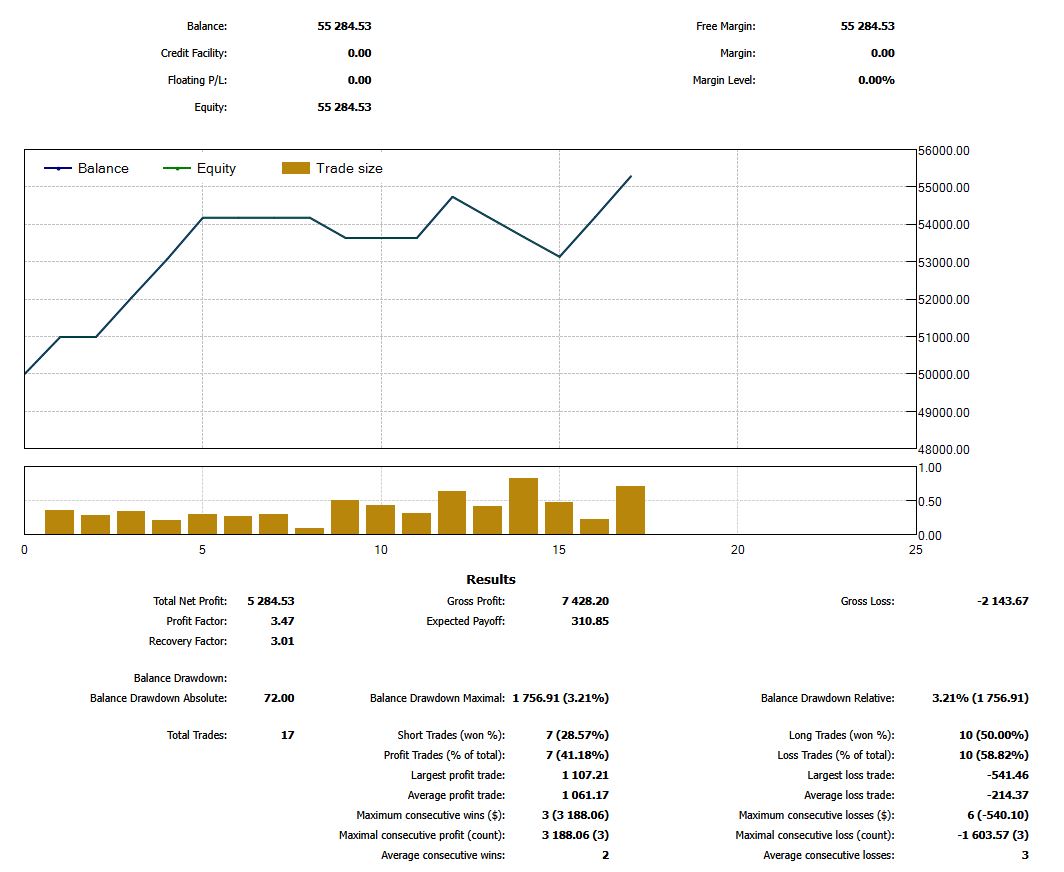
The full report behind every number in this article.
Could this survive a prop firm-style test?
Across every valid setup from 3–19 August, the workflow returned +10.57% with a 3.21% maximum balance drawdown, while risking about 1% per trade.
What mattered most was not one perfect trade, but whether the same rules could keep producing opportunities while keeping the losing periods under control.
Where the tools fit
Smart Trend provides the context, direction and timing: Structure, BUY ONLY / SELL ONLY, and the entry signal.
Scanner helps find those signals when several symbols and timeframes are being monitored.
Guardian handles position sizing and trade management after entry, so rules such as breakeven protection can be executed consistently instead of depending on reaction speed.
The trader still makes the final decision.
After purchasing TrendCue Smart Trend, Scanner and Guardian are also included as free bonus tools, so the three can be used together as one complete workflow.
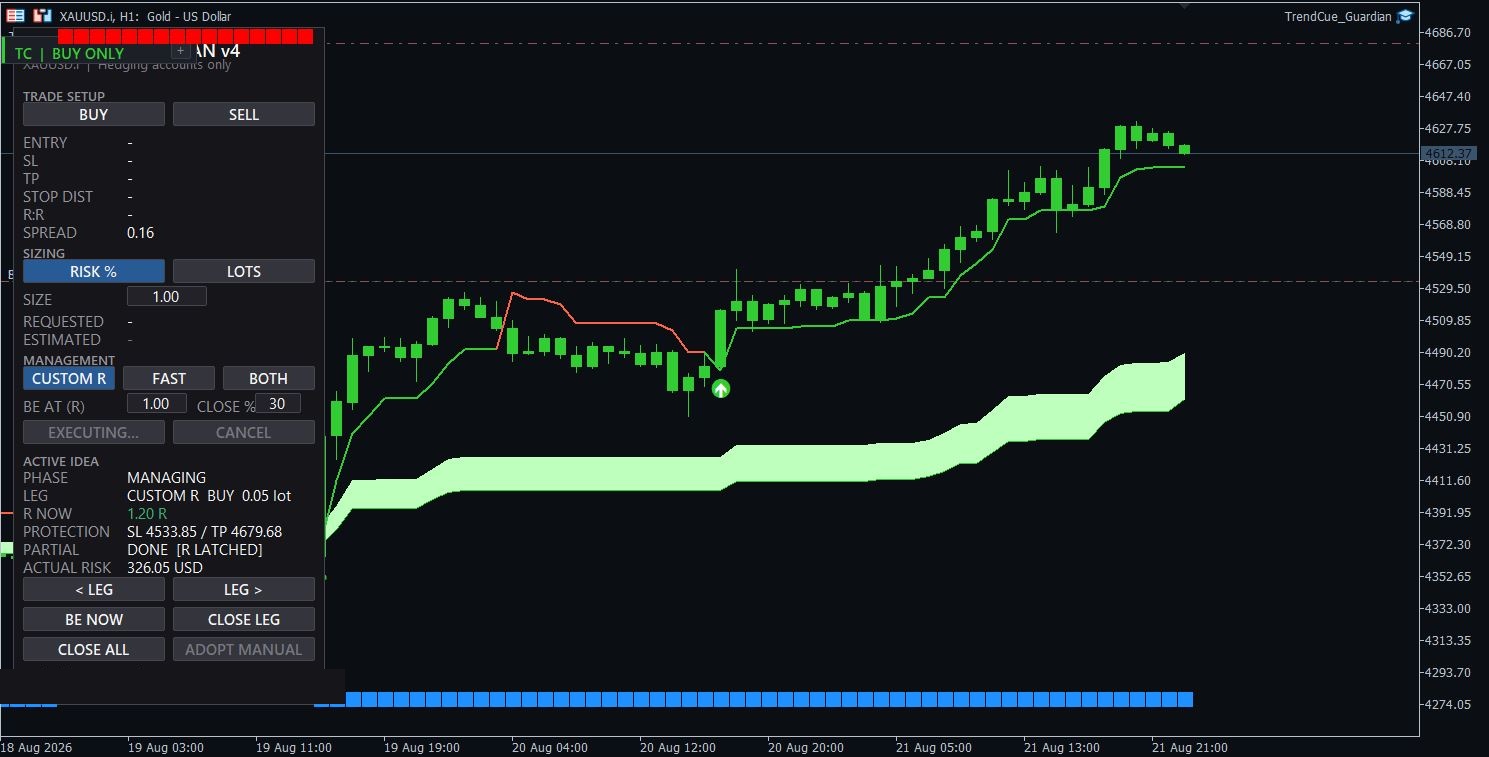
Here is Guardian managing a live H1 Gold position with CUSTOM R: partial profit already taken, stop protected above entry, and the trade at 1.20R at the time of the screenshot.
Test the signals yourself
You do not need to take my screenshots at face value.
Download the free Smart Trend demo, open MT5 Strategy Tester in Visual Mode, and test the signals yourself.
You can test it on any Forex pair or market symbol available in your MT5 terminal, across different dates and timeframes. If you want a simple place to start, begin with Gold (XAUUSD) and then compare the signals on the other markets you trade.
Move through the chart candle by candle and watch how Structure, BUY ONLY / SELL ONLY and the signals developed before you knew what happened next.
If you’re just getting started, I recommend beginning with M15 or higher. The slower pace gives you more time to read the setup clearly and make disciplined decisions.
Do not test only one good-looking period. Try different weeks, different symbols and different market conditions, and see how the workflow behaves on your own charts.
Free Smart Trend demo:
https://www.mql5.com/en/market/product/174993
Trading involves risk. Historical results do not guarantee future performance.