
How it works — Table of Contents
Settings, the panel and troubleshooting are covered in the user guide: Helios Gold Edge — User Guide
1. The nine strategies
All nine strategies use the same engine. They are not nine different systems, but one system in nine different tunings.
What they all have in common
The entry signal comes from fractals, which are points on the chart where price has formed a local high or low. When such a point is found, the EA places a pending order at a certain distance from it and waits to see whether price reaches that level.
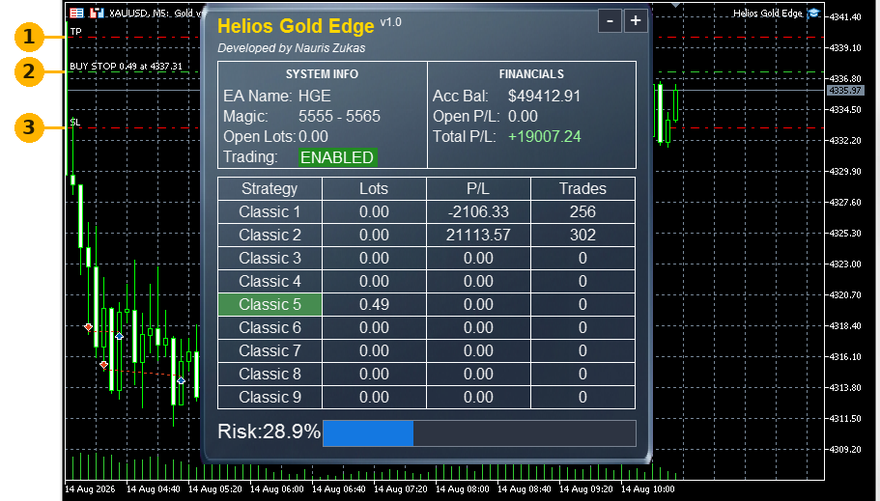
Figure 1: A pending order with its take profit and stop loss
The image shows one such order on the chart:
- Take profit, the price at which the position would be closed in profit.
- The pending order, the price at which the EA will enter the market. Until price reaches it, there is no position.
- Stop loss.
Only one strategy is enabled here. With several enabled, there can be several such sets of levels on the chart at the same time.
Every position has a real stop loss and take profit from the moment it opens. In addition, two mechanisms move them:
Stop loss tightening. When the position is in profit by a certain distance, the stop loss moves forward, away from its original level. What happens next depends on the strategy. For some, the stop loss stops at a fixed level and stays there. For others, it keeps following price for as long as the position is open.
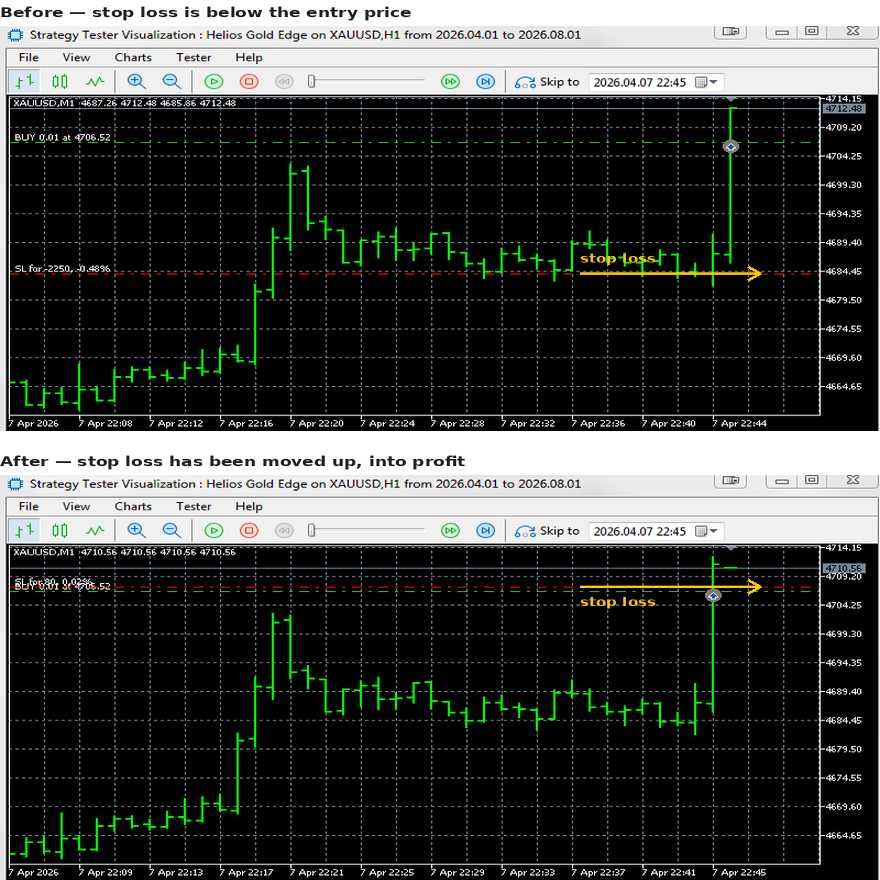
Figure 2: The same position before and after the stop loss was moved
The images show the same position at two different moments. At the start the stop loss is below the entry price, so if it were hit, the trade would be a loss. Once price had moved far enough, the stop loss was moved above the entry price, and from that moment the trade can no longer close at a loss.
Take profit adjustment. If the position is in a significant loss, the take profit is moved closer to the current price. This allows the position to close on a small recovery instead of waiting for the full target or going all the way to the stop loss.
How they differ
Each strategy has its own timeframe, its own fractal size, its own order distance, its own stop loss and take profit, and its own settings for how those are moved while a position is open.
None of these differences is large on its own. Together they mean that the strategies react differently to the same market event.
Why this matters
Several strategies can react to the same fractal, but each places its order at a different distance from it, so they do not enter at the same price, and some do not enter at all. Their exit mechanisms differ as well, so they do not exit at the same time either.
As a result they do not lose at the same time. This is why the combined drawdown is smaller than the sum of the individual drawdowns, and why the risk indicator shows a lower percentage than adding them up would give.
About the initial stop loss
When the EA opens a position, the stop loss is set relatively far away. This is not the distance at which the position is usually closed. It is a last resort for the case where everything else fails.
In practice the stop loss is tightened, and most positions are closed by the tightened stop loss or by the adjusted take profit, not by the original one.
So do not read the initial stop loss as a measure of risk. The measure of risk is the historical drawdown.
When the EA does not trade
There are several cases where the EA deliberately does not work:
Thirty minutes before the end of the trading session. All unfilled orders are removed. This prevents a situation where an order is filled on a gap at the opening of the next session, at a price far from the one planned.
Before NFP news. On the days when the US labour data is released, orders are removed before the publication. This is the moment when gold moves the fastest and slippage is the largest.
When the market is closed. At weekends and on holidays the EA does not perform any actions. The panel stays visible but nothing changes, and that is normal.
The EA does not read the session times only from the broker settings. It also analyses the actual history and determines when the session really starts, because the declared and the actual time often differ.
The risk of each strategy on its own
The numbers show the historical drawdown if the strategy runs alone, with a base of 1000 USD per 0.01 lot.
| Strategy | Risk if it runs alone | Average trades per year |
|---|---|---|
| Classic 1 | 19.5% | 34 |
| Classic 2 | 14.2% | 31 |
| Classic 3 | 12.4% | 43 |
| Classic 4 | 8.0% | 48 |
| Classic 5 | 29.1% | 180 |
| Classic 6 | 31.9% | 174 |
| Classic 7 | 24.8% | 159 |
| Classic 8 | 20.8% | 242 |
| Classic 9 | 93.6% | 1021 |
The number of trades is an average over 16 years. In years when the gold price moves little, there are considerably fewer trades. The difference between years can be several times over.
The table shows a clear relationship: the more trades, the larger the drawdown. Classic 1 to 4 make about one trade per week, and their risk is the lowest. Classic 5 to 8 make several trades per week. Classic 9 makes more than a thousand per year, which is about four on every trading day.
Classic 9 stands out. On its own it is the riskiest of them all, and it makes about five times more trades than the next most active one. Every trade costs the spread and slippage, so this strategy is the one that differs most from the test on a live account. In a test these costs are smaller than they tend to be in practice.
If you are just starting, leave Classic 9 disabled.
2. Slippage and your broker
Two users with identical settings can get noticeably different results. The reason is usually not the EA, but the broker.
Why this affects this EA in particular
The EA does not enter the market immediately. It places a pending order at a certain distance from the fractal and waits to see whether price reaches that level.
When price reaches it, the order is filled at the market price at that moment. If the market is moving fast at that moment, and it usually is, because that is why price arrived there in the first place, the actual fill price differs from the one in the order. That difference is slippage.
Why the number of trades is decisive here
The more trades there are, the more often slippage affects the result.
For a strategy with 30 trades per year this happens rarely. For a strategy with more than a thousand it happens constantly, and that is exactly why Classic 9 differs most from the test on a live account.
This is not a flaw in that strategy. It is simple arithmetic.
Slippage is not only lost points
This is the most important part of this section, and it is usually misunderstood.
The trailing mechanism activates when the position is in profit by a certain distance from the entry price. If the order is filled at a worse price, that reference point moves as well, and so does the level at which the trailing starts to work.
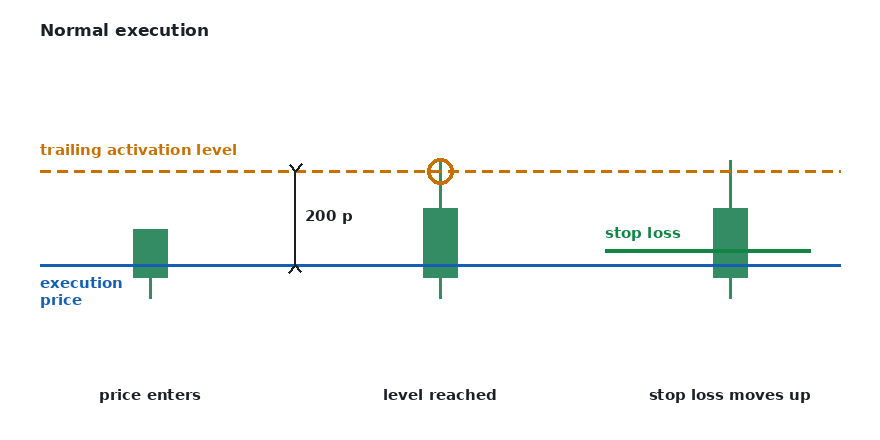
Figure 3: Normal execution, the trailing level is reached
In a test, the position opens at the planned price. Price moves far enough, the trailing activates, and the stop loss moves to a protected level.
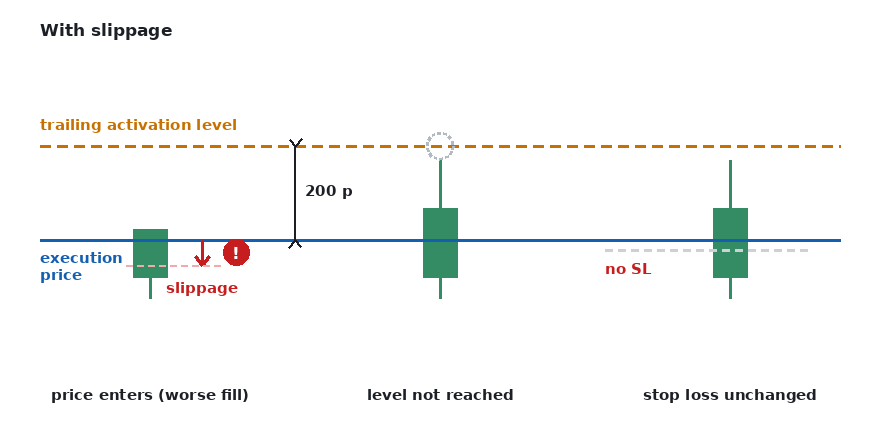
Figure 4: The same price movement with slippage, the trailing level is not reached
On a live account, the same position opens a few points worse. Price moves exactly as far as it did in the test, but that is no longer enough, because the trigger level has moved. The trailing does not activate, and the stop loss stays where it was.
The position is not left unprotected. The take profit adjustment still works, and on a small recovery it can close the position much earlier than the original stop loss would. But the result will be worse than in the test, because one level of protection was missed.
This is why the effect of slippage cannot be estimated simply by multiplying it by the number of trades. It is not only an even cost item. A few points decide whether a specific mechanism activates or not.
Why testing with Delays does not solve anything
The Strategy Tester has an option to add an execution delay. Many people use it believing that it imitates real conditions. For this EA it does not, and the reason is documented.
The delay is applied only to the actions the EA itself sends to the server: placing an order, changing stop levels and so on. The execution of a pending order happens on the server, and in the tester it happens without any delay. This is how the MetaTrader documentation describes it:
https://www.metatrader5.com/en/terminal/help/algotrading/testing
This EA trades only with pending orders. That means the delay is added to the placing of the order, but at the moment price reaches the order and it is filled, there is no delay in the tester at all. The order is filled exactly at its own price, every time.
This is exactly the moment where slippage occurs on a live account.
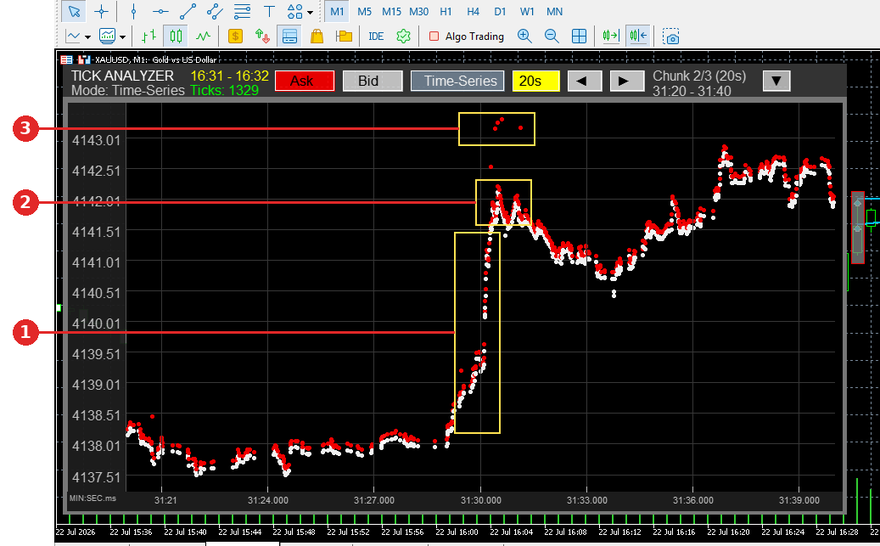
Figure 5: Real ticks at the moment a buy stop order is filled
This is a real tick record from XAUUSD at the moment a buy stop order is filled. Each dot is one tick: the red ones are ask, the white ones are bid.
- Price passes through the order level. Here price is rising so fast that there is practically no chance of getting exactly the price given in the order. The ticks in this zone are sparse and far apart, so there is nothing to be filled against.
- This is where the order is usually filled. A cluster of ticks higher up, where the market pauses for a moment. This is the typical real fill price. Not the one in the order, but the one that was available when the market became liquid again.
- The worst case. Sometimes the fill happens right at the top, before price comes back down. This is not a rare event.
Compare this with what the tester does. There the order is filled exactly at its own price, at a point that in this image is somewhere below the first rectangle. Such a fill was simply not available in the real market at that moment.
If you want to check this yourself, take a specific real trade that was filled with large slippage and try to reproduce the same result in the tester with Delays. It will not work.
How to measure this on your own account
I have made two tools that are useful here.
Slippage Auditor reads your trade history and shows the slippage of every closed trade directly on the chart. It shows what your broker actually does with your orders.
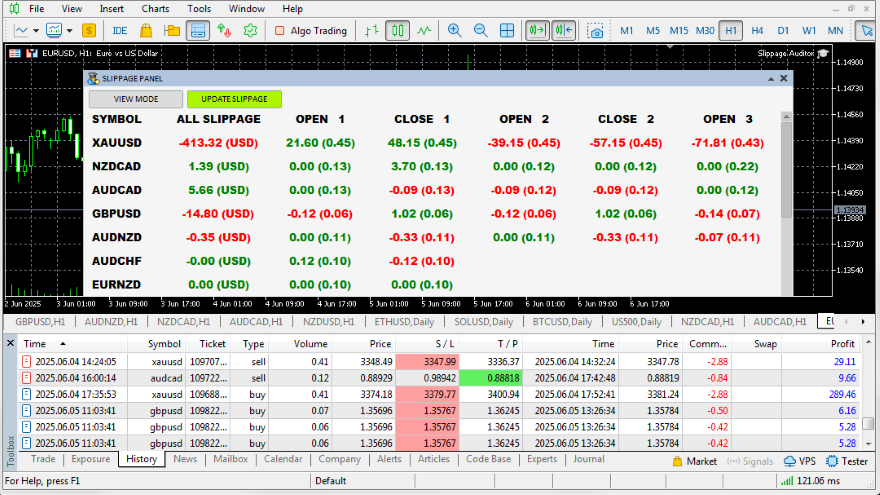
Figure 6: Slippage Auditor shows the real slippage of every closed trade
This tool costs 50 USD, but I send it free of charge to Helios Gold Edge users. Write to me and I will send it.
https://www.mql5.com/en/market/product/138636
TradePanel 105 is a manual trading panel, and it writes the order execution time to the journal every time you press BUY or SELL yourself. It does not measure this EA's orders, because it works with market orders and not with pending ones. But it lets you quickly see on a demo account how long your broker takes to answer an order at all. If the answer comes after ten seconds, that is useful to know before you trust that demo account with anything. It is free.
https://www.mql5.com/en/market/product/182422
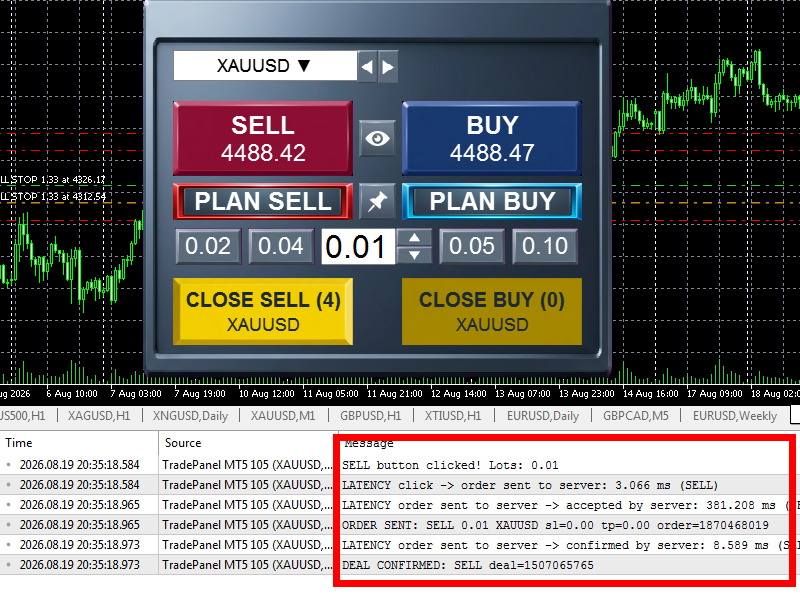
Do this check on a demo account, not on a live one. The purpose is to assess the demo account execution, not to spend money.
About demo accounts
A demo account is meant for checking how a system behaves in real time. But demo account execution is often no longer the same as on a live account.
On one broker demo account that I tested, a gold order was sometimes filled only after a full minute. In twenty years in this industry I have not seen this before. It is something from the last few years, and it affects gold in particular.
With execution like that, no real time check on a demo account tells you anything. Not about this EA and not about any other.
So before you make a decision based on demo results, measure the execution time with TradePanel 105. If it is measured in fractions of a second, the demo results can be trusted. If it is tens of seconds, they mean nothing.
Brokers also use other methods that affect automated systems. I will write about those separately on the blog.
What to look for in a broker
Three things matter for this EA: a tight spread on gold, fast execution measured in milliseconds rather than seconds, and low slippage. The last one can only be measured after you have started trading, and that is exactly why Slippage Auditor exists.
If you plan to use strategies with a high number of trades, these three things become more important than the choice of strategies.
3. Backtesting this EA
Where to start
Before you test, make sure you have read the previous section. A backtest does not contain slippage the way it happens in reality, and that is the most important thing to keep in mind when looking at the results.
Modelling mode
There are two modes that make sense.
1 minute OHLC is fast. Use it when you are looking for a configuration and want to check many variants.
Every tick based on real ticks is accurate. Use it when you have chosen a configuration and want to see what it really does.
Here is the same four month test in both modes.
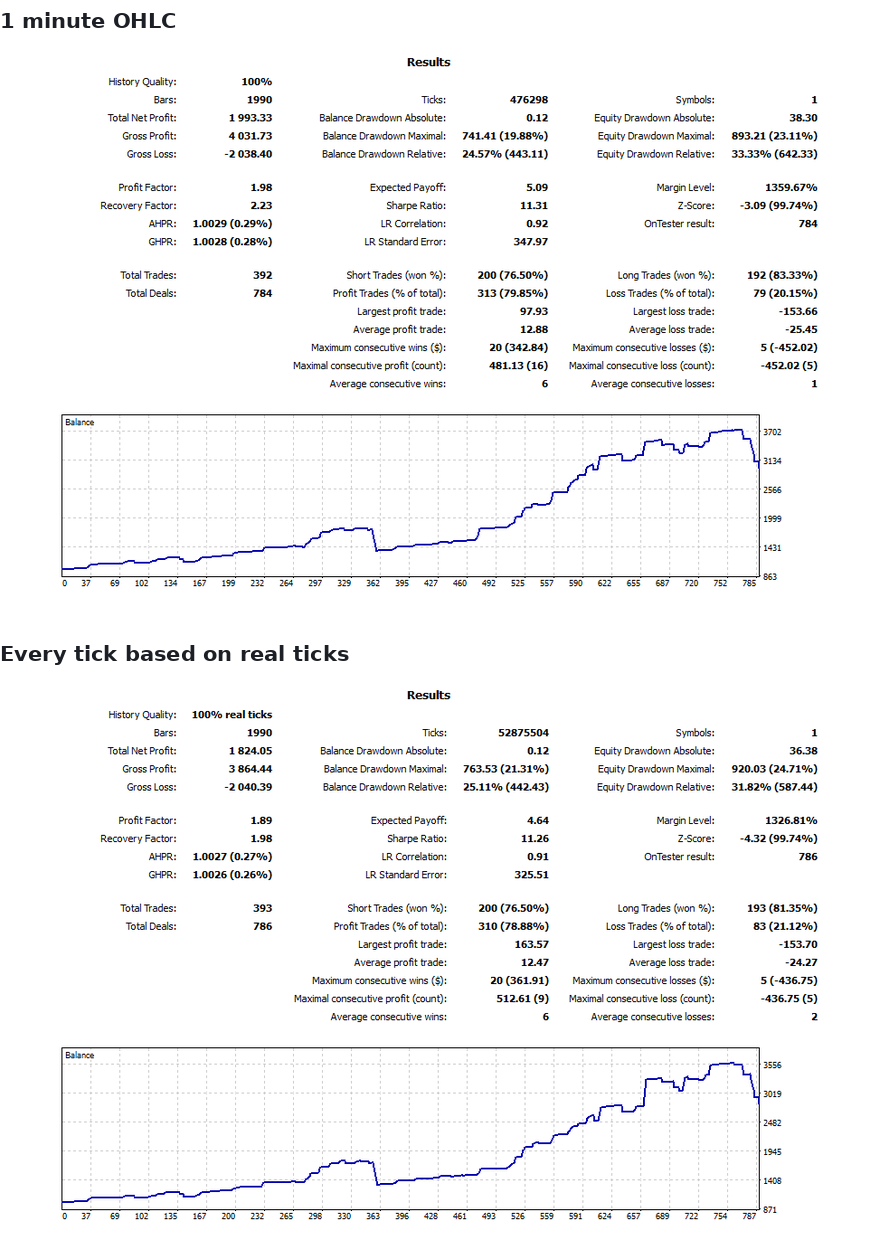
Figure 8: The same test in both modelling modes
Compare the numbers:
| Metric | 1 minute OHLC | Real ticks |
|---|---|---|
| Net profit | 1993.33 | 1824.05 |
| Number of trades | 392 | 393 |
| Profitable trades | 79.85% | 78.88% |
| Profit Factor | 1.98 | 1.89 |
| Balance drawdown | 19.88% | 21.31% |
Note what did not change. The number of trades is almost identical, the win rate differs by one point, and both curves have the same shape, with the same rises and falls in the same places.
The only thing that changed is how much each trade earned. The average profit per trade falls from 12.88 to 12.47.
This is an important idea: the mode does not change what the EA does. It changes how accurately each fill is modelled. More accurate modelling gives a worse result, because reality is worse than the simplification.
And here it is worth remembering the previous section. If moving from one modelling mode to the other already takes away 9%, then real slippage, which neither mode models, takes away more.
Over long periods this difference grows. If the lot size grows together with the account, then a small difference at the start of the test changes the lot size for the following trades, and those in turn change the account even more. Over a two year test the two modes can lead to noticeably different results, even though the difference at the start was a fraction of a percent.
The practical recommendation: search with 1 minute OHLC, verify with real ticks.
The Delays setting changes nothing for this EA. The reason is described in the previous section. Leave it at its default.
About testing speed
This EA is built to test fast. That is a deliberate architectural choice, not a side effect.
The same four month period on the same computer takes 1.4 seconds with 1 minute OHLC and 40 seconds with real ticks.
Speed is not the goal in itself. If an optimisation has to check a thousand combinations, this is the difference between an hour and several days, and that determines how much you can check at all before making a decision.
This speed is achieved through the structure of the code, not by skipping ticks. Every tick is processed in full. That matters, because a test that is made faster by skipping data no longer shows what a full test would show.
And one assumption worth discarding: a slower test does not mean a more complex or better EA. It means less efficient code.
What period to test
Most users do not have 16 years of tick history. Two years is enough for an objective picture.
But a short period has one important detail. These strategies can be in a losing period for several months in a row. That is normal. It is not a fault and not a sign that something is broken.
If your test covers two years and one such period falls inside them, the result will look much worse than it is. If the test happens to start right after such a period, the result will look better.
So if possible, test several periods, not just one. And do not draw conclusions about a system meant for years from a few months.
Starting deposit and leverage
Set them to what you will actually use. A result with 10000 USD does not scale to a 1000 USD account, because the lot size grows with the account and rounding has more effect on a small one.
Leverage has to be checked separately. With leverage of 1:30 and 1000 USD in the account, the maximum total volume is about 0.07 lots of gold at a price of around 4400. If your configuration tries to open more than that, some trades simply will not open, and the test will only show this if the leverage in the test matches your live account. This mainly affects small accounts and users in Europe.
Why your results will not match mine
Two people can run the same test with the same settings and get different curves. The test runs on your broker's data, and the tick history, the spread, the swap and the symbol specification all differ between brokers. The longer the test, the larger the difference becomes.
So test on your own broker's data. Somebody else's test, including mine, only shows the character of the system, not what it would do in your conditions.
About history quality
At the top of the test results there is a "History Quality" value, and it can mislead. With 1 minute OHLC it shows 100%; with real ticks it shows "100% real ticks". These are not the same thing, because in the first case the ticks are generated from minute bars.
If a real tick test shows less than 100%, part of the data has been filled in from other sources. If possible, download the full history from your broker before serious tests.
How to check the strategies
A practical order of work:
Test them one at a time. This shows you the character of each strategy: how often it trades, how long it can stay in loss, what its curve looks like.
Then combine them. Watch how the total drawdown changes when you add a second and a third.
Then adjust the lot sizes. Once you know which strategies you want, changing the ratio between their lot sizes changes which of them dominates the overall result.
Then check the balance step. Run the same configuration with different "Balance step for lot multiplier" values and compare the results. This shows what the panel does not: how the lot size actually grows during the test, how the drawdown changes, and what it looks like at the moments when the lot size moves to the next step. On a small account it also shows whether this control works for you at all.
At every step the panel Risk indicator shows where you are.
What a test will never tell you
Slippage. It is described in the previous section, and it is the single largest reason why live results differ from a test.
A test result is not a forecast. It is a way to compare configurations with each other and to understand what the system does. Nothing more.
4. How this EA came to be
Why I started it
There are many gold EAs on the Market. I wanted to build my own and find out whether I could get better results.
I started two years ago. When the system was ready, I chose a few strategies and ran them on a public signal, to see what they do on a live account rather than in a test.
A month ago I came back to it in order to prepare it for sale. That meant rebuilding the panel, removing from the settings everything a user does not need, meeting the Market validation requirements, putting the system through stress tests, and writing this guide.
About the public signal
The signal shows an account that this EA runs on, but not only this EA.
The reason is the MQL5 signal rules. The configuration I originally ran trades rarely, and several weeks without a trade is normal for it. But a signal that goes a long time without trades is automatically deactivated. I had to reactivate it again and again, until it became clear that this could not continue.
So I added a second system to the account, one that trades more often. It is not part of Helios Gold Edge. You can tell it apart by the lot size, because it consistently trades with 0.01.
That second system is currently in a losing period, and it is pulling the overall curve down. Part of what you see in the signal does not come from this EA.
But you do not have to take my word for it. The same account is also public on Myfxbook, and there the trades can be filtered by Magic number. On this account Helios Gold Edge runs three strategies, using the numbers 5556, 5557 and 5558. If you select those, you will see only what this EA does, separately from everything else. The filter is in the Myfxbook Custom Analysis section.
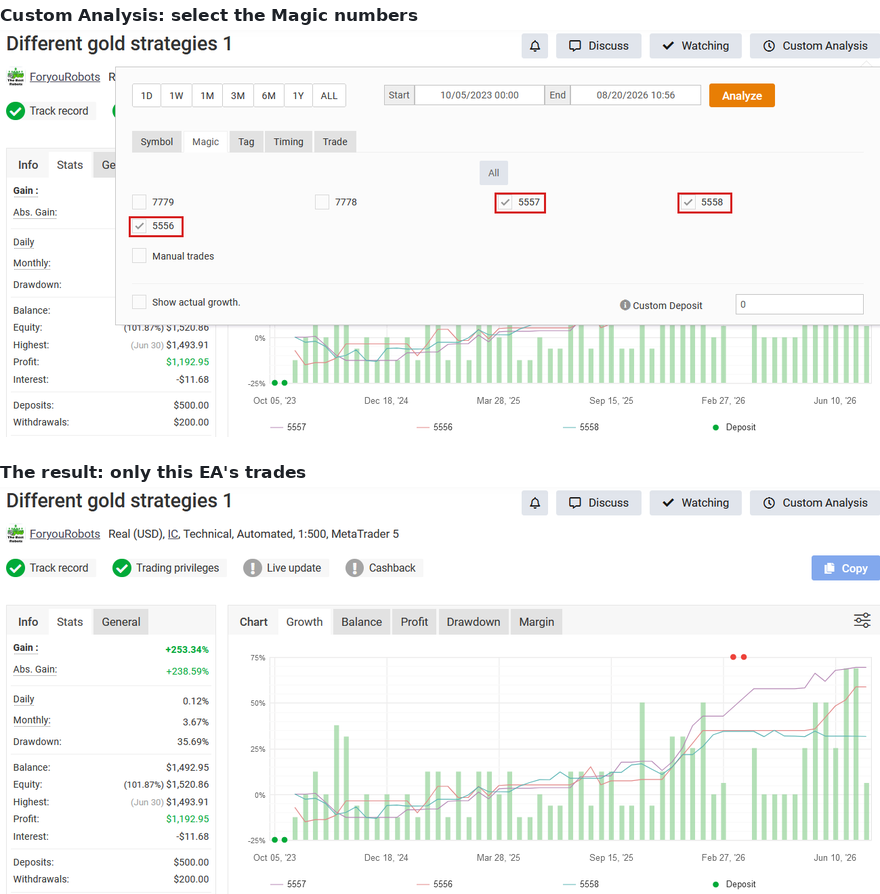
Figure 9: How to see only this EA's trades on Myfxbook
The account on Myfxbook is called "Different gold strategies 1". It was created before it was known that a product would come out of this, and I have not changed the name.
MQL5 signal: https://www.mql5.com/en/signals/2375487
The same account on Myfxbook (copy the address into your browser):
myfxbook.com/members/ForyouRobots/different-gold-strategies-1/11717221
The part that took the most thinking
It was not the trading logic. It was the risk indicator.
There was nothing for me to copy from. I have not seen any other EA that shows the user what a specific configuration means in terms of risk before they start trading. So everything, starting from the question of what this number should show at all, had to be worked out from nothing.
The question looked simple: the user chooses a combination of strategies, so how large is the risk? The historical drawdown is measurable, so the answer seems to exist already and only needs to be displayed.
The first solution was to measure every possible combination and store the results inside the EA. That worked, as long as everybody traded with the same lot size.
As soon as each strategy can have its own lot size, it fell apart. And here is what makes this problem difficult: the drawdown of a combination is not the sum of the individual drawdowns. The strategies do not fall at the same time, so together they tend to produce a smaller drawdown than some of them do on their own. The correlation works in your favour, and that same correlation is what makes splitting the drawdown mathematically impossible.
And that is only half of it. Nine strategies give 512 combinations, and those can be tested. But each one can also be given any lot size, and with that the number of variants is no longer countable. Measuring everything in advance is impossible in principle.
Another thing that was not obvious
When the numbers finally started to look right, it turned out that they were not.
Drawdown in percent is not calculated against the starting capital. It is calculated against the highest capital reached, and that includes all the profit accumulated up to that point.
The consequence: the percentage does not grow linearly with the lot size. A lot size twice as large produces a drawdown twice as large in money, but also twice as much profit already accumulated. The denominator grows together with the numerator.
That meant the indicator could not be built from percentages alone. It had to measure in money and to know separately how much had been accumulated at the moment of the largest drawdown.
How it works now
The measured drawdown of the combination is divided among the strategies in proportion to their individual contribution, and each part is converted to the lot size that strategy actually uses.
This means the indicator is based on real measured data even when your configuration has never been tested in exactly that form.
It is not a perfect solution and it does not pretend to be one. With equal lot sizes it is accurate; with different ones it is indicative. I chose it knowing what I was giving up, and it is much closer to reality than simple multiplication, which only seems accurate because it has never been checked.
Two times when I chose less profit
The system removes pending orders before the end of the session and before NFP news. In both cases the reason is the same: these are moments when price can jump over the order level and the fill happens far from what was planned.
In tests both of these filters reduce the profit. They do not reduce the drawdown.
By the numbers they should be switched off. I left them on.
The reason is that a test does not measure what these filters protect against. A backtest plays gaps out neatly, with the order filled at its own price as if the market had been there. On a live account that does not happen. It is the same thing described in section 2 about slippage: the test shows a fill that was not available in reality.
So I judge them not by what they give in a test, but by what they protect against when something goes wrong.
And one last thing worth knowing
The tables the indicator is based on were measured on my broker's data.
If you run a test on your own broker's history, your drawdowns will most likely differ. The reasons are the same as in section 3: different tick history, different spread, different swap. This is not a defect in the indicator. It is the same reason why your trading results will never be identical to mine either.
What matters is what the indicator actually does. It does not promise that your drawdown will be exactly 28%. It shows that one configuration is riskier than another, and by how much. That relationship holds regardless of whose broker data it was based on. If two strategies together produce a smaller drawdown than they do separately, that is also true on your account.
So use it for what it is meant for: to choose between configurations, and to know which way you are moving when you enable another strategy or change a lot size. An exact number for your own account can only come from a test on your own data, and that is worth doing.



