

The Buy Sell MT5 indicator is a professional trend-following tool designed to detect high-precision market reversals using Trailing Stop-Loss logic. It works best on volatile markets such as Gold (XAUUSD), Nasdaq (NAS100), and DAX (GER40).
https://www.mql5.com/en/market/product/173836
works on all symbols and timeframes.
For best results, it performs exceptionally well on volatile markets such as GBPUSD, USDJPY, SPX500, NAS100, DAX30, BTCUSD and XAUUSD (Gold), especially on M30, M5, and M15 timeframes.
Key Features
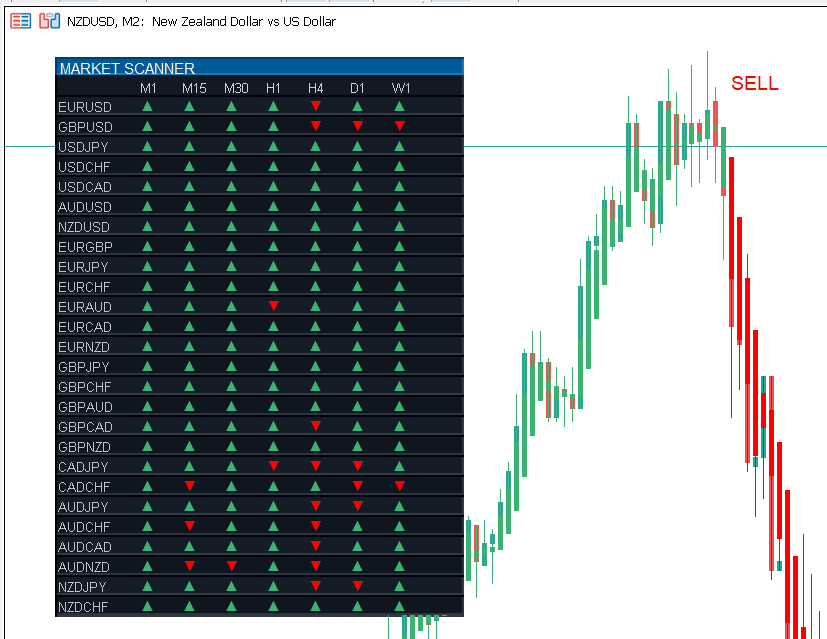
Main Chart: Multi-Timeframe Dashboard.
Main Chart: Multi-Asset Dashboard.
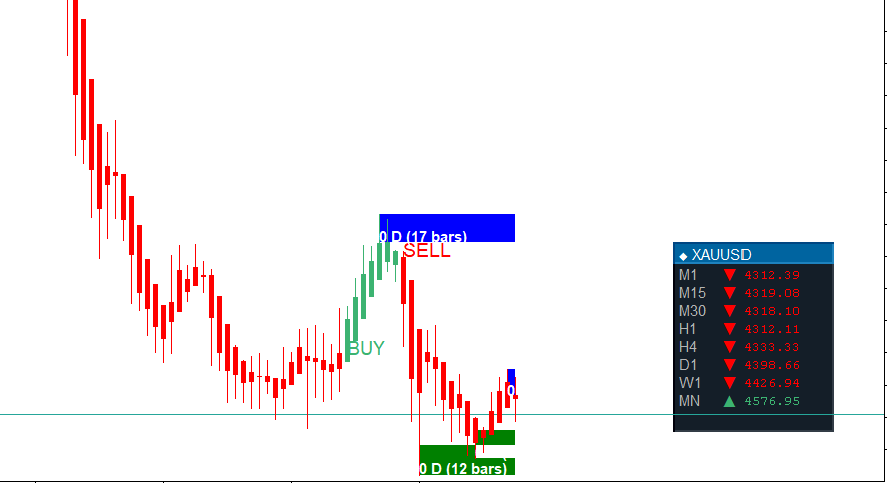
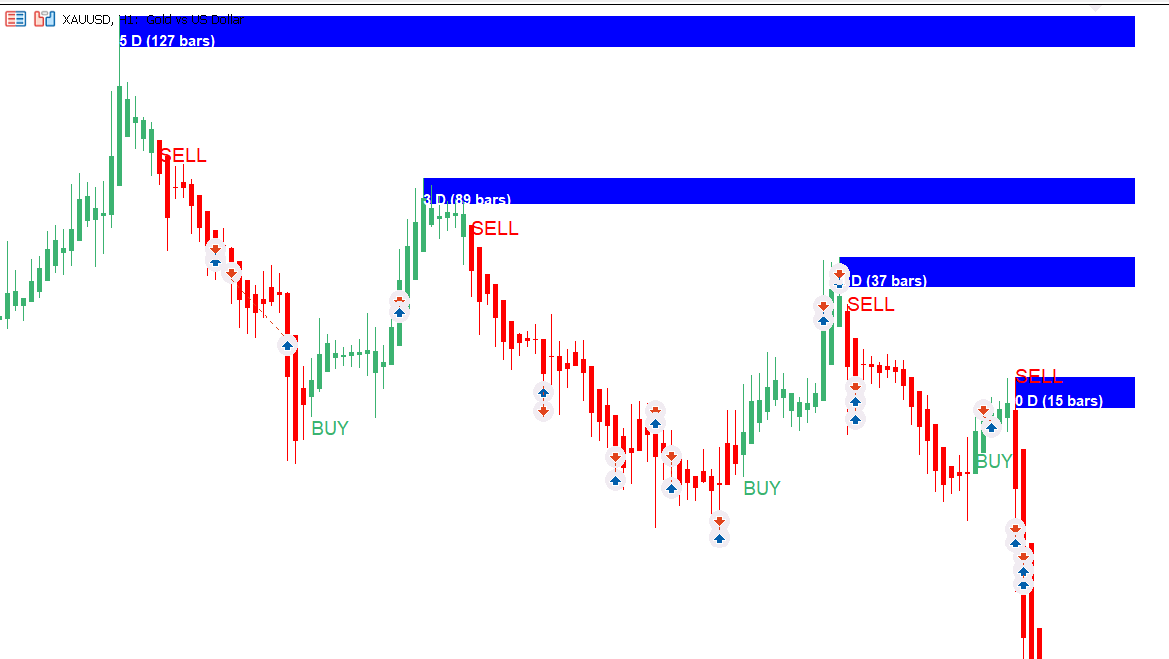
Main Chart: Supply and Demand Display.
Zero Repaint
Signals confirm only after candle close, no disappearing arrows.
Dual Mode Display
- Normal candles with trend coloring
- Heikin Ashi mode for smoother price action
Multi Alerts
Popup, sound, mobile push, and email alerts included
Trading Guide
Timeframes
- Scalping: M1 to M5
- Day trading: M15 to M30
Best results on M5 for Gold and Nasdaq
Sessions
- London session: Forex and DAX
- New York session: Gold and Nasdaq (first 3 hours best)
Strategy Tip
Only trade signals that align with a higher timeframe trend filter
https://www.mql5.com/en/market/product/173836
https://www.mql5.com/en/market/product/161627
https://www.mql5.com/en/market/product/163872
The content shown in the Supply and Demand label (e.g., “0 D (15 bars)”) represents the “lifetime” of a support or resistance zone — in other words, how long the zone has existed:
0 D (Days):
Indicates the number of calendar days since the zone was formed.
“0 D” means the zone was created today (or within the last 24 hours).
As time passes, it will update to 1 D, 2 D, or for longer durations, 1 M (month) or 1 Y (year).
(15 bars) (Number of candles):
Represents how many bars (candlesticks) the zone has persisted.
This provides a more precise time measurement, showing how long the zone spans on the chart.
In simple terms:
This label measures the “age” of the zone. Generally, the longer a zone has existed (i.e., more bars), the stronger it is considered in terms of psychological support or resistance.
Why Use It
It turns market noise into clear BUY and SELL signals, helping traders avoid emotional decisions and follow trend direction more consistently.


")
")
