
1,240 Trades. Here Is What the Numbers Actually Tell You About Risk.

Gold dropped 3% on Friday.
Spot XAUUSD fell as low as $4,540 in a single session — one of the sharpest single-day moves of the year.
Moments like this are useful. Not because they are predictable. But because they reveal what a backtest actually means.
A system running through Friday's session either had a plan for that kind of volatility — or it did not.
What Most Traders Look at First
Most traders open a backtest and go straight to the profit curve. Then the final balance. Then the win rate.
These are the numbers that appear in marketing screenshots.
They are also the numbers most easily manipulated.
What the Numbers in Our Backtest Actually Mean
The backtest for our upcoming XAUUSD system covers January 2024 through June 2026: 2.5 years. 1,240 trades.
That is approximately 40 trades per month — around 2 per trading day.
Not high-frequency. Not one-trade-per-week. A pace that generates enough data to evaluate the edge statistically rather than by luck.
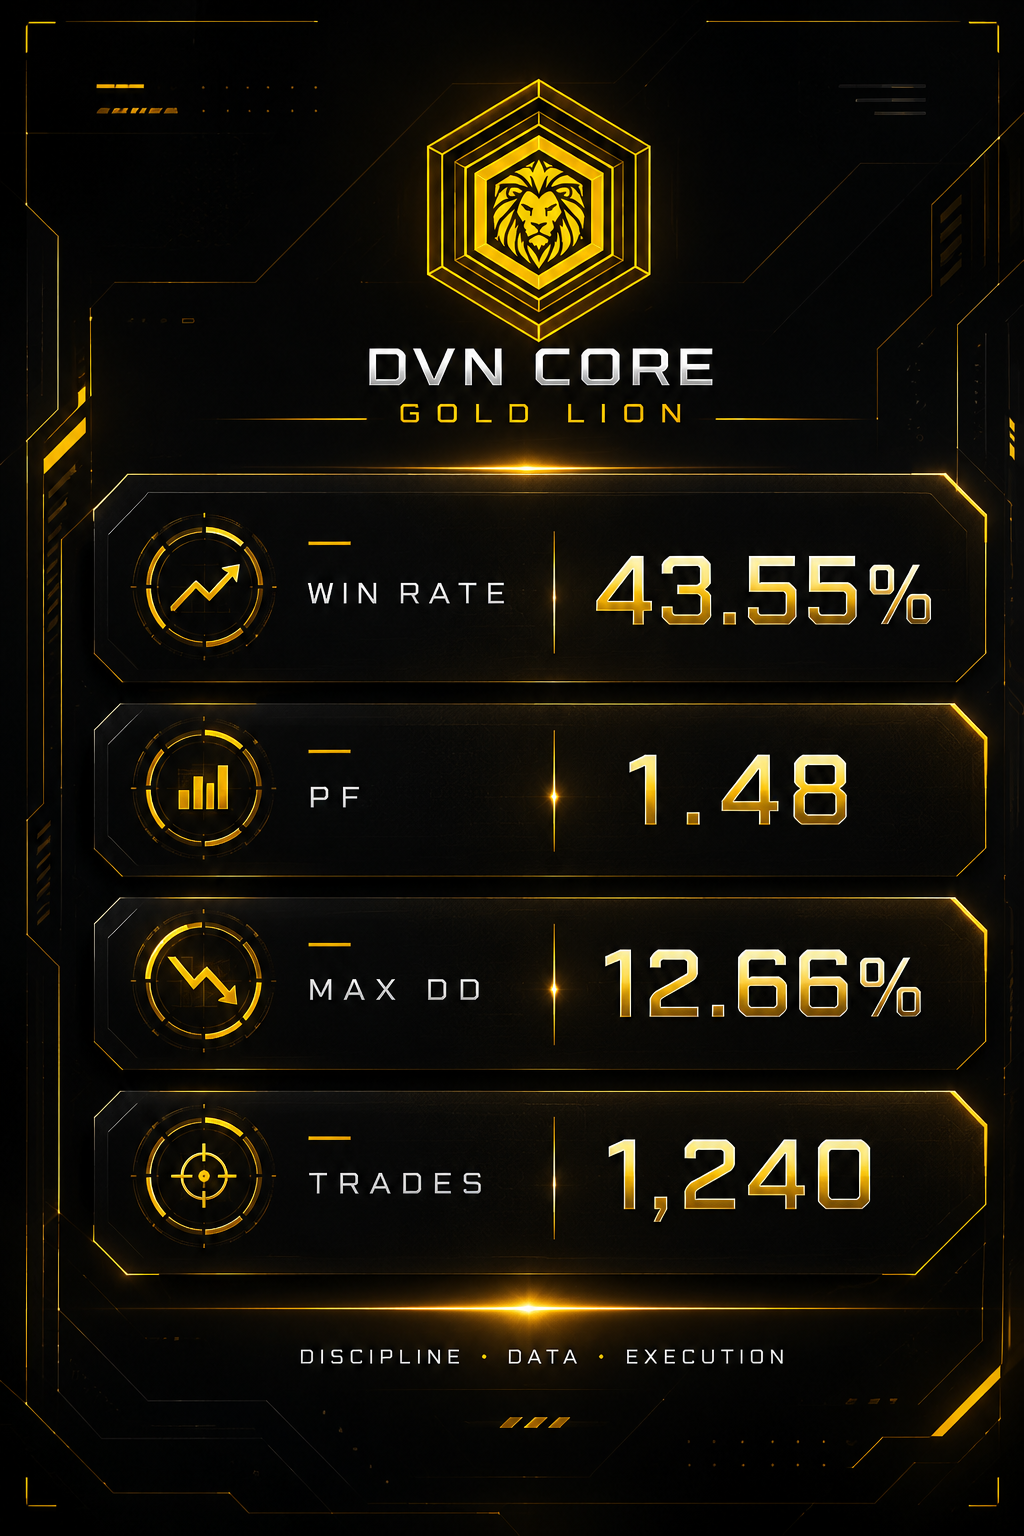
Here is what each number tells you:
Win rate: 43.55%
Below 50%. This is intentional.
A win rate above 70% in a backtest is almost always a sign of overfitting — the system was shaped around historical data until it found patterns that will not hold in the future.
43.55% means the system is profitable not because it wins often, but because its average win is meaningfully larger than its average loss. The edge is structural. Not cosmetic.
Profit Factor: 1.48
This is a modest edge. Not a spectacular one.
A profit factor of 3 or 4 should raise questions. A profit factor of 1.48 means every $1.00 of loss generates $1.48 in returns. This is the kind of number that can survive realistic market conditions — including sessions like last Friday.
Max Drawdown: 12.66%
Over 2.5 years of live market data — including the volatility of 2024 through mid-2026 — the system did not exceed 12.66% peak-to-trough drawdown.
Past results do not guarantee future drawdown. But a system that has been tested through real conditions is different from one built on a clean demo.
The 1,240 trades figure
With fewer than 100 trades, a backtest can produce impressive numbers by chance.
With 1,240 trades over multiple market regimes, the pattern either exists in the data — or it does not.
The Risk Architecture Behind the Numbers
Every trade in this backtest was placed with a fixed stop loss attached to the strategy that generated it. No martingale recovery. No grid of positions building in one direction. No averaging into losses.
When a trade closes at a loss, the system moves on. There is no attempt to recover the loss by increasing exposure.
The 12.66% max drawdown is what a 2.5-year backtest looks like when risk is defined per trade and not managed retroactively.
That is the number worth studying.
Why We Are Sharing This Before Launch
We launch on June 10. The product is not live yet.
We are sharing this now because the numbers should be understood before a purchase decision is made — not discovered afterward.
Full system documentation and signal tracking will be available at launch.
Follow the channel for updates: → https://www.mql5.com/en/channels/dvn_core


")
")
