
Sniper Ashfield Pro — Precision EMA-Crossover Entries With a 6-Factor Confluence Gate

Introduction
The EMA crossover is the first trading signal almost every trader learns. A fast moving average crosses a slow moving average, and you take the trade. It is intuitive, it is visual, and on a trending chart it looks like it prints money. Then you run it live and discover the brutal truth: a bare 9/21 EMA crossover whipsaws relentlessly in ranges, fires counter-trend in pullbacks, and gives you no idea where to put a stop or a target. The signal that looked so clean in hindsight produces a death-by-a-thousand-cuts equity curve in real time.
The problem was never the crossover itself. The crossover is a perfectly good trigger. The problem is that a trigger fired in isolation has no context. Is momentum actually behind this move? Is price on the right side of the day's value area? Is there a real volume commitment behind the candle that crossed, or is it a thin doji on a holiday session? A raw crossover answers none of these questions.
Sniper Ashfield Pro takes the EMA9/EMA21 crossover and puts it behind a six-factor confluence gate. Every crossover is scored against six independent market-state filters before a single BUY or SELL is drawn on the chart. Only crossovers that clear a configurable minimum score become signals. On top of that gate sits a session-anchored VWAP, an ATR-based stop loss, three risk-reward take-profit targets, a nineteen-row dashboard, and a thirteen-event alert package. Everything is non-repainting and built for production use on the MQL5.com Market. This article walks through every component in detail.
Download the indicator:
- MetaTrader 5: Sniper Ashfield Pro MT5
- MetaTrader 4: Sniper Ashfield Pro MT4
TIP: Sniper Ashfield Pro works on every symbol and every timeframe. Higher timeframes (H1+) produce fewer, stronger sniper entries. Lower timeframes generate more setups; raise the MinConfluence input to control signal frequency.
The Sniper Concept — A Trigger Is Not a Signal
The core architecture of Sniper Ashfield Pro draws a hard line between two ideas that most crossover systems conflate: the trigger and the signal.
The trigger is the EMA9/EMA21 crossover itself. On every confirmed bar close, the indicator computes the fast EMA (default 9) and the slow EMA (default 21). A bullish trigger occurs when the fast EMA was at or below the slow EMA on the previous bar and is now strictly above it. A bearish trigger is the symmetric mirror — fast was at or above slow, and is now below. That is the entire trigger definition. It is deliberately simple, because the trigger is not where the edge lives.
The signal is what happens after the trigger fires. Before a single arrow is drawn, the trigger is scored against six independent confluence factors. Each factor that agrees with the trade direction contributes one point. The total score ranges from 0 to 6. Only triggers that meet or exceed the MinConfluence threshold (default 3) are committed to the chart as a BUY or SELL with a star rating attached. A crossover that fires in dead air — no momentum, wrong side of VWAP, no volume — scores low and is silently discarded. A crossover that fires with five or six factors aligned is a sniper entry: a high-conviction shot taken only when the whole market structure agrees.
This is the same philosophy a precision marksman uses. You do not fire at every movement in the scope. You wait for the shot where wind, range, target, and stability all line up, then you take one clean shot. The confluence gate is the discipline mechanism that turns a noisy crossover into a sniper rifle.
A signal cooldown (default 5 bars) prevents the system from firing a cluster of same-direction signals during a choppy crossover sequence. Once a BUY fires, no new BUY can fire for the cooldown window even if the EMAs cross back and forth — the system has already taken its shot.
Session-Anchored VWAP — The Value Filter
The first confluence factor beyond the crossover itself is price position relative to the session-anchored VWAP (Volume-Weighted Average Price). VWAP is the single most-watched intraday reference among institutional desks because it represents the volume-weighted average fill price for the session — the line that separates buyers who are in profit from sellers who are.
Sniper Ashfield Pro computes a true session-anchored VWAP that resets at the start of every trading day. The calculation walks the bars chronologically. For each bar it computes the typical price (High + Low + Close) / 3 , multiplies it by that bar's volume, and accumulates a running sum of price × volume and a running sum of volume . The VWAP at any bar is the ratio of those two sums. When the calendar day changes (detected via the bar's broker time-of-day), both running sums reset to zero and a fresh session VWAP begins.
This produces a clean, anchored value line that means something concrete: the consensus price of the current trading session, weighted by where the volume actually traded. As a confluence factor, the rule is simple. For a bullish trigger, the factor scores +1 only if the close is above the session VWAP — buyers are in control of the session's value. For a bearish trigger, it scores +1 only if the close is below VWAP. A crossover that fires on the wrong side of session value is a crossover fighting the day's volume consensus, and it loses a confluence point for it.
The VWAP is also drawn directly on the chart as a colored line — mint-tinted on bars where price closed above it, red-tinted where price closed below. This two-color rendering gives an immediate read of session control at any zoom level without consulting the dashboard. The line can be toggled off ( ShowVwapLine ) for a cleaner chart while still being used internally as the confluence factor.
The Six-Factor Confluence Engine
The confluence engine is the heart of the system. When a crossover trigger fires, the engine scores it against six factors. Here is exactly what each factor measures and the default rule it applies:
Factor 1 — EMA Cross. The trigger condition itself. A bullish trigger scores +1 when the fast EMA is above the slow EMA at the signal bar; a bearish trigger scores +1 when fast is below slow. This is always evaluated and cannot be disabled — it is the reason a signal exists at all.
Factor 2 — Price vs Session VWAP. Bullish triggers score +1 when the close is above the session VWAP; bearish triggers score +1 when the close is below it. Toggleable via UseVwap . When disabled, the factor awards a free point so the maximum stays at 6.
Factor 3 — RSI Momentum. Bullish triggers score +1 when RSI (default 14-period) is above 50, confirming bullish momentum bias; bearish triggers score +1 when RSI is below 50. Toggleable via UseRsi . The 50 line is the momentum midpoint — above means up-pressure dominates, below means down-pressure dominates.
Factor 4 — MACD Trend. Bullish triggers score +1 when the MACD main line (12/26/9) is above its signal line; bearish triggers score +1 when MACD is below signal. Toggleable via UseMacd . This adds a second, slower momentum dimension that filters crossovers occurring against the broader trend impulse.
Factor 5 — ADX Strength + EMA Alignment. This factor requires two conditions simultaneously: ADX (14-period) must exceed the AdxThresh value (default 20), confirming a trending — not ranging — market, AND the close must be on the correct side of the fast EMA (above for buys, below for sells). Only when both are true does the factor score +1. Toggleable via UseAdx . This is the single most powerful range filter in the system — ADX below threshold means the market is chopping, exactly the condition where bare crossovers die.
Factor 6 — Volume Burst + Candle Direction. This factor also requires two conditions: the signal bar's volume must exceed the 20-bar volume SMA (a burst of participation), AND the candle must be directionally aligned (close above open for buys, close below open for sells). Toggleable via UseVol . A crossover with no volume behind it is a crossover nobody is trading.
The total score is the sum of all six factors, 0 to 6. The MinConfluence input (default 3) sets the bar a trigger must clear. A value of 3 means "at least half the market agrees" — a balanced swing setting. A value of 5 means "almost everything aligns" — a strict scalping setting where false positives are expensive. A value of 6 is the purest sniper setting: every single factor must agree, which on H1 majors typically happens a handful of times per month.
Each on-chart signal label is suffixed with ASCII stars matching the score: BUY ***** for a 5-of-6 setup, SELL *** for a 3-of-6 setup. The dashboard shows the live buy score and live sell score on every tick, so you can watch confluence build in real time before a crossover even fires.
Momentum: How RSI, MACD and ADX Work Together
Factors 3, 4 and 5 form a momentum subsystem, and it is worth understanding why three momentum-flavored filters are not redundant. They measure three different things.
RSI measures momentum bias. The 50 line is the dividing point between net buying and net selling pressure over the lookback window. RSI above 50 says recent closes have been net higher than they were; below 50 says net lower. It is the fastest of the three filters and answers the question "which way is short-term pressure leaning right now?"
MACD measures trend impulse. The MACD line is the difference between a 12-period and a 26-period EMA; the signal line is its 9-period EMA. MACD above signal means the spread between the fast and slow EMAs is widening upward — the trend is accelerating, not just present. MACD answers "is the move gaining or losing steam?"
ADX measures whether a trend exists at all. ADX does not have a direction; it only measures the strength of directional movement, regardless of which way. An ADX of 12 means the market is ranging and any crossover is noise. An ADX of 35 means a powerful directional move is underway. By gating on AdxThresh (default 20) and additionally requiring price to be on the correct side of the fast EMA, factor 5 simultaneously confirms "there is a trend" and "we are on the right side of it."
Used together, these three filters answer a complete momentum question: pressure is leaning the right way (RSI), the trend is accelerating in that direction (MACD), and a real trend actually exists rather than a range (ADX). A crossover that satisfies all three is occurring inside a genuine, accelerating, directional move — which is precisely the only environment where an EMA crossover has a positive expectancy. Each filter is individually toggleable so traders who prefer a leaner gate can drop any of them; a disabled filter awards a free point so the score ceiling remains 6 and MinConfluence keeps its meaning.
ATR-Based Stop Loss
A signal is incomplete without a stop. The instant a confluence-cleared signal fires, Sniper Ashfield Pro computes a volatility-adaptive stop loss using the Average True Range.
The indicator reads the ATR (default 14-period) at the signal bar. If for any reason ATR returns zero — which can happen on the very first bars of a fresh chart — it falls back to the signal bar's own high-minus-low range so a stop is always produced. The raw risk distance is then ATR × AtrMult , with AtrMult defaulting to 1.5. A minimum-risk floor of ten points is enforced so that on extremely low-volatility bars the stop never collapses onto the entry price (which would produce absurd risk-reward math downstream).
For a BUY, the stop is placed at entry − risk . For a SELL, at entry + risk . The result is a stop that breathes with the market: wide on volatile bars where price needs room, tight on quiet bars where a small adverse move genuinely invalidates the setup. This is the central virtue of ATR-based stops over fixed-pip stops — a 20-pip stop that is perfect on EUR/USD M15 is suicidal on XAU/USD M15 and pointlessly wide on EUR/USD M1. ATR normalizes the stop to the instrument and timeframe automatically.
Because the stop distance is computed once at the signal bar from confirmed closed-bar ATR, it never moves and never repaints. The number you see at signal time is the number that was there in real time. That fixed risk distance becomes the unit ("1R") for the entire take-profit ladder described next.
The R-Multiple Take-Profit Ladder
Once the stop sets the risk unit, three take-profit targets are computed as risk-reward multiples of that unit:
TP1 = entry ± risk × RrTP1 (default 1.R) TP2 = entry ± risk × RrTP2 (default 2.R) TP3 = entry ± risk × RrTP3 (default 3.R)
For BUYs the targets sit above entry; for SELLs they mirror below. Each multiple is an independent input. The default 1R / 2R / 3R ladder is a classic scale-out structure: TP1 at 1R lets you bank a partial and move the stop to breakeven, neutralizing risk on the remainder; TP2 at 2R is the workhorse target where the bulk of the trade's profit is realized; TP3 at 3R is the runner that captures the occasional extended move and pays for the inevitable losers.
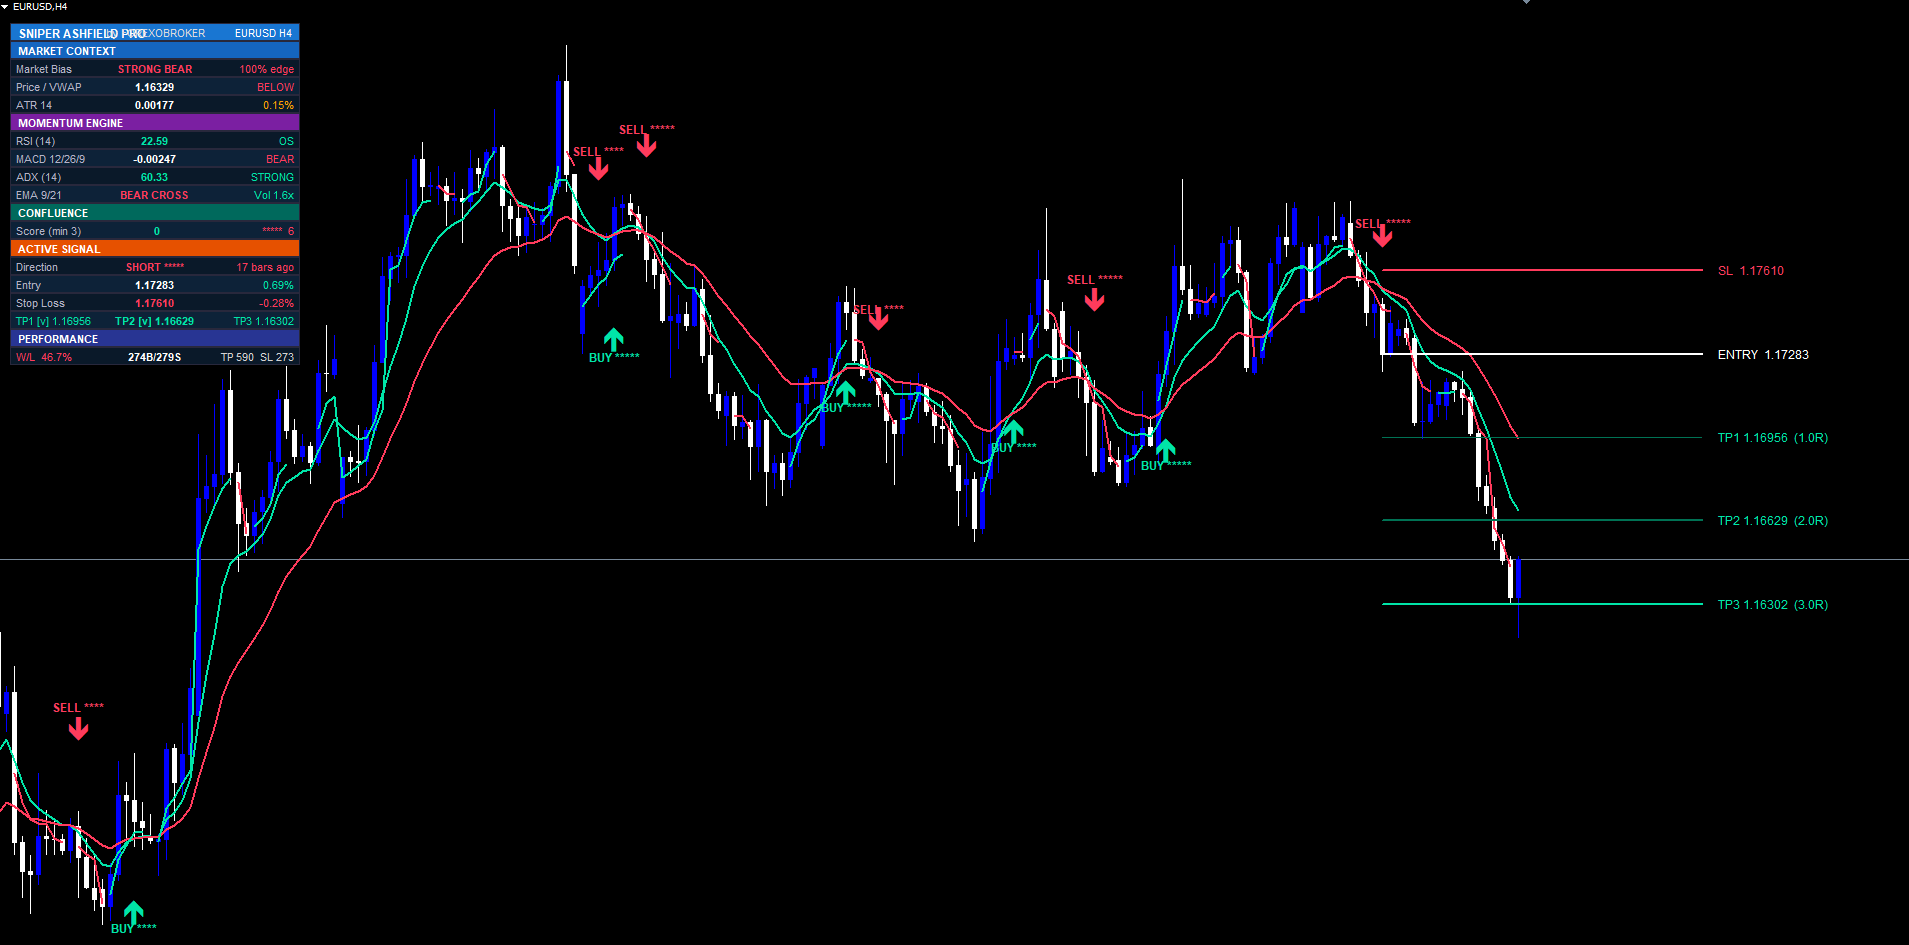
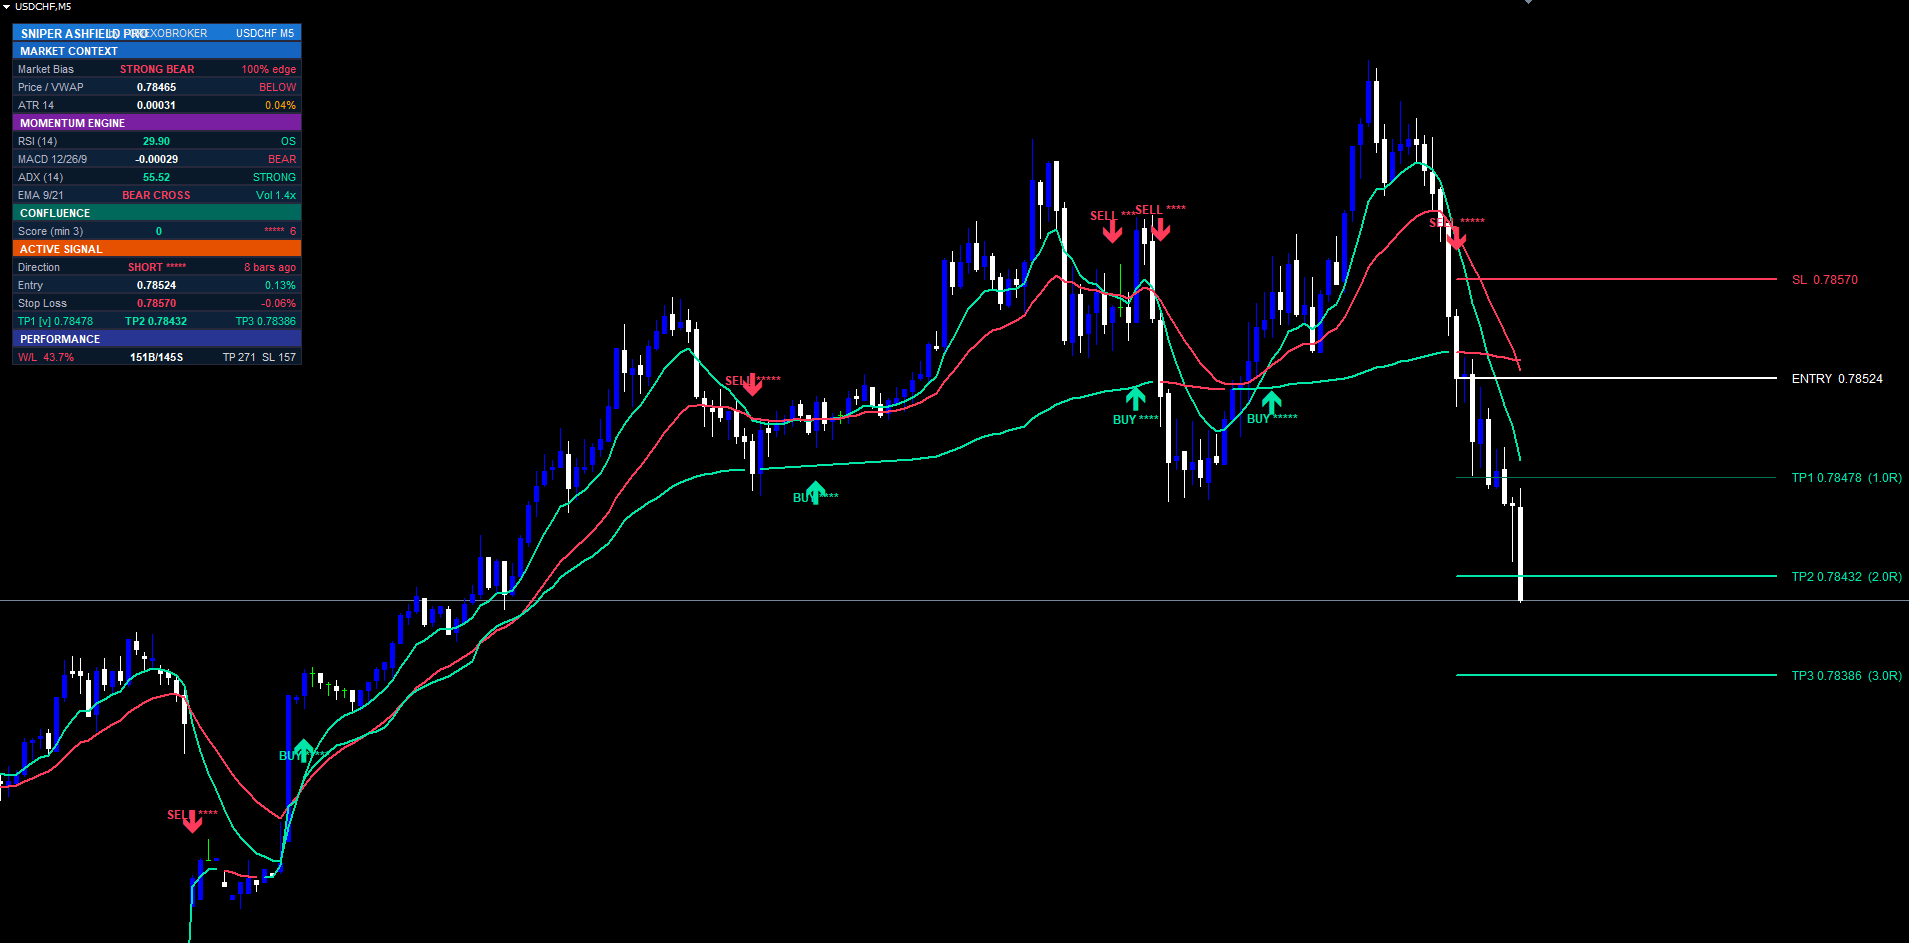
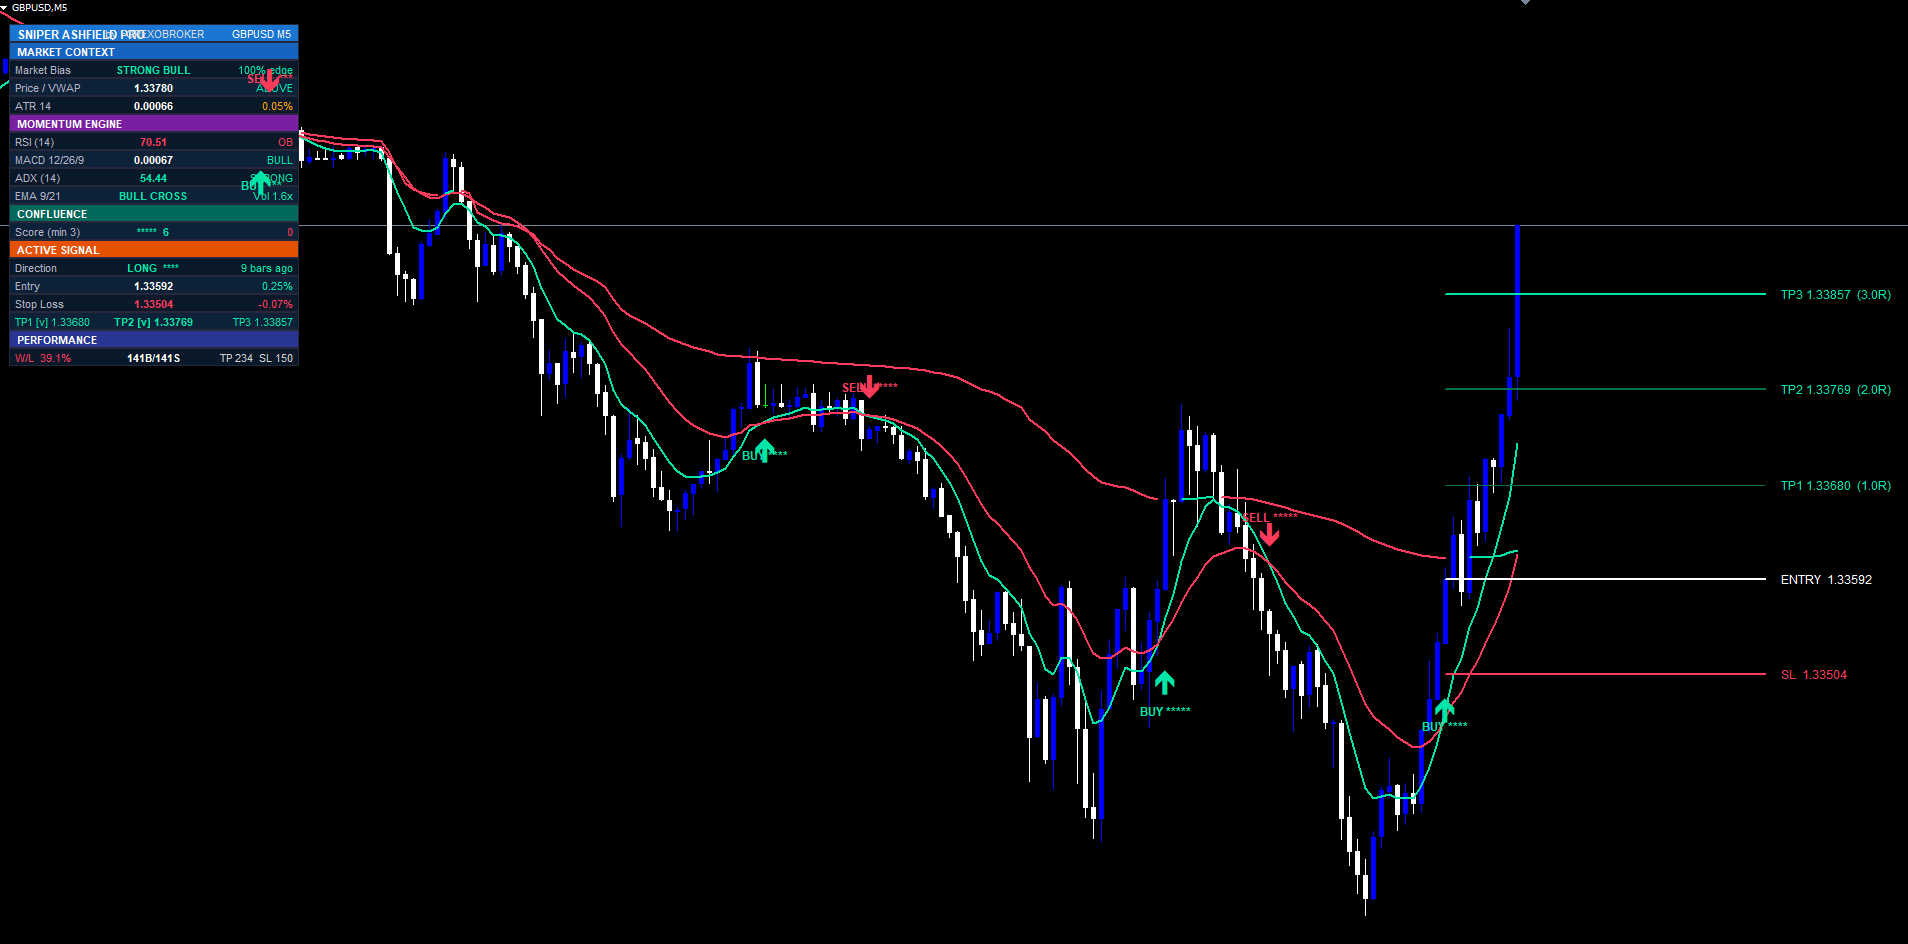
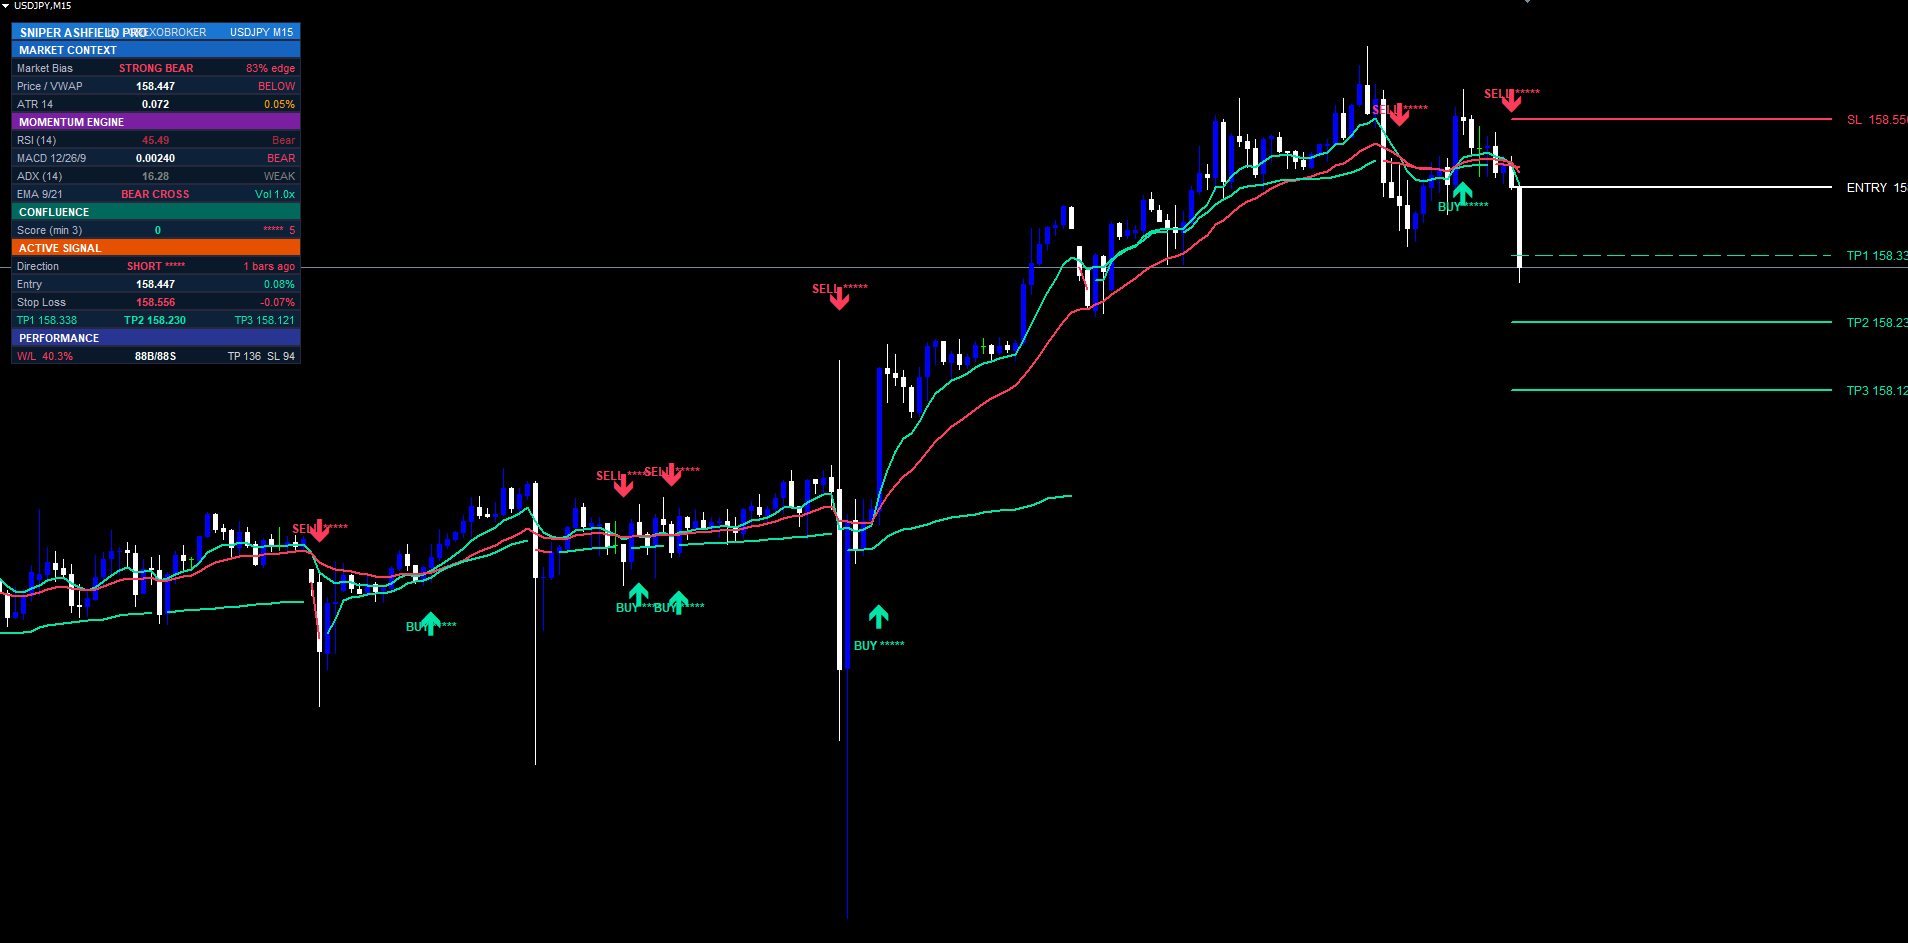
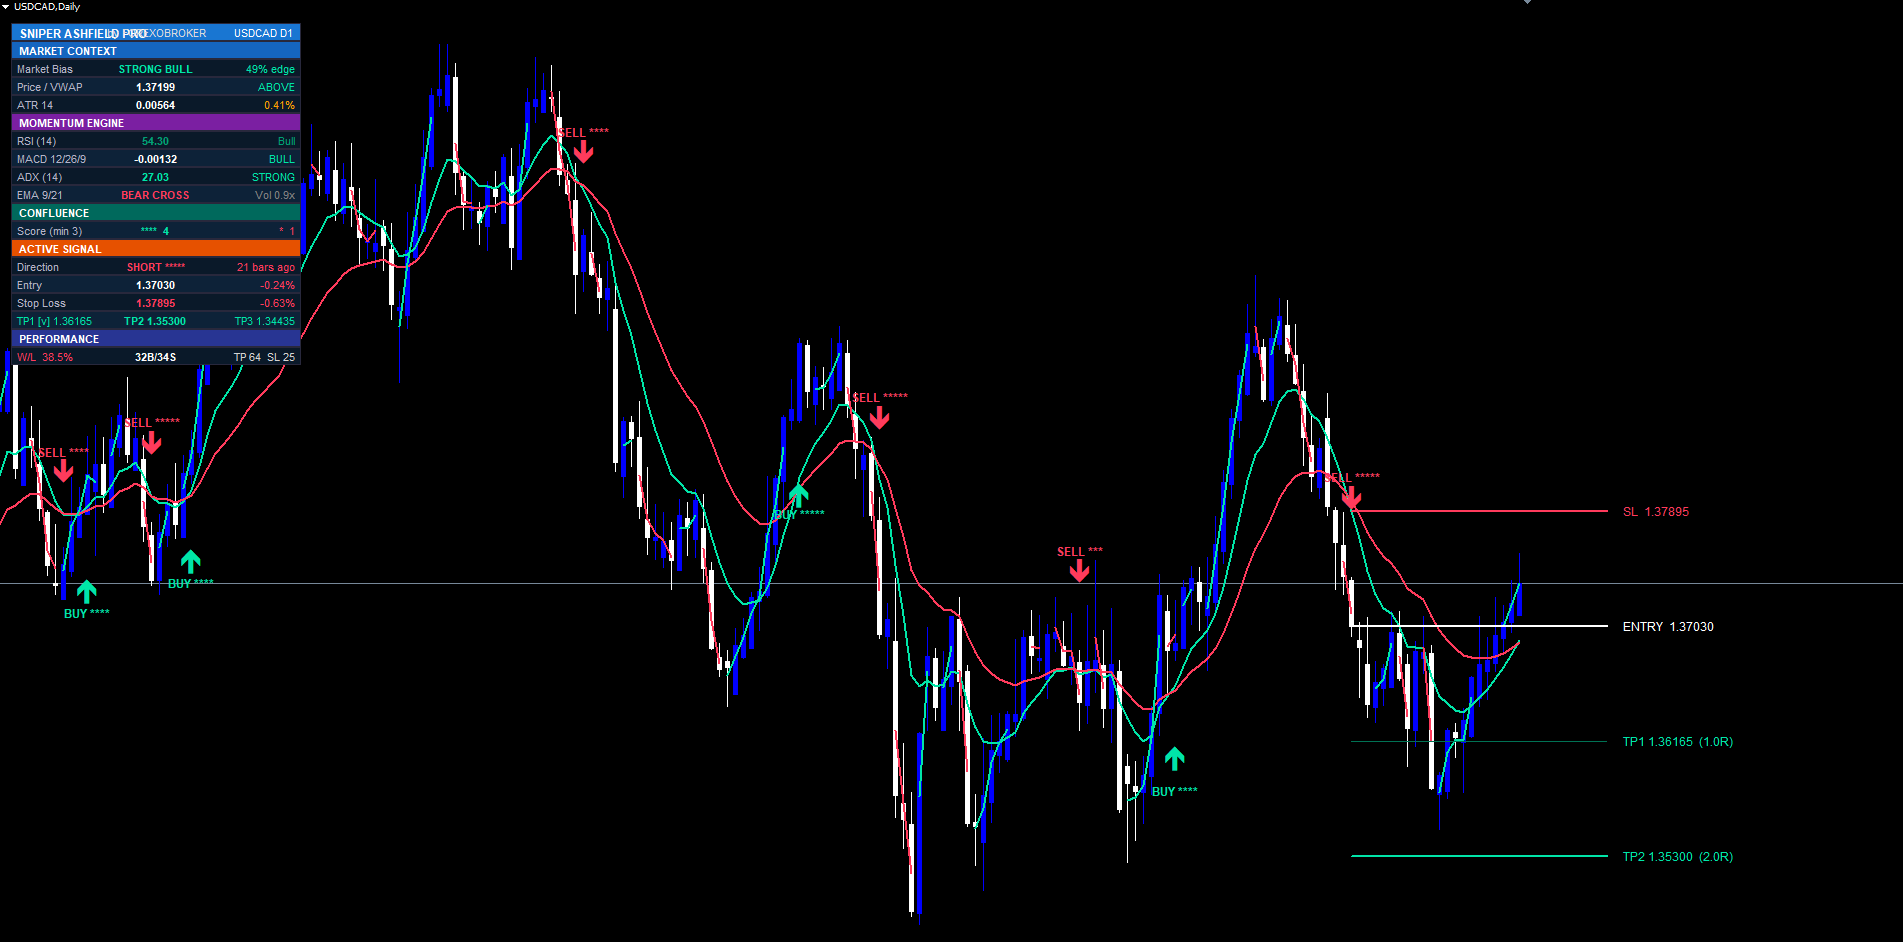
Each level is drawn on the chart as a horizontal trend-line segment (no ray) extending forward from the signal bar by ExtendBars bars (default 40). Visual differentiation is deliberate so the chart reads at a glance: the entry line is solid white, the SL line is dashed red, TP1 is a thin dashed line, TP2 is a full-width dashed line, and TP3 is a dotted line. Each level carries a price label on its right edge, with the TP labels also showing the R-multiple in parentheses, e.g. TP2 1.07845 (2.0R) .
The indicator tracks live hit detection bar by bar. After a signal opens, every subsequent bar checks whether the bar's high (for BUYs) or low (for SELLs) reached each target. When TP1 or TP2 is reached, that line recolors to a faded solid style so you can see at a glance which targets are already banked while the trade is still running. When TP3 is reached the entire trade is considered closed and a win, and all of its level lines are wiped from the chart to keep the view clean. The same wipe happens if the stop is hit first. The performance counter applies one realistic refinement: if TP1 was reached before the stop, the closed trade counts as a win — because a disciplined trader would have moved the stop to breakeven after banking TP1.
There is only ever one active trade-line set on the chart at a time. When a fresh signal fires, the previous set of lines is wiped and the new set drawn. This keeps the chart focused on the trade that matters right now while the historical BUY/SELL arrows remain permanently visible for review.
On-Chart Visuals — BUY/SELL Arrows and Star Ratings
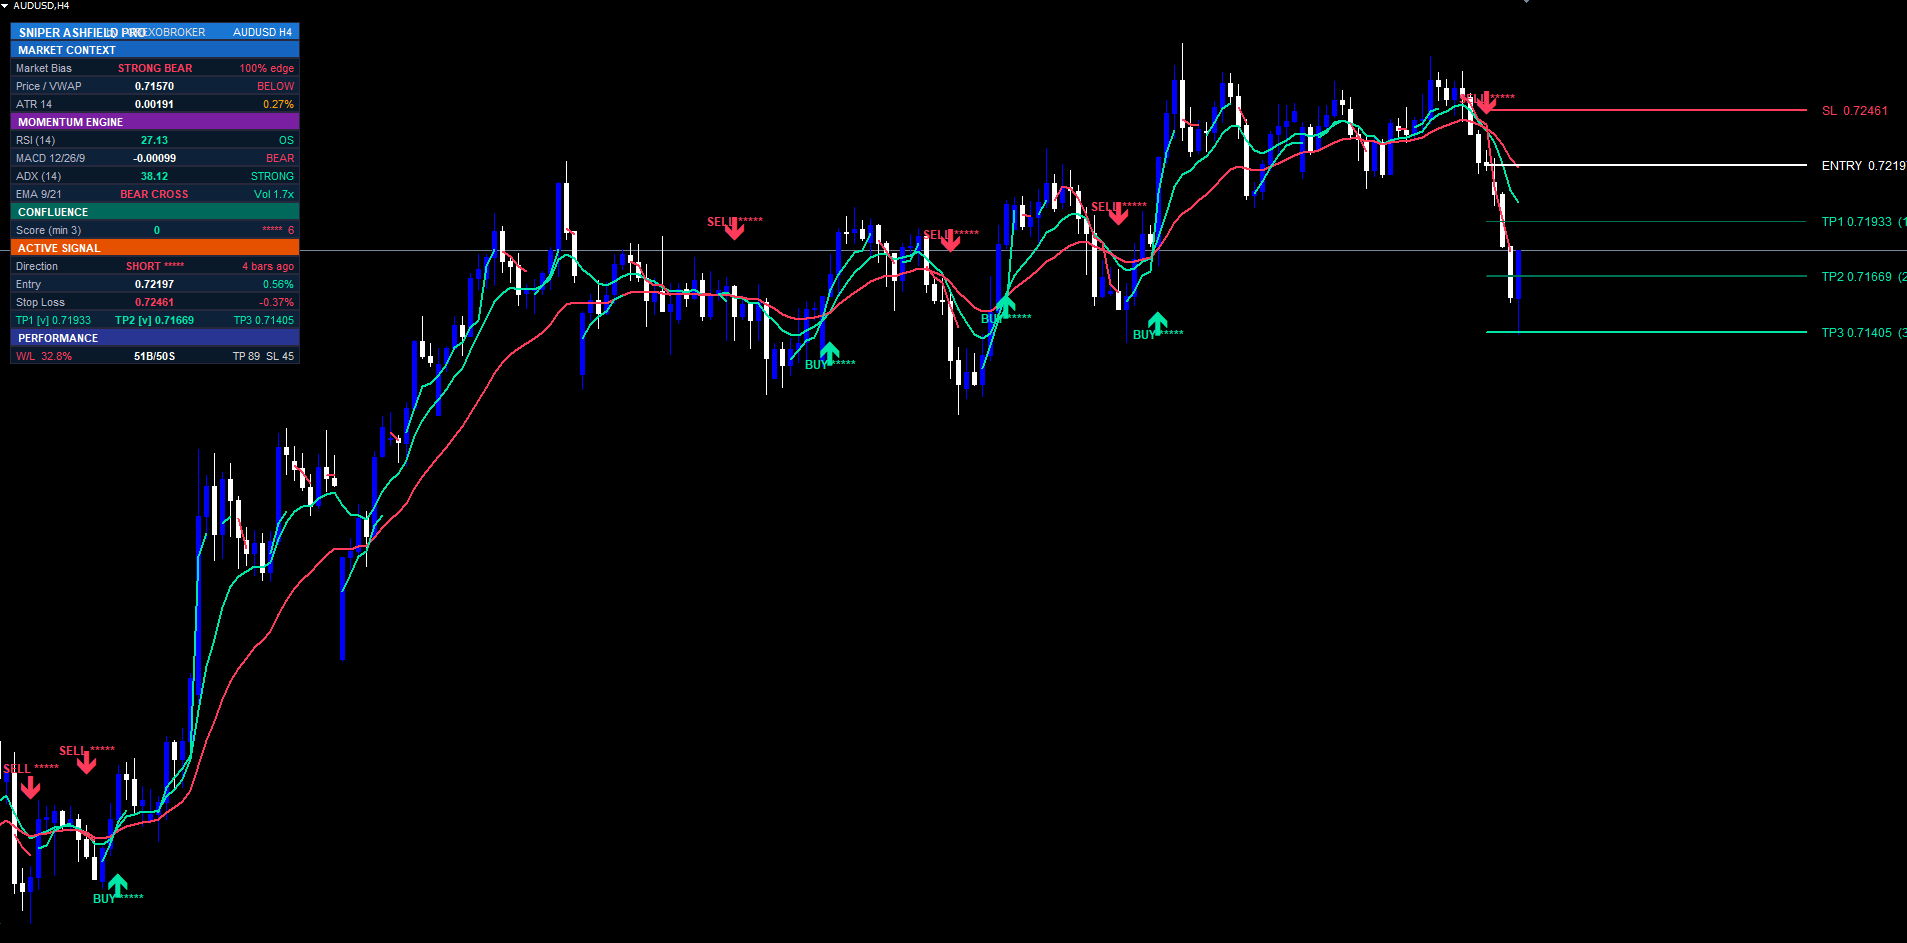
When a signal clears the confluence gate, two on-chart elements are drawn at the signal bar.
The first is a Wingdings arrow: up-arrow code 233 for BUYs, down-arrow code 234 for SELLs. The arrow is placed below the bar's low (BUYs) or above the bar's high (SELLs), offset by 0.8 × ATR so it sits clear of the candle at any zoom. Arrow color matches direction — the bullish color for buys, the bearish color for sells — and is anchored so it always points toward the candle. The indicator uses the generic OBJ_ARROW object with an explicit arrow code, never the reserved trade-history arrow objects, so the markers render reliably from an indicator context.
The second is a bold text label placed a further half-offset away from the arrow, reading BUY or SELL followed by an ASCII star string whose length equals the confluence score: ***** for 5, *** for 3, and so on. ASCII stars are used deliberately — Unicode star glyphs render as question marks on many MetaTrader font/locale combinations, whereas a plain asterisk is universal.
Crucially, signal arrows and their star labels are drawn once at signal time and never deleted. Unlike the SL/TP lines (which are wiped at trade close to declutter the chart), every historical BUY and SELL stays permanently on the chart. You can scroll back through months of history and see exactly where every confluence-cleared sniper entry fired and how strong each one was. This makes the indicator self-documenting: the chart itself is a complete trade log of what the system would have taken.
Because evaluation happens only on confirmed closed bars and arrows are keyed by the signal bar's timestamp, the historical replay drawn when you attach the indicator is byte-for-byte identical to what fired in real time. There is no hindsight repaint, no shifting arrow, no disappearing signal.
The Nineteen-Row Dashboard
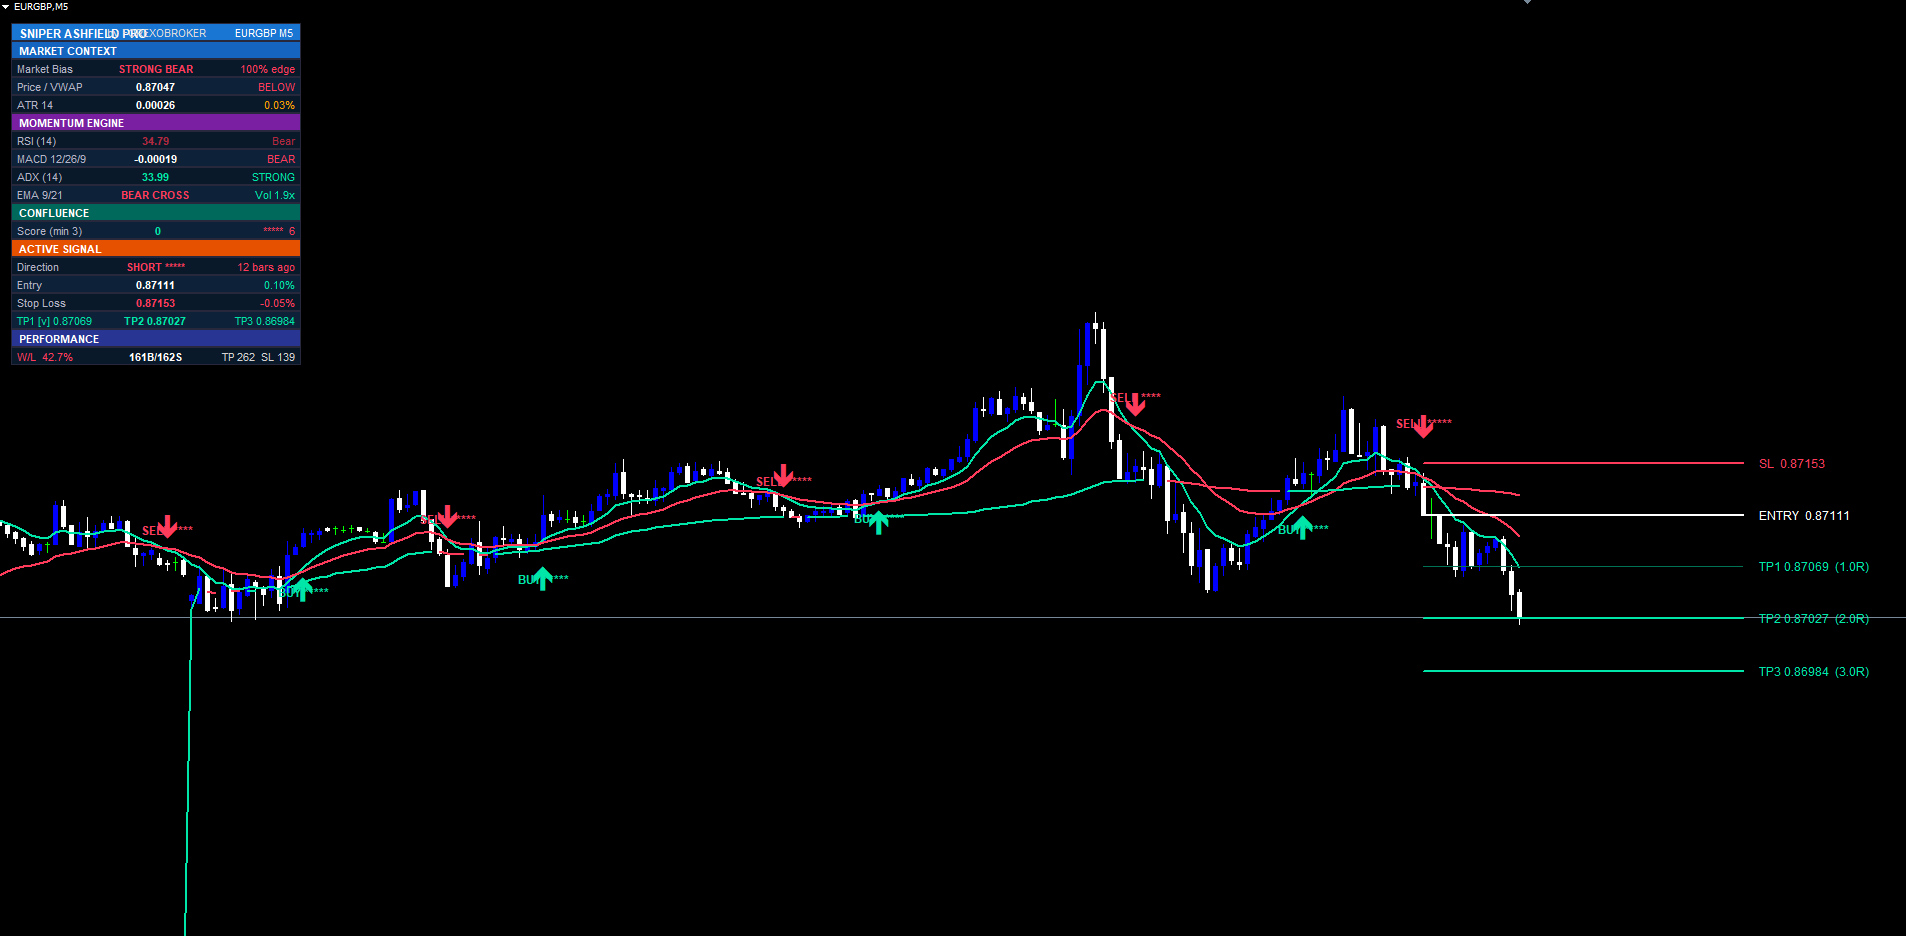
The dashboard is a pixel-anchored widget built from OBJ_RECTANGLE_LABEL background cells and OBJ_LABEL text. It is anchored to a chart corner so it stays put through scroll, zoom, and symbol changes, and it re-anchors automatically when the terminal window is resized.
It is organized into six sections across nineteen rows:
Header (row 0). SNIPER ASHFIELD PRO brand title on the left, by FOREXOBROKER centered, and the current symbol + timeframe on the right.
Market Context (rows 1–4). Section header, then: Market Bias (STRONG/MILD BULL or BEAR, or NEUTRAL, derived from the buy/sell score spread, with the percentage edge); Price / VWAP (current close and whether it is ABOVE or BELOW the session VWAP, color-coded); ATR (the ATR value plus ATR as a percentage of price, useful for comparing volatility across instruments).
Momentum Engine (rows 5–8). Section header, then: RSI value with descriptive state (OB / OS / Bull / Bear); MACD main value with BULL/BEAR signal-cross state; ADX value with STRONG/WEAK trend classification against the threshold; the EMA-cross state (BULL CROSS / BEAR CROSS) alongside the current volume ratio (current bar volume ÷ 20-bar SMA).
Confluence (rows 9–10). Section header, then a single row showing the live buy score (with stars) and live sell score (with stars), with the minimum-required threshold printed in the row label. This is the section to watch — it updates every tick so you can see a 2-of-6 build toward a 4-of-6 in the final seconds of a forming bar.
Active Signal (rows 11–15). Section header, then: Direction (LONG / SHORT / WAITING with the signal's star score and bars-ago); Entry (entry price with live percentage P&L from entry); Stop Loss (SL price with percentage distance from entry); and a single row showing TP1 / TP2 / TP3 prices, each prefixed with [v] once that target has been reached.
Performance (rows 16–18). Section header, then a summary row: running win-rate percentage (color-coded by whether it is above or below 50%), the total BUY/SELL count, and the aggregate TP-hit and SL-hit totals.
Font size is configurable from 6 to 14, and the dashboard can be anchored to any of the four chart corners via the DashCorner input. The brand header color is configurable too. The whole layout is computed from the live chart pixel dimensions so it always fits cleanly regardless of window size.
Full Alert Package
Sniper Ashfield Pro ships with thirteen distinct alert events delivered through four channels — MetaTrader pop-up dialog, push notification to the mobile app, email, and an audible sound — each independently toggleable.
Alert events:
- BUY signal fired
- SELL signal fired
- Any signal (combined BUY or SELL)
- Bullish EMA cross (raw crossover, pre-confluence)
- Bearish EMA cross (raw crossover, pre-confluence)
- Price crossed above session VWAP
- Price crossed below session VWAP
- RSI crossed above 50
- RSI crossed below 50
- TP1 hit
- TP2 hit
- TP3 hit
- SL hit
The primary signal alert message includes the indicator name, symbol, timeframe, entry price, the confluence score out of 6, and all four risk levels. Example:
Sniper Ashfield Pro: BUY signal on EURUSD H1 @ 1.07842 | Score 4/6 | SL 1.07520 TP1 1.08164 TP2 1.08486 TP3 1.08967
All alert text is ASCII only — no Unicode glyphs that might render as question marks on certain platforms. The master FireAlert dispatcher routes each event to whichever of the four channels are enabled; the signal alert can additionally trigger the configured sound file. The whole system is gated by a non-repaint silence flag during the initial historical replay, so attaching the indicator to a chart never floods your terminal with hundreds of historical alerts — only fresh signals on new bars after attachment will alert. Per-bar deduplication ensures the same bar cannot fire the same alert twice even if the indicator recomputes the bar on subsequent ticks before close.
Non-Repaint Guarantee
Every signal, every level line, every dashboard value is computed from confirmed, closed-bar data only. The non-repaint behavior is achieved through three architectural choices:
- Closed-bar evaluation only. When NonRepaintMode is enabled (default), signal detection runs at shift 1 — the most recently closed bar — never at shift 0, the actively forming bar. A crossover detected on bar N is final the instant bar N closes and is never re-evaluated.
- Timestamp-keyed objects. Signal arrows and labels are named by the signal bar's timestamp. The indicator checks for an existing object before drawing, so a recompute of an already-signaled bar cannot duplicate it.
- Immutable per-bar state. The signal cooldown, last-evaluated-bar tracking, and hit detection all key off bar timestamps, so reprocessing the same bar produces identical results.
This is what makes the indicator viable for systematic backtesting and live deployment. The historical replay drawn at indicator load is identical to the signals that fired in real time. Forward-test results match historical replay results — there is no hindsight advantage baked into the chart.
Input Parameter Reference
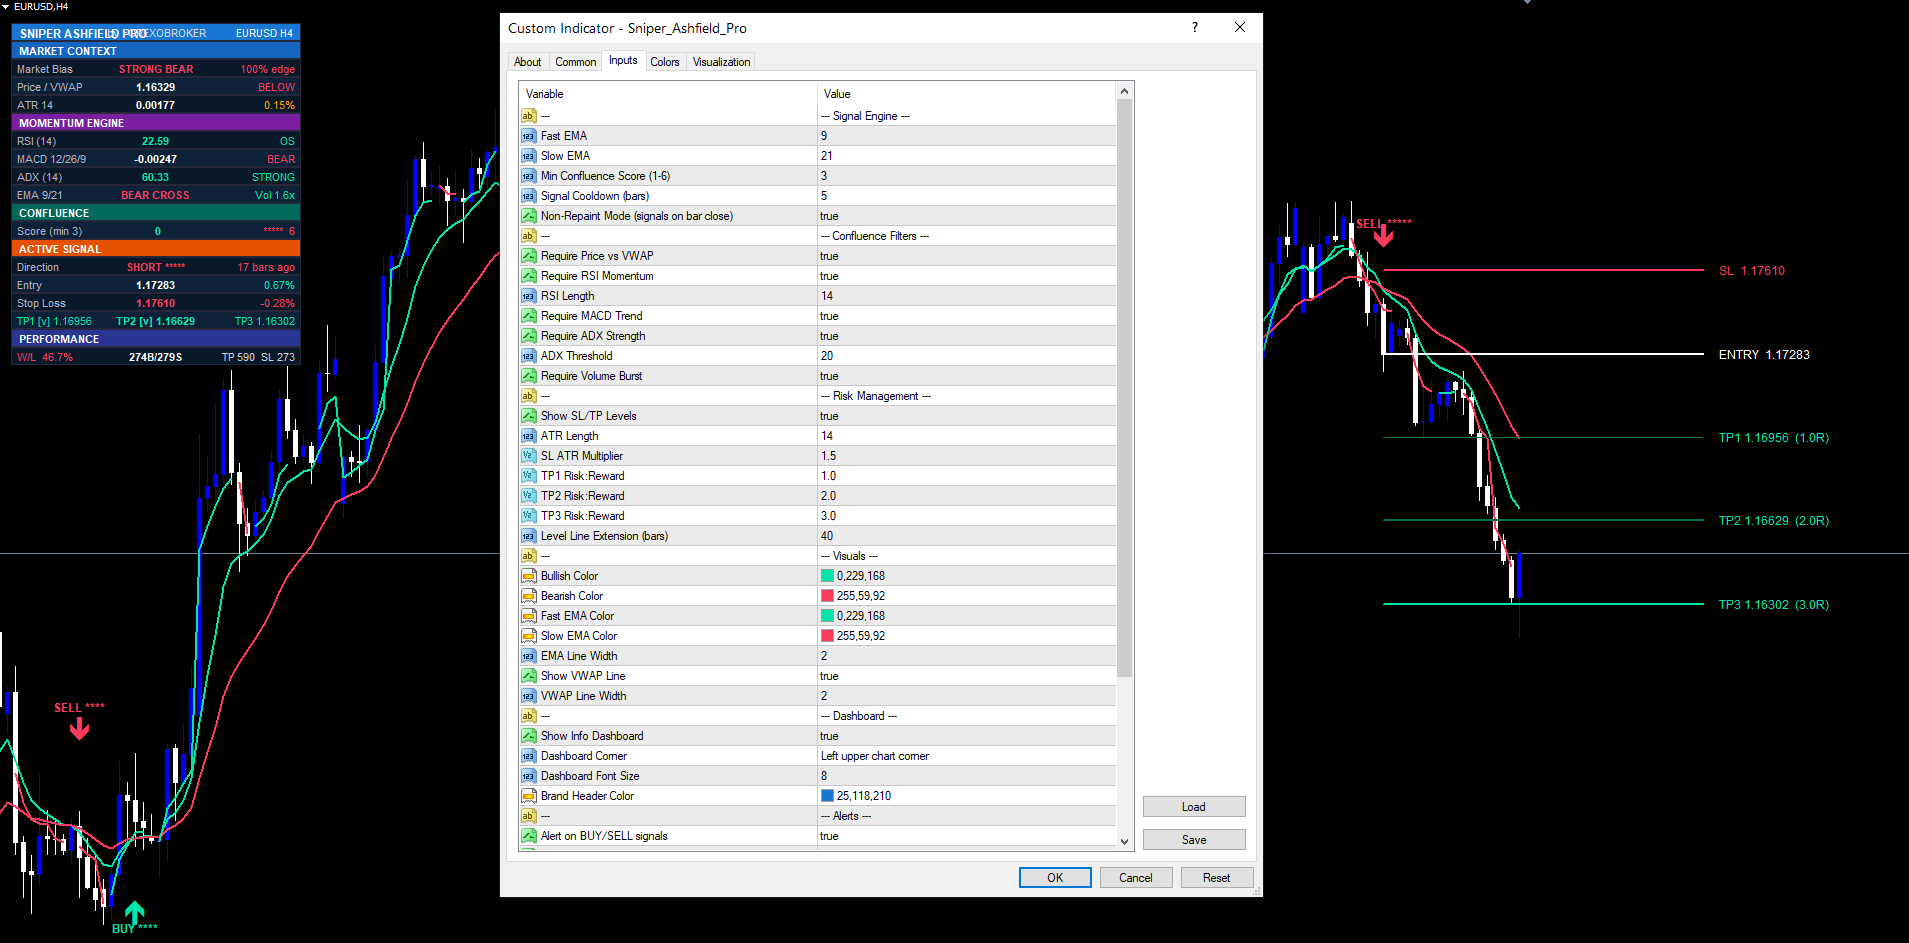
The indicator exposes its inputs in six logical groups. Defaults are tuned for swing trading on H1 majors but every value is adjustable, and every numeric input is range-validated in OnInit — out-of-range values fail initialization with INIT_PARAMETERS_INCORRECT , preventing accidental misuse.
Signal Engine — FastLen (9), SlowLen (21), MinConfluence (3, range 1–6), SignalCooldown (5 bars), NonRepaintMode (true).
Confluence Filters — UseVwap (true), UseRsi (true), RsiLen (14), UseMacd (true), UseAdx (true), AdxThresh (20), UseVol (true).
Risk Management — ShowSLTP (true), AtrLen (14), AtrMult (1.5), RrTP1 (1.0), RrTP2 (2.0), RrTP3 (3.0), ExtendBars (40).
Visuals — BullColor , BearColor , EmaFastColor , EmaSlowColor , EmaWidth (2), ShowVwapLine (true), VwapWidth (2).
Dashboard — ShowDashboard (true), DashCorner (Right Upper), DashFontSize (8, range 6–14), DashHeaderColor .
Alerts — AlertBuySell (true), AlertTPHit (true), AlertSLHit (true), AlertEmaCross (false), AlertVwapCross (false), AlertRsi50 (false), AlertPopup (true), AlertPush (false), AlertEmailOn (false), AlertSoundOn (true), AlertSoundFile ("alert.wav").
For a complete description of each input including recommended values for different markets and timeframes, see the user manual.
Closing
Sniper Ashfield Pro is a complete trading system built around one disciplined idea: an EMA crossover is only a trigger, and a trigger without context is noise. By scoring every EMA9/EMA21 crossover against six independent confluence factors — the cross itself, session VWAP position, RSI momentum, MACD trend, ADX strength with EMA alignment, and a volume burst with candle direction — the indicator converts a notoriously whippy signal into a high-conviction sniper entry. On top of that gate sits a session-anchored VWAP, an ATR-based stop, a 1R/2R/3R take-profit ladder, a non-repainting signal pipeline, and a six-section dashboard that reports live state for every component.
The MT4 and MT5 builds are functionally and visually identical — same trigger logic, same confluence math, same decision pipeline. Both produce the same signals at the same bar timestamps when given the same price data.
Download the indicator:
- MetaTrader 5: Sniper Ashfield Pro MT5
- MetaTrader 4: Sniper Ashfield Pro MT4
CONTACT & SUPPORT
- Email: info@forexobroker.com
- Questions: Use the Comments section on the product page or send a private message
- Bug Reports: Please include your broker name, account type, and a screenshot
-
✅ All MQL Tools: https://www.mql5.com/en/users/forexobroker/ ✅
--------------------------------------------------------------------------------------------------------------
🏦 **Broker I use**: https://icmarkets.com/?camp=55869
🏦 **Broker For EU Traders I use 1**: https://www.ictrading.com?camp=91414
🏦 **Broker I use 2**: https://one.exnessonelink.com/boarding/sign-up/a/c_thuv62ocfq
💻 **VPS**: https://chocoping.com/processing/aff.php?aff=738
💼 **Companies I use for getting funded**:
Fundednext: https://fundednext.com/?fpr=kestutis39
The5ers: https://www.the5ers.com/?afmc=16kl
FTMO: https://trader.ftmo.com/?affiliates=nRAyOhmFRnEnFdOpdLeh
Risk Disclaimer
Trading foreign exchange and CFDs on margin carries a high level of risk and may not be suitable for all investors. You may sustain a loss exceeding your initial investment. Trend Quorum is a technical analysis tool and does not guarantee profitable trades. Past performance is not indicative of future results. The authors accept no liability for any loss arising from use of the indicator. By using Trend Quorum you acknowledge sole responsibility for your trading decisions.


")

")