

A multi-pair, multi-timeframe dashboard that reads what the market is actually doing... not just what price looks like.
New Updates in v1.12:
Available here:
MT4:
https://www.mql5.com/en/market/product/176872/
MT5:
https://www.mql5.com/en/market/product/176873/
What Is It?
This PVSRA Screener is for real-time market analysis.
so instead of manually checking charts one by one, you get a live command center that tells you the market phase, volume intent, trend state, and nearest price structure all in one glance.
Features at a Glance
- Multi-pair, multi-timeframe scanner dashboard... monitors everything at once
- PVA (Price Volume Analysis)... detects Climax and Rising volume candles in real time
- The Dragon EMA... configurable trend anchor (default 50 EMA of Typical price, HLC/3)
- 200 EMA trend filter... separates bull regime from bear regime for each pair
- 89 EMA Momentum Slope... confirms natural momentum is present before signaling
- Round number proximity (Whole .00, Half .50, Quarter .25/.75 levels)
- Stop Hunt detection... identifies MM traps at key S&R levels
- Squat pattern... spots high-volume absorption bars with narrow range
- Run Exhaustion... warns when price is overextended from the Dragon
- Accumulation and Distribution phase identification
- Wave check (Higher Lows for longs / Lower Highs for shorts)
- Session filter... highlights active trading hours with different colors
- Untested Daily and Weekly price magnets... tracks whether key highs and lows have been visited
- M1 Cross-TF Volume gate... optional confirmation that lower timeframe volume aligns
- Color-coded action priority... from neutral gray to bright lime green for the highest probability setups
- Configurable alerts for every setup type independently
- Two scanner modes: Trend Mode and Retracement Mode
- Fully customizable colors, EMA periods, volume thresholds, and proximity settings
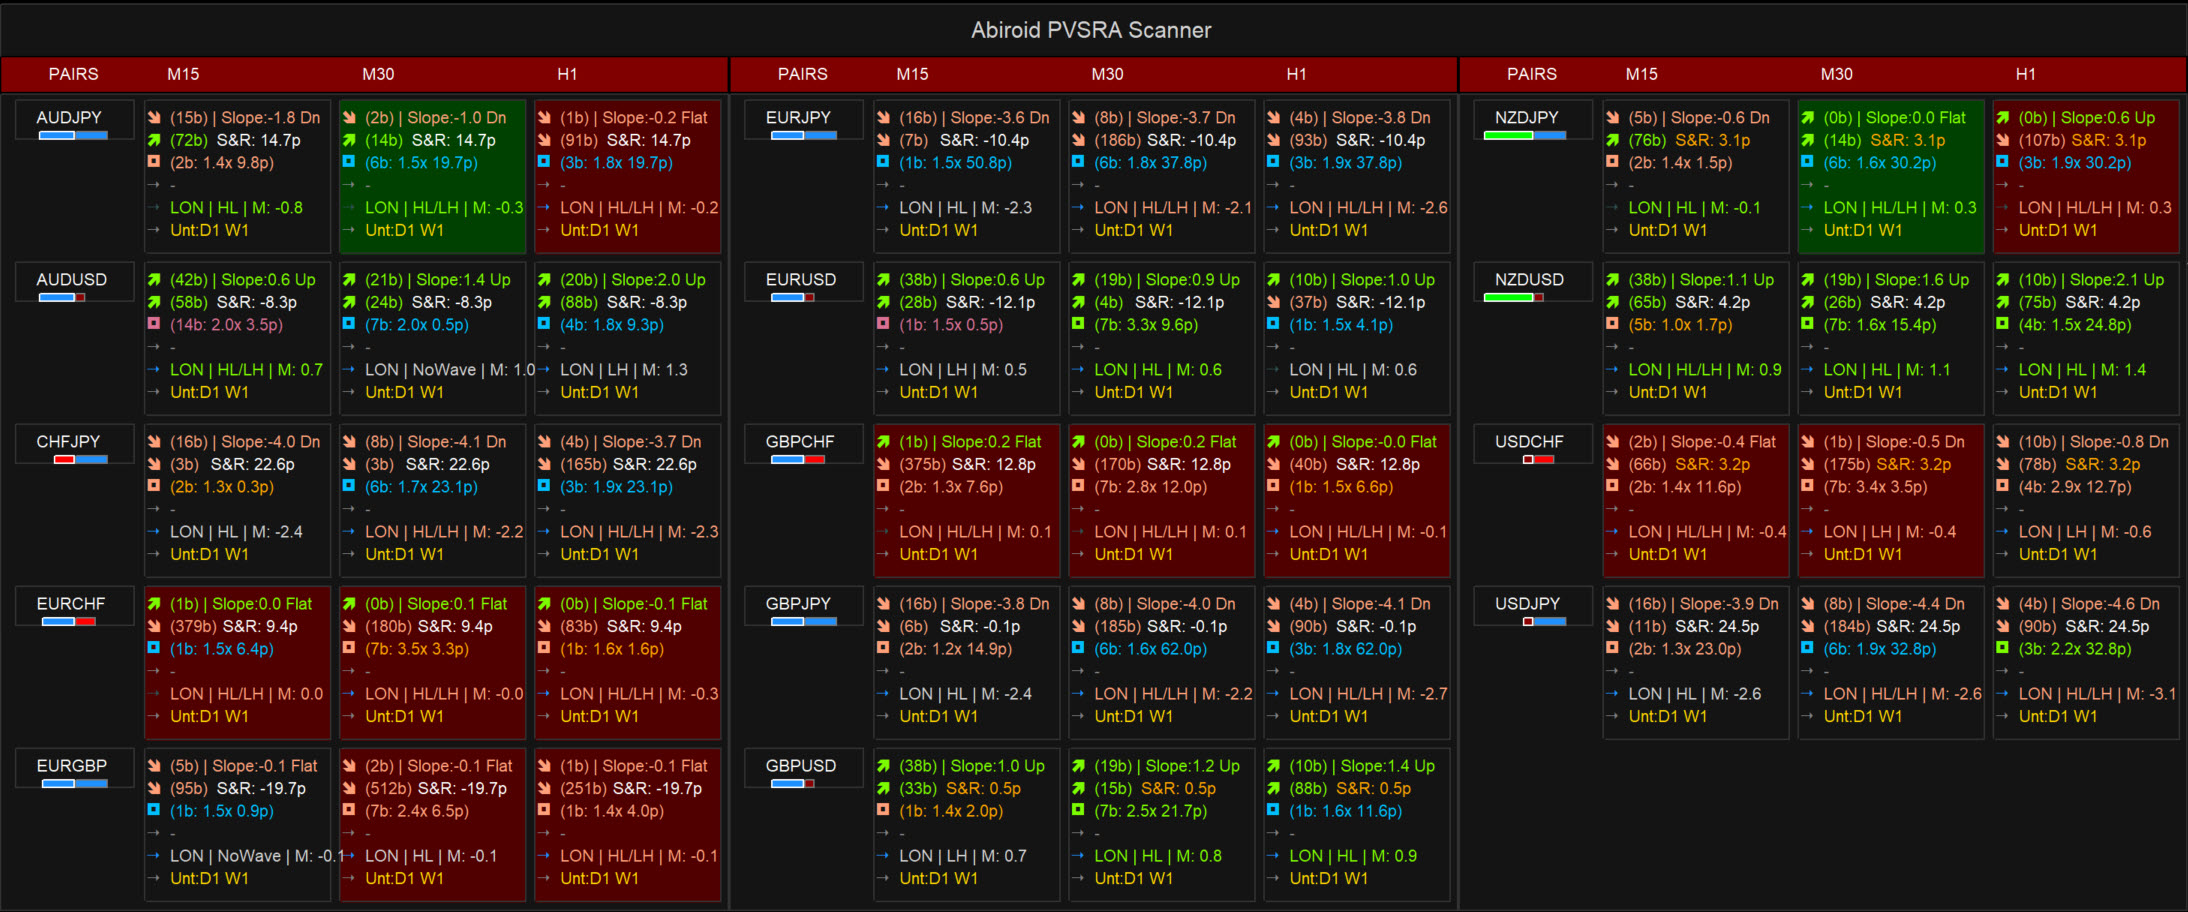
Understanding the Dashboard Layout

Each cell in the dashboard corresponds to one pair + one timeframe combination. Inside each cell, there are six rows of information stacked vertically:
| Row | What It Shows |
|---|---|
| Row 1: Dragon Cross/Touch | When price last crossed or touched the Dragon EMA, which direction, and detailed slope info (e.g. 5.2 Strong). |
| Row 2: Trend & Location | When the Dragon last crossed the 200 EMA, how many bars ago, plus distance to nearest S&R level in pips |
| Row 3: Volume Activity | Most recent PVA signal... how many bars ago, the volume intensity multiplier, and distance to the anchor candle open |
| Row 4: Setup Label | The main verdict... what the market is doing right now in one clean label |
| Row 5: Session/Wave | Session Status (ON/OFF), Wave structure (HL/LH/NoWave), and 89 EMA momentum slope value |
| Row 6: Price Magnets | Whether Daily or Weekly highs/lows are untested... shown in gold when active, silver when all have been tested |
| Row 7: Gann Zone (when enabled) | Where price is relative to user-defined Gann sweep percentage zones... Above Zone, Below Zone, In Zone, or Bounce |
Background Color Meaning
The background of each cell tells you the overall market phase at a glance before you even read the text:
| Color | Meaning |
|---|---|
| Dark Green | Bullish setup... Dragon above the 200 EMA, and price touching or recently crossed above the Dragon. Optional High Volume gate ensures highlight only appears during Climax (2.0x) activity. |
| Dark Red | Bearish setup... Dragon below the 200 EMA, and price touching or recently crossed below the Dragon. Optional High Volume gate ensures highlight only appears during Climax (2.0x) activity. |
| Teal/Cyan | Contradictory Intention (Accumulation)... trend is Bearish but Bullish Volume (Climax or Rising) appeared. smart money may be building longs during a downtrend. If PriceDragon_OppositeTrend is enabled, this highlight warns you to stop selling. |
| Purple/Magenta | Contradictory Intention (Distribution)... trend is Bullish but Bearish Volume (Climax or Rising) appeared. smart money may be exiting or building shorts. If PriceDragon_OppositeTrend is enabled, this warns you to stop buying even if price is above the Dragon. |
| Orange/Brown | Climax Run or Exhaustion... price is running hard and far from the Dragon |
| Dark Slate Gray | Momentum divergence... trend direction and 89 EMA slope point opposite ways. Reduce size or wait for resolution. |
| Neutral / No background | Dragon is flat (isDragonFlat = true)... no valid slope. Scout signals are suppressed regardless of trend regime. |
| Blue (Row 5) | Trading Session is ON |
| Gray (Row 5) | Trading Session is OFF (Outside of Start/End range) |
The Setup Labels... What Every Signal Means
Row 4 is the heart of the scanner. Here is every label you will see and what it tells you:
READY (L) / READY (S)... Scout Long/Short
All three core conditions are met: the Dragon EMA is on the correct side of the 200 EMA, price has pulled back to touch the Dragon, and a Climax volume candle has appeared at or near a key round number (.00, .50, or .25/.75 level). The Dragon is not flat. This is the standard Sonic R. entry signal.
FULL SETUP (L) / FULL SETUP (S)... High Probability Scout
Everything that makes READY (L) or READY (S) true, plus the M1 chart is also showing a Climax or Rising volume candle in the same direction at the same moment. This is the strongest signal the scanner can produce, meaning the setup is confirmed by a lower timeframe as well. Color is bright lime green or red to make it stand out immediately.
Enabling UseMTFVolumeCheck acts as a "Truth Filter": it only upgrades to FULL SETUP when M1 volume confirms the same directional accumulation/distribution, preventing false breakouts where institutional volume was actually distributing opposite to the trend.

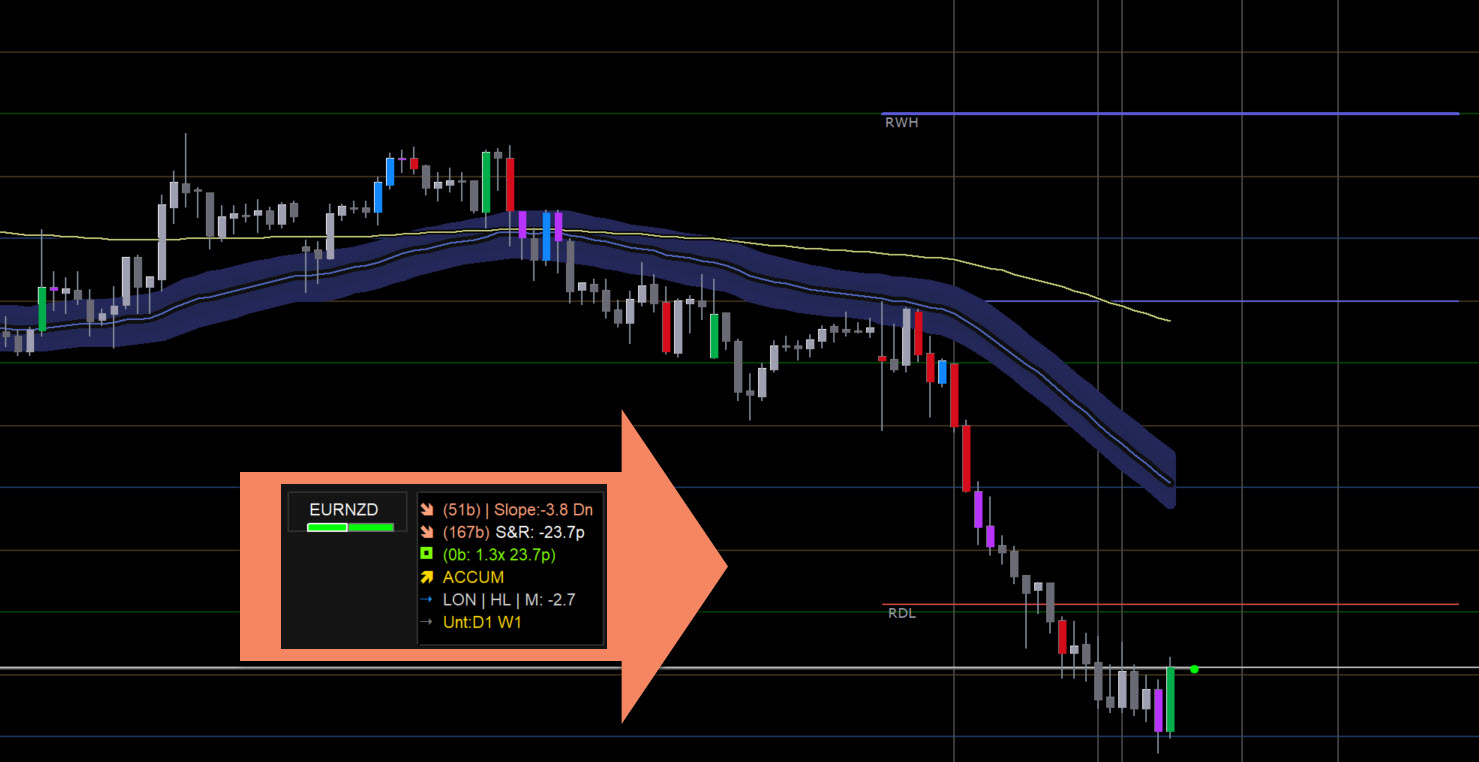
ACCUM... Accumulation
A Bull Climax or Rising Bull volume candle is appearing, but price is currently below a key round number level. This means MMs are likely building long positions in the zone before pushing price up through that level. It is not yet a trade entry, but it is a heads-up that buying pressure is building.
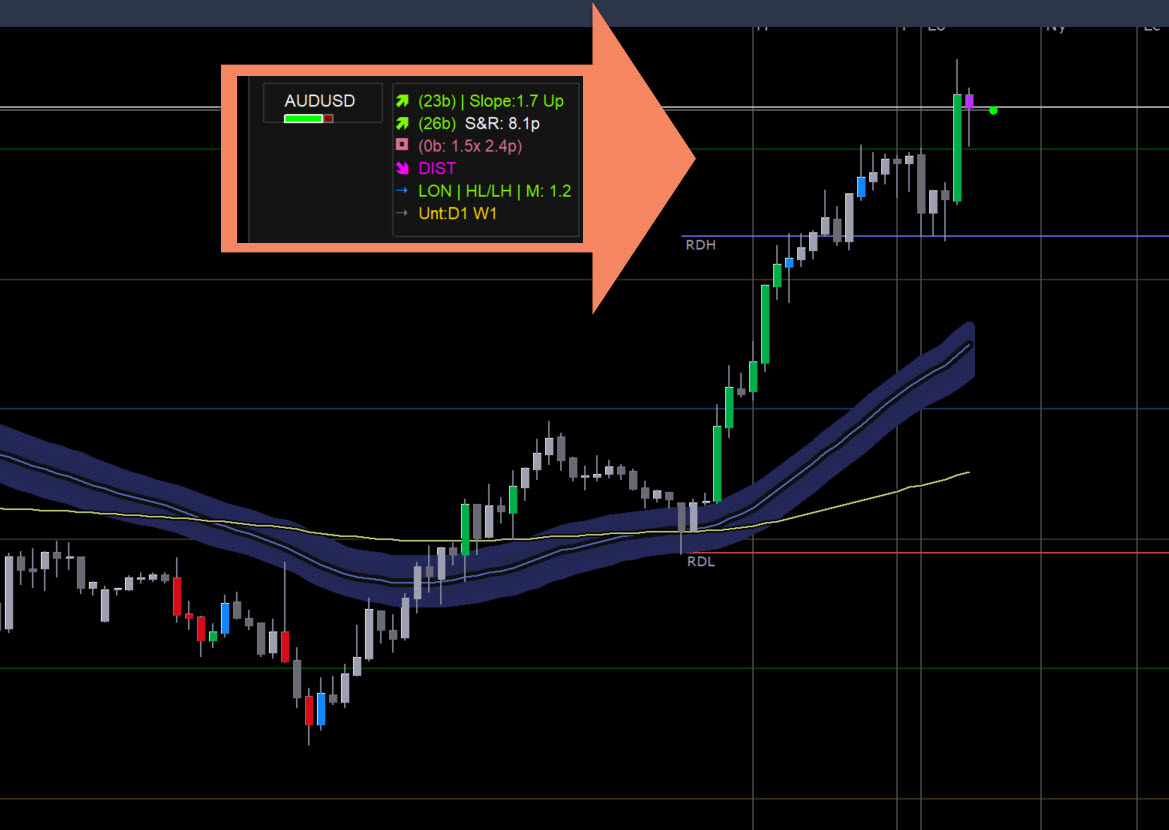
DIST... Distribution
The opposite: a Bear Climax or Rising Bear candle is appearing above a key level. MMs may be offloading longs or building short positions above that structure. Again, not a direct entry signal but a warning that selling pressure is accumulating.
The Contradictory Climax background takeover: When a Climax candle opposes the current trend, the cell background turns Purple (Distribution in uptrend) or Teal (Accumulation in downtrend). This indicates institutional activity opposing the trend (e.g. MMs selling longs to retail buyers in a bull trend, or accumulating longs in a bear trend). Avoid new entries in the trend direction until the background clears.
STP HUNT B / STP HUNT S... Stop Hunt Buy/Sell
A Climax candle wicks past a key round number level to trigger stop losses, then closes back on the safe side (or price returns there). This rejection combined with high volume signals cleared retail liquidity and a high-probability reversal setup.


SQUAT (B) / SQUAT (S)... Market Maker Absorption
A high-volume candle with an unusually narrow range (measured via the volume-spread product: volume × bar range). A Squat indicates market maker absorption—enormous institutional volume (effort) is entering the market, but price is not moving (no result). A Squat Bull near support suggests MMs are absorbing all selling pressure before driving price up, while a Squat Bear near resistance suggests MMs are absorbing buying pressure. It acts as both a continuation prelude and a reliable exit signal near targets.
CLMX RUN (B) / CLMX RUN (S)... Climax Run
Price is already extended away from the Dragon (beyond the configured ATR distance threshold) and a Climax candle is appearing. This means a trend is accelerating with heavy volume. It can indicate the start of a big breakout move or the very late stages of an existing run... context matters. Do not enter blind; check whether price is exiting a consolidation or already in a wide range extension.
RUN (Exit)... Run Exhaustion
Price is very far from the Dragon (more than 2x ATR away) and a Climax candle is appearing. This is a warning that the move may be ending. Existing profitable trades should consider tightening stops. New entries against this signal are high risk.
STARK (B) / STARK (S)... Bounce from Extremes
A Climax volume candle appearing after a sharp move where price is extended. This often indicates a deep stop hunt or a major bounce from macro support/resistance.
Row 5 in Detail... Sonic R. Context

This row runs three checks simultaneously and compresses them into a short readable string. Here is what each part means:
Session Label (ON / OFF)
Tells you whether the trade session is currently active based on your Session Start Hour and Session End Hour inputs (Broker Time). Trading within ON hours ensures you are participating when institutional volume is typically present. Signals during OFF hours carry a lower probability of follow-through and are highlighted with a gray background in Row 5.
Wave Label (HL / LH / NoWave)
Checks the last two bars for the structural wave condition. For a long trade to have full structural backing, you want to see a Higher Low forming... meaning the most recent pullback low is higher than the previous one (HL). For a short, you want a Lower High (LH). If neither is present, the label shows NoWave. The text color turns green when the wave direction aligns with the trend, and stays gray if it does not.
Momentum Value (M: +X.X)
The average per-bar slope of the 89 EMA over the last few bars, expressed in pips per bar. A positive value means the 89 EMA is rising... momentum is to the upside. A negative value means it is declining. If you have a bullish trend (Dragon above 200 EMA) but the 89 EMA slope is negative, the row background will shift to dark slate gray as a warning that momentum has stalled and a long entry carries more risk than usual.

Row 6 in Detail... Price Magnets
Daily and Weekly price extremes (previous session highs and lows) are powerful magnetic levels. The scanner tracks yesterday's High/Low (D1) and last week's High/Low (W1). If they have not been touched by the current bar, they are marked as untested (e.g., Unt: D1 W1 in gold). Once tested, the row shows All Magnets Tested in silver.
TIP: Untested magnets are prime targets. If price sweeps an untested D1 low and closes back above it, look for a STP HUNT B confirmation for a high-probability reversal.
How the Calculations Work... Behind the Scenes
This section explains what happens inside the scanner on every tick so you understand exactly why a particular label appears.
Step 1: Volume Analysis (PVA)
For each bar, the scanner calculates an average volume over the last N bars (default 10, configurable). It also computes a second measure called Value2... which is the current bar's volume multiplied by its high-low range. This two-dimensional check is more reliable than raw volume alone because a high-volume narrow candle (Squat) behaves very differently from a high-volume wide candle (Climax Run).
The bar is classified as:
- Climax Bull/Bear if Value2 is the highest seen in the last 10 bars, OR if current volume is 2x the average (configurable multiplier)
- Rising Bull/Bear if volume is 1.5x the average (configurable) but does not meet the Climax threshold
- Direction (Bull vs Bear) is determined by whether the close is above or below the open
Step 2: The Dragon EMA... Your Trend Anchor
The Dragon is a moving average of your choice (default: 50 EMA of Typical price... HLC/3, meaning (High+Low+Close)/3). It acts as a dynamic support and resistance line that slopes with the trend. Typical price is used rather than Close or Median (HL/2) because it incorporates the closing price while still smoothing out wick extremes... this gives the Dragon better stability on instruments with frequent intraday spikes. The scanner checks three things about it:
- Is price currently touching the Dragon? (High is above AND Low is below the Dragon value... a wick touch counts, full body cross is not required)
- Is price cleanly above the Dragon, or cleanly below?
- Is the Dragon sloping, or is it flat? Flat Dragon entries are filtered out by default because they lack directional conviction
The slope is calculated as an ATR-based ratio: (PriceCurrent - PricePast) / (ATR * Bars) * 10 . This normalized approach ensures that Gold and Forex instruments scale identically relative to their volatility. If the absolute slope is below the minimum threshold (default 0.5, which checks if the MA moved at least 5% of the ATR per bar), the Dragon is considered flat and no Scout signals will fire... the cell background will revert to neutral.
A practical way to visualize whether a Dragon slope is valid is the clock analogy. Imagine the Dragon line as a clock hand. For a valid long entry, the Dragon should be angled toward 1 o'clock or 2 o'clock. For a valid short, it should be angled toward 4 o'clock or 5 o'clock. If it is pointing straight across (9 o'clock / 3 o'clock), that is a flat Dragon... the slope filter will suppress the signal and the cell will show no Setup label in Row 4 even if the trend and volume conditions are technically met. This is intentional. Trading a flat Dragon is one of the most common sources of false PVSRA signals.
On the cross type: the scanner uses the High/Low method by default, meaning any candle whose wick reaches the Dragon level qualifies as a price-Dragon touch. You do not need a body close beyond the Dragon. This matches real PVSRA practice... a shadow that tags the Dragon and reverses is as valid a pullback entry as a full body cross.
Step 3: The Trend Filter... 200 EMA
The 200 EMA of closing price defines the macro regime. Dragon above the 200 EMA = bullish regime. Dragon below the 200 EMA = bearish regime. For high-probability Trend Mode setups, the Dragon must be on the correct side of the 200 EMA. This filter strictly eliminates counter-trend noise during deep pullbacks.
Step 4: Round Number Proximity
Price levels ending in .00 are Whole numbers. Levels ending in .50 are Halves. Levels at .25 and .75 are Quarters. These act as magnetic S&R zones where institutional orders tend to cluster. The scanner calculates the pip distance from current price to the nearest level of each type. If that distance is within the proximity threshold (default 10 pips), the pair is flagged as being "at" that level... which is required for Scout and Stop Hunt verdicts to trigger.
For scalping on M1 and M5, Quarter levels (.25 and .75) are particularly important. Intraday swings very commonly stall and reverse at these sub-levels, often leaving no trace on higher timeframes. Keeping SR Level Priority set to All (the default) ensures all four level types are tracked. Swing and position traders can narrow to Whole & Half to reduce noise... but for any fast-timeframe work, leave it on All.
Step 5: Verdict Logic... The Decision Tree
With all the above data collected, the verdict is calculated in a strict priority order:
- Squat check first... if volume is 2x+ average AND range is less than half the 20-bar ATR, it is a Squat regardless of anything else
- Stop Hunt... if Climax Bear spiked above a key level and closed back below (or vice versa), it is a Stop Hunt
- Accumulation/Distribution... if Climax or Rising volume appeared but price is on the wrong side of a key level (below it for bull climax = building below resistance = ACCUM)
- Scout Long/Short (Trend Mode)... if trend matches + Dragon touch + Climax at round level + Dragon not flat.
- Scout Long/Short (Retracement Mode)... fires counter-trend signals when price is far (2x ATR) from the Dragon and a Climax candle suggests a snap-back.
- Full Setup upgrade... if M1 volume check is enabled and M1 also confirms the direction, the Scout upgrades to FULL SETUP.
- Run Exhaustion... if price is more than 2x ATR away from Dragon AND a Climax appears.
- Climax Run... if price is beyond the configured ATR distance and a Climax appears (less extreme than exhaustion)
Step 6: 89 EMA Momentum and the Divergence Warning
The 89 EMA slope measures momentum independently of the trend. When macro trend and 89 EMA slope point in opposite directions, the Row 5 background changes to Dark Slate Gray as a divergence warning (recommending observation or reduced size).
Step 7: Wave Pattern Check
The Wave Pattern Check verifies structural validation on the last two bars (Higher Low for longs, Lower High for shorts) to ensure you aren't entering a correction prematurely.
Step 8: Untested Magnet Check
At the start of each calculation cycle, the scanner reads the previous Daily and Weekly high/low to determine whether they are untested magnets or have been touched (tested) by the current period's range.

How to Use the Scanner Effectively
Basic Workflow
- Load the scanner on any chart and configure your pairs and timeframes in the scanner panel inputs
- Let the scanner run. Watch for cells that change background color away from neutral
- When a READY (L), READY (S), or FULL SETUP label appears, open that specific chart
- Confirm the structure visually: is the Dragon clearly sloping? Is the pullback clean or choppy?
- Check Row 5... is the session active (LON or NY)? Is the Wave showing HL for longs or LH for shorts?
- Check Row 6... are there untested magnets close by that could act as obstacles or targets?
- Place your trade with stops and targets as described below
Stop Placement
The cleanest stop placement for a READY (L) trade is just below the Dragon at the time of entry, or below the most recent Higher Low structure. For READY (S), it is just above the Dragon or above the most recent Lower High. A reasonable rule of thumb is to add a small buffer of 5–15 pips beyond the Dragon to avoid getting stopped out by noise.
If Row 6 is showing an untested D1 low near your entry zone, consider placing the stop below that level... because that low is a potential target for MMs to hunt before reversing. Placing your stop above the magnet means you survive the sweep; below it means you get taken out before the move happens.
IMPORTANT: Stop Rule of Thumb: For standard READY signals, stop goes just below the Dragon + 10 pips buffer. For FULL SETUP signals, the M1 confirmation means you can often use a tighter stop because the entry timing is more precise.
Target Setting
The most natural targets in this system are the untested magnets in Row 6... if you are long and the previous Daily high is untested, that is your first target. The next whole round number above your entry is also a standard target. When a SQUAT signal appears near a target, it often means absorption is happening there and price may stall... consider booking profits.
Row 3 shows the Anchor Candle... the open of the most recent significant Climax candle that triggered the current PVA state. If price later returns to the open of that anchor candle, MMs frequently reload positions there, making it a high-probability bounce zone. Use the "Distance to Anchor" reading in Row 3 to anticipate where these reloads may occur and pre-set limit orders or alerts accordingly.
Session Discipline
The scanner flags active sessions in Row 5 as ON. Signals that appear during OFF hours have historically lower follow-through. You can still observe them but treat them as lower confidence. The best signals are those that appear shortly after your configured session start, when volume begins to build.
The TVT20 Method... What READY Is Automating
The scanner automates the TVT20 (Trend Validated Trade for 20 pips) method. It confirms: trend direction (Dragon EMA vs 200 EMA), validation (high volume Climax at key round numbers), and entry timing (waiting for a confirmed Dragon touch). Signals are filtered out when the Dragon slope is flat.
Cheat Sheet... Quick Reference
Best Timeframes by Trading Style
| Style | Primary TF | Context TF | What to Look For |
|---|---|---|---|
| Scalping | M5 / M15 | H1 | READY or FULL SETUP during LON/NY overlap. Wave HL/LH confirmed. Tight stops at Dragon. |
| Intraday | M15 / H1 | H4 | READY during session open. Untested D1 magnet as target. SQUAT at target for exit. |
| Swing | H4 / Daily | Weekly | ACCUM on H4 building, then READY on H4. Untested W1 as target. 89 EMA slope positive. |
| Position | Daily / Weekly | Monthly | ACCUM on Daily turning to READY. 200 EMA slope trending. Long-horizon magnets as targets. |
Signal Priority Ranking (Best to Worst)
| Priority | Signal | Notes |
|---|---|---|
| 1 (Highest) | FULL SETUP (L) / FULL SETUP (S) | All conditions + M1 volume confirmation |
| 2 | STP HUNT B / STP HUNT S during active session | MM trap with volume at key level |
| 3 | READY (L) / READY (S) with HL/LH Wave confirmed | Classic Sonic R. entry |
| 4 | READY with Wave but in ASI session | Lower volume... wider stops or skip |
| 5 | ACCUM / DIST | Early warning... wait for READY to follow |
| 6 | SQUAT | Absorption... look for direction after |
| 7 | CLMX RUN | Can trade with tight trailing stop only |
| 8 (Lowest) | RUN (Exit) | Exit existing positions, avoid new entries |
Filters to Never Ignore
- If Row 5 background is dark slate gray (momentum divergence)... either skip or reduce position size by half
- If Row 5 shows ASI session... treat any signal as provisional until LON/NY opens
- If Row 2 shows the Dragon crossed the 200 EMA only very recently (small number of bars ago)... the trend is fresh and potentially unstable; use tighter position sizing
- If Row 3 shows the anchor candle distance is already very large (many pips from the PVA open)... the setup may be stale
Settings Explained
Scanner Settings
| Setting | Default | What It Does |
|---|---|---|
| Refresh After Ticks | 100 | How many ticks between full recalculations. Lower = more CPU usage. Set to 0 to update on every tick (not recommended for many pairs). |
| Maximum Past Bars | 1000 | How far back the scanner looks when searching for the last EMA cross, PVA signal, etc. Higher values are more accurate but slower on first load. |
| Shift Bars | 0 | 0 = analyze the current forming bar. 1 = analyze the last completed bar. Setting to 1 avoids repainting on signals. |
| Scanner Mode | Trend | Trend mode fires READY signals when price pulls back to the Dragon with the trend. Retracement mode fires signals when price is far from the Dragon... useful for counter-trend setups. |
Volume Settings
| Setting | Default | What It Does |
|---|---|---|
| PVA Average Bars | 10 | How many bars back to compute the average volume baseline. Increase for a smoother baseline on higher timeframes. |
| Rising Vol x (vs Average) | 1.5x | Volume must exceed the baseline by this factor to be classed as Rising. Lower it if you want to see more Rising signals. |
| Climax Vol x (vs Average) | 2.0x | Volume must exceed baseline by this factor (or Value2 must be highest in 10 bars) to be classed as Climax. This is the key threshold for Scout and Stop Hunt detection. |
S&R Settings
| Setting | Default | What It Does |
|---|---|---|
| SR Level Priority | All | Which round levels count: Whole only (.00), Whole + Half (.00/.50), or All (adds .25/.75). Start with All; narrow to Whole Only if you get too many signals. |
| Stop Hunt Buffer | 10 pips | How many pips beyond a level the wick must have spiked before the scanner counts it as a Stop Hunt. |
| Level Proximity (pips) | 10 pips | How close price must be to a round level for the scanner to consider it "at" the level. Wider = more signals; narrower = stricter entries. |
Setup Settings
| Setting | Default | What It Does |
|---|---|---|
| Price-Dragon Max Dist (ATR) | 2.0 | How far from the Dragon (in units of ATR) price must be before the scanner classes a Climax as a Run rather than a Scout. Increase to allow scouts at wider pullbacks. |
| Min Climax Density | 3 bars | Used internally for context checks. The minimum number of Climax bars in a lookback window before certain conditions register as a dense activity zone. |
EMA Settings
| Setting | Default | What It Does |
|---|---|---|
| Price/Dragon Cross Type | High/Low | Whether the Price-Dragon cross is detected using High and Low (wick touches Dragon) or Open/Close only (body must cross Dragon). High/Low is more sensitive. |
| Dragon EMA Period | 50 | The period of the Dragon moving average. In the Sonic R. system this is typically 34 EMA of median. You can adjust to match your preferred system. |
| Dragon MA Type | EMA | Smoothing method for the Dragon. EMA is the standard. SMA gives a slower, less reactive Dragon. |
| Dragon Applied Price | Typical (HLC/3) | Which price is used to compute the Dragon. Typical price (High+Low+Close / 3) reduces wick noise. |
| Trend EMA Period | 200 | The macro trend filter. 200 is the standard institutional reference. Do not change unless you have a specific reason. |
Slope Settings
| Setting | Default | What It Does |
|---|---|---|
| Use Dragon Slope Check | On | When on, the scanner ignores Scout signals when the Dragon is flat. This is one of the most important filters... keep it on. |
| Slope Check Bars | 3 | How many bars back to compare for slope. Fewer bars = more reactive slope detection. |
| Min Dragon Slope | 0.5 | The minimum average slope in pips per bar before the Dragon is considered directional. Raise this on noisy pairs (like JPY crosses); lower it on slow-moving ones. |
Sonic R. System Settings
| Setting | Default | What It Does |
|---|---|---|
| Use Sonic R. Features | On | Master switch. Turns on Rows 5 and 6 in the dashboard. Turn off to revert to the simpler 4-row layout. |
| Check L-H-HL Classic Wave | On | Enables the wave structure check. When on, Row 5 shows HL/LH/NoWave and the text is color-coded by trend alignment. |
| Identify Untested SR Magnets | On | Enables Row 6 magnet tracking. Gold color for untested levels, silver for fully tested. |
| Use Session Filter | On | Enables the ON/OFF session label and background color changes in Row 5. |
| Session Start Hour | 10:00 | The time (Broker Time) when the active trading session begins. Supports HH:MM format. |
| Session End Hour | 00:00 | The time (Broker Time) when the active trading session ends. Supports HH:MM format and overnight sessions. |
| Use EMA 89 Momentum Filter | On | Enables the M: +X.X momentum display and the dark-gray warning background when momentum diverges from trend. |
| Cross-TF Volume Alignment | Off | When enabled, the scanner checks M1 volume to upgrade Scouts to FULL SETUP. Enable this when you want the highest-precision entries only. |
Alert Settings
| Setting | Default | What It Does |
|---|---|---|
| Use Alerts | On | Master alert switch. Turn off to silence all notifications. |
| Alert on Squat | On | Alert when absorption (Squat) is detected. |
| Alert on Scout | On | Alert when READY (L) or READY (S) appears. |
| Alert on Climax Run | On | Alert when CLMX RUN appears... price is running with volume. |
| Alert on Stop Hunt | On | Alert when STP HUNT is detected at a level. |
| Alert on Exhaustion | On | Alert when RUN (Exit) appears. |
| Alert on Accum/Dist | Off | Alert when ACCUM or DIST appears. Off by default to reduce noise... these are early-stage signals and fire frequently. |
| Alert on Highlight | Off | Alert specifically when the cell background is newly highlighted by a Price-Dragon Cross. Only triggers once on the active shift bar. Useful if you want alerts purely for Price-Dragon crosses while keeping other setup signals disabled. |
| Ignore WAIT/NONE Alerts | On | Suppresses alerts when there is no actionable signal. Keep on to avoid constant noise. |
| Alert when Price enters Zone | Off | Alert when a candle opens outside a Gann zone and closes inside it. Off by default as these fire frequently. |
| Alert when Price leaves Zone | On | Alert when a candle opens inside a Gann zone and closes outside it (bounce). Identifies reversals from zone boundaries. |
| Alert when Price breaks Zone | On | Alert when a candle opens within a Gann zone and closes cleanly through the outer boundary. The primary breakout alert. |
Understanding the Color System
The scanner uses color at three levels... the cell background, the arrow icon in each row, and the text itself. Each can be fully customized through the Color Settings section. Here is the default logic:
| Element | Color | Meaning |
|---|---|---|
| Arrow... Bull/Long signals | Lawn Green | Direction is bullish, entry interest is up |
| Arrow... Bear/Short signals | Light Salmon | Direction is bearish, entry interest is down |
| Arrow... Accumulation | Gold | Smart money building positions... watch for reversal |
| Arrow... Distribution | Magenta | Smart money distributing... watch for reversal |
| Arrow... Climax Run | Orange | Extended move... caution on new entries |
| Arrow... Rising Bull Volume | Deep Sky Blue | Buying momentum increasing |
| Arrow... Rising Bear Volume | Pale Violet Red | Selling momentum increasing |
| Text... Warning | Orange | Price near a level or signal is borderline |
| Text... Neutral/No Data | Gray | No significant activity detected |
| FULL SETUP (L) | Lawn Green (Arrow Bullish color) | Highest conviction long... same color as all bullish arrows |
| FULL SETUP (S) | Light Salmon (Arrow Bearish color) | Highest conviction short... same color as all bearish arrows |
| STP HUNT B / STP HUNT S | Orange (Warning color) | Stop hunt detected at a key level... same color as warning text |
| Dragon Slope (Strong) | Lawn Green / Light Salmon | High-conviction Dragon slope uses Bullish/Bearish arrow color for visual emphasis |
| Magnet Row... Untested | Gold | Active price target exists at D1 or W1 level |
| Magnet Row... All Tested | Silver | No pending magnet levels to worry about |
CUSTOMIZATION TIP: If you trade on a white background chart, the default dark background colors may look off. You can adjust all BG colors in the Color Settings group. Try light pastels for the Scout colors and keep the FULL SETUP colors bright regardless of theme.
Gann Zone Sweep System
The Gann Zone Sweep System is an optional overlay that maps the live price of any pair onto a percentage-based range derived from recent historical weekly bars. It tells you exactly where price is sitting within the week's historical sweep structure, which is one of the most powerful tools for anticipating institutional reversals and breakout entries.
What It Does
The scanner takes the High and Low of the last N weekly bars (configured via Range Lookback) and divides that range into user-defined percentage zones. Any zone you define... whether classic Gann octaves like 0-12.5% and 87.5-100%, Fibonacci zones like 50-61.8%, or entirely custom boundaries... is tracked in real time against the current live price.
The result is a live contextual label that appears in the dashboard for each pair, telling you whether price is:
- In Zone: Price is currently sitting inside the defined percentage band. This is the area where MMs historically build or unload positions before a sweep.
- Above Zone / Below Zone: Price has already moved outside the zone boundaries. If above an upper zone, the zone acted as a launchpad. If below a lower zone, the zone provided no support.
- Bounce: The analyzed candle opened inside the zone but closed outside it... or vice versa. This marks a real-time rejection or sweep-and-recover at a zone boundary.
Why This Matters
Gann sweep zones identify the percentage levels where market makers are most likely to run stops and reverse. The classic 12.5% (1/8) and 87.5% (7/8) levels represent the outer octaves of the weekly range. Institutional positioning studies consistently show that price swept into these outer octaves on the same week tends to reverse sharply... because MMs use those sweeps to collect stop liquidity before pushing in the opposite direction.
When the scanner shows In Zone 1 (the lower zone, e.g., 0-12.5%) and the PVSRA signal shows STP HUNT B or ACCUM on the same pair and timeframe, you have a multi-layer confluence: the weekly structure says price is in a sweep zone, and the volume says MMs are actively buying. That is one of the most powerful setups the system can identify.
How to Configure It
| Setting | Default | What It Does |
|---|---|---|
| Enable Gann Zone System | On | Master switch. Enables the Gann zone overlay on the dashboard. Turn off to hide all zone labels. |
| Anchor Timeframe for Range | W1 (Weekly) | The timeframe used to calculate the historical high/low range. Weekly is the standard for Gann sweep analysis. You can change to D1 for intraday zone tracking. |
| Range Lookback | 2 | How many bars back (from the bar before the current analyzed bar) to measure the range. A value of 2 takes the High and Low across the previous 2 completed weekly bars. Increase to get a wider, longer-term range. |
| Zone Boundaries (min-max, min-max) | 0-12.5, 87.5-100 | Comma-separated list of percentage zones to track. Each zone is defined as min-max. You can add as many as needed. Example: "0-12.5, 50-61.8, 87.5-100" tracks the lower octave, the Fibonacci midzone, and the upper octave simultaneously. |
| Extend Zones on Breakout | Off | When on, if the current weekly bar breaks outside the historical range, the range dynamically expands to include the live bar's extreme. This prevents stale zone labels when price makes new weekly highs or lows. Off by default to keep the range stable for alerts. |
| Hide Zone Boundary In Labels | Off | When on, hides the second label row showing the percentage boundary (e.g. "(87.5)") below the zone status label. Use this to reduce dashboard clutter when monitoring many zones simultaneously. |
Zone Configuration Examples
Classic Gann Octave Zones (Default):
0-12.5, 87.5-100
Tracks only the outer 1/8 sweep zones. Price entering the bottom 12.5% of the weekly range is a potential bullish sweep zone. Price entering the top 12.5% is a potential bearish sweep zone.
Full Gann Octave Map:
0-12.5, 12.5-25, 25-37.5, 37.5-50, 50-62.5, 62.5-75, 75-87.5, 87.5-100
Tracks all eight Gann octave zones. Most useful for position traders who want to know exactly which eighth of the weekly range price is occupying at all times.
Fibonacci Midzone + Outer Octaves:
0-12.5, 50-61.8, 87.5-100
Adds a Fibonacci zone at the midpoint of the range. Price hesitating at 50-61.8% after a strong move often signals a reload opportunity before continuation.
Reading the Dashboard Gann Labels
| Label | What It Means | Trading Implication |
|---|---|---|
| In Zone1 (0-12.5) | Live price is inside Zone 1 boundaries (e.g. 0-12.5%) | Watch for a reversal signal. Combine with STP HUNT B or ACCUM for highest conviction. |
| Above Zone1 (12.5) | Price has broken above the outer boundary of Zone 1 | Zone has been breached. Watch for alert if breakout alert is enabled. |
| Below Zone1 (0) | Price has dropped below the lower boundary of Zone 1 | Potential sweep zone reached. Watch for bullish reversal confirmation. |
| Bounce1 (12.5) | Price was inside zone then closed back outside it, or vice versa, at the 12.5% boundary | Real-time rejection at a zone boundary. Strong reversal signal especially combined with volume confirmation. |
Combining Gann Zones With PVSRA Signals
The Gann zone system is most powerful when used as a filter for PVSRA signals rather than a standalone trigger. Here is how to combine them:
- Zone + ACCUM/STP HUNT: Price is in the lower sweep zone (0-12.5%) AND ACCUM or STP HUNT B appears on the same pair. This means price is at a historically important weekly level AND volume confirms MM buying. Very high conviction long setup.
- Zone + Bounce + READY: A Bounce label appears in the zone on the weekly timeframe AND a READY (L) appears on H1 or H4 at the same time. The weekly structure is rejecting price from the sweep zone AND the intraday trend confirms. This is a multi-timeframe confluence trade.
- Zone + Breakout Alert: Enable the breakout alert and you will be notified the moment a higher timeframe candle closes outside the zone boundary. Use this to catch the beginning of new weekly moves before they develop on lower timeframes.
TIP: The default setting of Range Lookback = 2 uses the last 2 completed weekly bars. This means the zone is always anchored to confirmed historical structure. If the current week is trending strongly, the range will only expand to include it if Extend Zones on Breakout is enabled. Keeping it off prevents the zone boundaries from moving while you are already in a trade.
You might get a lot of Alerts especially if ShiftBars is 0, as price will go inside a zone and come back out and so on. Which is why it is set to only 1 alert per bar for an entry/exit etc.
Also, alerts for different timeframes need to be separate, as lower timeframes will go in and out of a zone over several bars, but higher timeframes will still show it as one continuous bar.
Sometimes if a bar is too strong, then it will cross a level over multiple timeframes simultaneously:

Retracement Mode vs Trend Mode
The default Trend Mode only generates Scout signals when price is at the Dragon. This is the Sonic R. classic approach... pull back to the Dragon in an established trend.
Retracement Mode is for counter-trend or deep-pullback traders. In this mode, the scanner looks for price that has moved far from the Dragon (beyond the configured ATR distance) and is showing a Climax volume candle in the opposite direction of the macro trend. The idea is that after a long bull run, a very deep pullback with a Bear Climax might signal a counter-trend short that lasts long enough to be profitable before the bull trend resumes.
WARNING: Retracement Mode generates riskier signals. Always use tighter position sizing in this mode. The macro trend is against you, and these setups should only be considered when the volume signal is exceptionally strong (intensity above 3x) and you are near a major S&R level.


