
MQL5 Blogs : https://www.mql5.com/en/blogs/post/768823
MT4 Version : https://www.mql5.com/en/market/product/171247
MT5 Version : https://www.mql5.com/en/market/product/171248


Professional Fibonacci Projection Dashboard with Swing Structure, POC, Delta Bands, and Symbol Changer
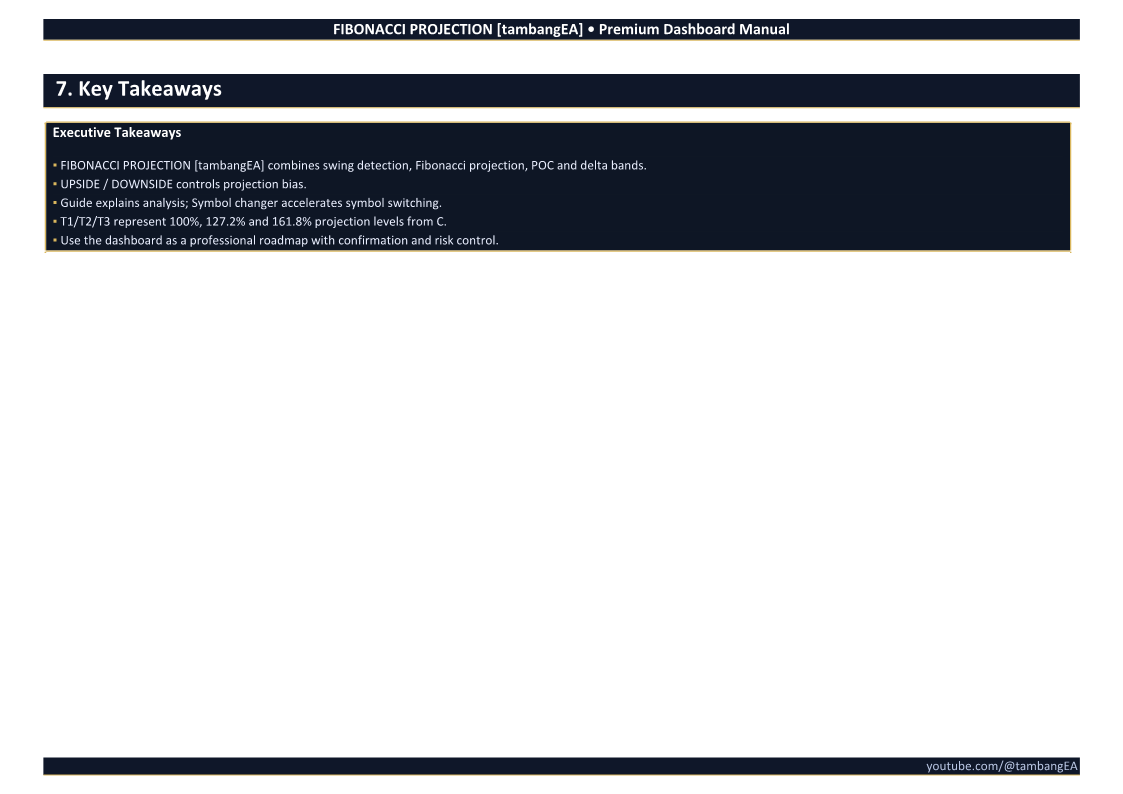
FIBONACCI PROJECTION [tambangEA] is a professional dashboard-based trading analysis tool designed to help traders identify market structure, Fibonacci projection targets, volume reaction zones, and directional continuation areas directly on the chart.
The tool automatically detects the latest swing structure, builds Fibonacci-based projection levels, highlights the Point of Control area, and displays delta information across Fibonacci bands. It is designed for traders who want a clean, structured, and visual way to read market movement without manually drawing every Fibonacci projection.
Why This Tool Was Created
Many traders use Fibonacci levels manually, but manual projection can be slow, inconsistent, and subjective.
This tool helps simplify the process by automatically displaying:
- the latest swing structure
- Fibonacci retracement and projection levels
- C point projection from the 0.618 area
- T1, T2, and T3 target zones
- POC and volume profile area
- delta strength by Fibonacci band
- bullish or bearish projection direction
- a compact premium dashboard
The goal is to provide a clearer market roadmap, not to replace trader judgment.
Main Features
Automatic Swing Detection
The indicator detects the latest valid swing high and swing low within the selected period. This swing becomes the foundation for the Fibonacci projection structure.
Fibonacci Projection Targets
The dashboard displays projected target levels:
- T1 – 100%
- T2 – 127.2%
- T3 – 161.8%
These levels help traders identify possible continuation targets and reaction zones.
C Point Projection
The tool uses the C point, commonly based around the 0.618 Fibonacci retracement area, as the projection base for future targets.
POC and Volume Profile Area
The system identifies the approximate Point of Control, which represents the price row with the highest total volume inside the detected swing range.
This helps traders understand where market participation was concentrated.
Delta Band Analysis
Delta information is calculated across Fibonacci bands to help identify where buy or sell pressure may be stronger.
The dashboard highlights the strongest delta band so traders can quickly see whether the market reaction supports the current projection direction.
UPSIDE / DOWNSIDE Mode
The dashboard displays directional bias clearly:
- UPSIDE for bullish continuation projection
- DOWNSIDE for bearish continuation projection
This makes the chart easier to interpret at a glance.
Symbol Changer Panel
The built-in Symbol Changer tab allows quick switching between common trading instruments directly from the dashboard.
Supported quick-access symbols include:
- EURUSD
- GBPUSD
- USDJPY
- XAUUSD
- US30
- US100
- BTCUSD
- ETHUSD
The tool also attempts to detect broker prefix and suffix when possible.
Premium Dashboard Design
The dashboard includes a clean and professional visual layout with:
- Guide tab
- Symbol changer tab
- projection status
- theme selector
- drag panel control
- compact target information
- explanation of the logic directly on the chart
How It Works
The tool follows this analytical process:
- Detects the latest swing high and swing low inside the selected period.
- Builds Fibonacci retracement levels from the detected swing.
- Defines the C point around the selected Fibonacci retracement level.
- Projects future target levels using 1.000, 1.272, and 1.618 ratios.
- Distributes volume across price rows and Fibonacci bands.
- Identifies the approximate POC inside the swing range.
- Calculates delta strength inside each Fibonacci band.
- Displays the strongest delta band and target zones on the dashboard.
Dashboard Tabs
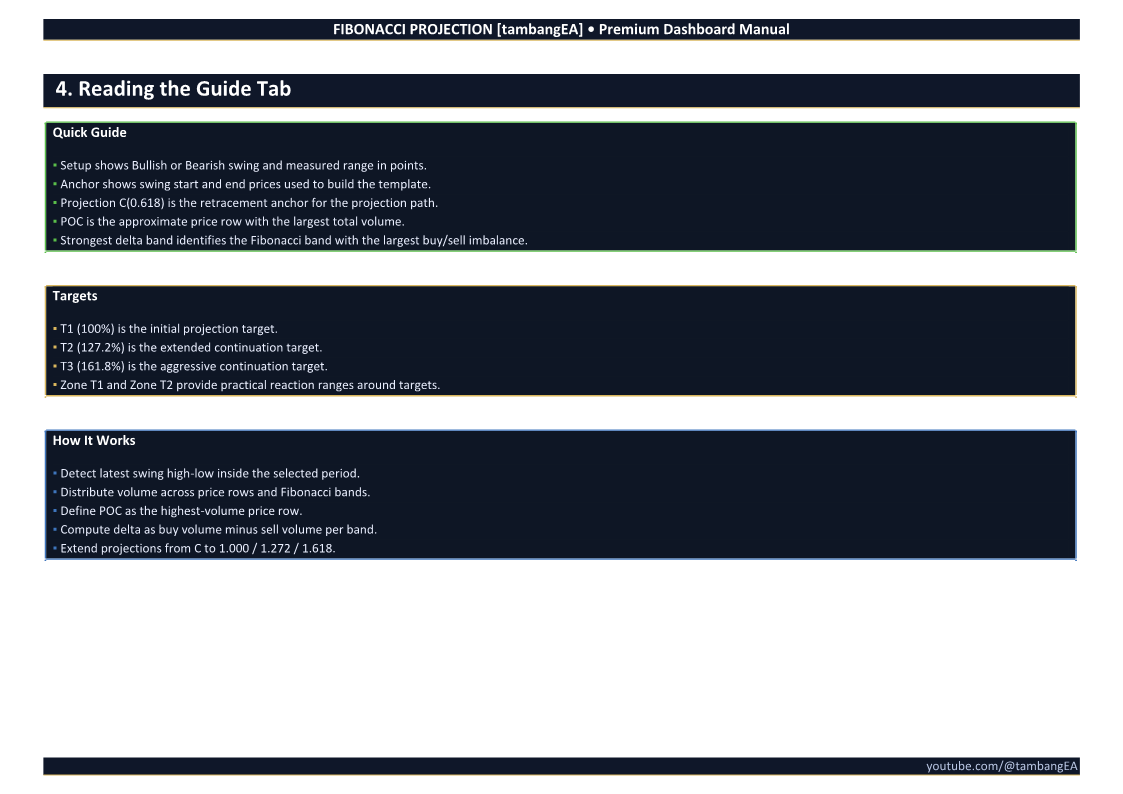
Guide Tab
The Guide tab explains the current analysis, including:
- swing direction
- swing range
- anchor prices
- projection C level
- POC level
- strongest delta band
- target levels
- how the calculation works
This tab is useful for understanding why the current projection is being displayed.
Symbol Changer Tab
The Symbol Changer tab allows fast chart switching using symbol chips. This helps traders quickly scan multiple instruments without manually changing the symbol from Market Watch.
Who Can Use This Tool
This indicator is suitable for:
- Fibonacci traders
- price action traders
- swing traders
- intraday traders
- gold traders
- index traders
- crypto traders
- traders who prefer visual dashboards
- traders who want a structured projection roadmap
It can be used on forex, metals, indices, crypto, and other supported broker symbols.
Recommended Usage
Use this tool as a visual projection and confirmation dashboard.
A practical workflow:
- Select the chart and timeframe.
- Review the detected swing direction.
- Check whether the projection is UPSIDE or DOWNSIDE.
- Review the C point and Fibonacci projection targets.
- Check the POC and strongest delta band.
- Confirm the setup with your own price action strategy.
- Use proper risk management before entering any trade.
Important Notes
This tool does not guarantee that price will reach any projected target. Fibonacci projection levels are analytical reference zones, not fixed trade signals.
Market conditions, news events, volatility, liquidity, spread, and broker execution can affect trading results.
Always combine the indicator with your own trading plan and risk management rules.
Key Benefits
- Saves time compared to manual Fibonacci drawing
- Provides a structured projection roadmap
- Helps identify potential target zones
- Displays POC and delta reaction areas
- Includes a clean dashboard for faster interpretation
- Supports quick symbol switching
- Suitable for multiple markets and timeframes
- Designed with a premium visual style
Disclaimer
Trading forex, CFDs, indices, metals, and cryptocurrencies involves significant risk. This product is an analytical tool and does not provide financial advice, investment advice, or guaranteed trading signals.
Past performance, historical projection behavior, or visual analysis does not guarantee future results. Users are responsible for their own trading decisions, risk management, and account protection.
Always test the tool on a demo account before using it on a live account.


")

