
Instructions and description of the AW Candle Patterns indicator

The AW Candle Patterns indicator is a versatile technical analysis tool that combines trend filtering and automatic detection of single-, double- and triple-candle candlestick patterns. Its flexible settings allow you to adapt the display of signals to any trading strategy.
Useful links:
AW_Candle_Patterns_MT4 Free Demo - Here
AW_Candle_Patterns_MT5 Free Demo - Here
💡 Recommendations for use
- Timeframes: Works best from M15 and above.
- Instruments: Can be applied to currency pairs, stocks, indices, cryptocurrency.
- Testing: Before using on a real account, it is recommended to test the indicator on history and in demo mode.
📦 A convenient tool that allows you to:
• Work without deep knowledge of candlestick analysis - patterns are determined automatically.
• Quickly identify reliable candlestick signals.
• Work both with and against the trend.
• Use the tool for trading both intraday and medium-term.
• Reduce false signals using filtering.
• Suitable for both beginners and experienced traders to create their own trading systems.
• Suitable for both manual trading and as part of semi-automated strategies.
⚙️ Basic functions and settings
- Pattern Display: User can select which types of 30 patterns to display and which to hide.
- Filtering by trend: the indicator can display only those patterns that correspond to the direction of movement, or, on the contrary, those that work against the trend.
- Adjustable signal severity. An adjustable period is built into the trend display to adjust the severity of the signals.
- Filtering by number of candles. The trader can set the type of patterns to be displayed, for example, only one-candle, two-candle or three-candle patterns.
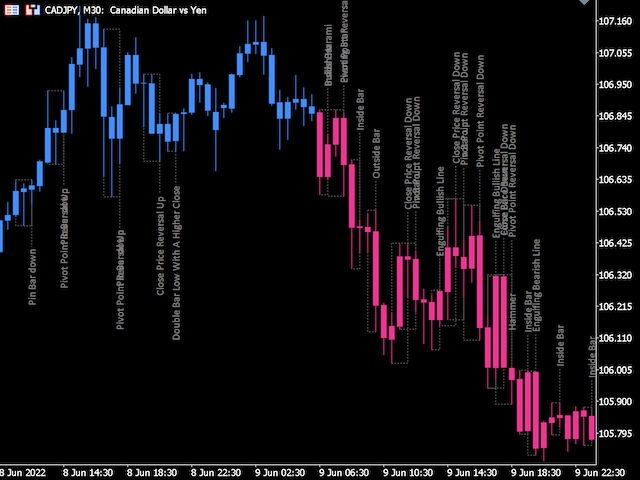
- Visual cues: Each pattern is assigned a label on the chart.
Functional
🔧 1. Trend Filtering Mode
One of the key parameters of the indicator is filtering signals depending on the direction of the current trend. This helps to filter out weak or contradictory signals.
• Pattern by trend – only signals that match the current trend are displayed. Ideal for working in the direction of movement.
• Patterns against trend – only signals against the trend are displayed. Suitable for trading on reversals.
• Do not check trend - all patterns are displayed without taking into account the trend. Used for more aggressive or manual strategies.
🔁 Trend Filter period — allows you to adjust the “depth” of trend analysis.
• Smaller values (eg 3) are more sensitive to changes.
• Large values (20+) smooth out the trend, making it more stable.
It is useful to select according to the time frame: the higher the TF, the longer the period can be.
⸻
🕯️ 2. Managing Pattern Types
The indicator allows you to flexibly configure which types of candlestick patterns will be displayed:
• Show one candle patterns — enable/disable one-candle patterns (e.g. Hammer, Doji).
• Enable two candles patterns — display two-candle patterns (for example, Engulfing, Harami).
• Enable three candle patterns – enable three-candle patterns (for example, Morning Star, Dark Cloud Cover).
This setting allows the trader to focus, for example, only on the more reliable three-candle signals or, conversely, on fast one-candle entries.
⸻
📏 3. Calculation and performance
• Max Bars — determines on which section of the chart to look for signals. Increasing the value gives a more complete picture, but may slow down the work on weak PCs.
⸻
🎨 4. Visual settings and convenience
The indicator is equipped with a customizable graphical panel, which makes its use intuitive and visual.
Panel:
• ShowPanel:
• Do not show panel – hide the panel, only visual signals on the chart.
• Show medium panel – compact panel.
• Show big panel — extended panel with information (for large screens).
Customize the appearance:
• Font size in panel—text size in the panel.
• Y offset / X offset — the vertical and horizontal position of the panel.
• Uptrend Color Panel / Downtrend Color Panel — panel background colors depending on the trend direction.
Display patterns:
• Show Pattern text – enable/disable pattern labels directly on the chart.
• Font size / Font name - text size and style.
• Patterns text color — color of the pattern name text.
These parameters allow you to tailor the display to your individual trading style and preferences.
Examples of application in trade
📍 1. Entry in the direction of the trend
• Trend filtering is enabled. Enable Pattern by trend. Set Trend Filter period.
• Use trend confirmation patterns (eg Bullish Engulfing, Force Bar Up) The Bullish Engulfing pattern appears on an uptrend.
• The trader enters a long position after the signal candle closes. Open positions in the direction of the main movement after the signal candle.
• Stop loss – below the minimum of the signal candle.
• Take profit – at the level of the nearest resistance or at a ratio of 2:1.
📍 2. Reversal at a key level
• Activate Patterns against trend and enable display of 2-3 candlestick patterns (Shooting Star, Dark Cloud Cover, Morning Doji Star.)
• Look for signals near support/resistance levels, resistance level on H1.
• The indicator recognizes, for example, Shooting Star or Evening Star at this level.
• The trader opens a short position with a short stop and fixed profit.
📍 3. Combined strategy
• Used with another indicator (eg RSI or MACD).
• The indicator shows Force Bar Up against the background of RSI divergence - this increases the probability of a reversal.
• The trader opens a trade with confirmation from both sources.
📍 4. Multi-screen trading
• Set up Show panel on the monitor.
• Activate text suggestions and filtering.
• Visually monitor the market for multiple symbols at the same time.
Buy the indicator now:
AW_Candle_Patterns_MT4 👉 Here
AW_Candle_Patterns_MT5 👉 Here
Description of candlestick patterns:
1. 🔨 Hammer Pattern:
One-candlestick bullish reversal pattern.
Hammer appears after a pronounced downward movement. It indicates a potential stop of the decline and a reversal upward. Appearance at an important support level. High volume during the formation of the candle.
2.📍Pin Up / Pin Down
A single candlestick pattern with a long wick and a short body.
A pin bar is formed as a result of a sharp rejection of a certain level by the price.
- Pin Up often appears at the bottom of a trend, indicating a buyout and a possible upward reversal.
- Pin Down is formed at the top of growth and signals a possible downward reversal.
- Pin Up - a bullish signal after a fall.
- Pin Down is a bearish signal after growth.
3. ⚖️ Bearish Harami / Bullish Harami
Two-candle reversal pattern. The pattern indicates a slowdown in the current trend and a possible reversal
- Bullish Harami - a small bullish candle inside a large bearish one - a reversal signal upwards, a bullish signal, appears after a downtrend.
- Bearish Harami - a small bearish candle inside a large bullish one - a downward signal, a bearish signal, appears after an uptrend.
4. ❎ Bearish Harami Cross / Bullish Harami Cross
Like Harami, but the second candle is a doji, reinforcing the reversal signal.
5. 🔄 Pivot Point Reversal Up/Down
Reversal, three-candle. This is a classic price reversal based on identifying a local minimum or maximum, after which the market can change direction.
- Up — a series of candles where the minimum is not updated and a breakout upwards occurs, a signal of a possible upward reversal (bullish).
- Down — the maximum is not updated and a downward breakout is a downward reversal signal (bearish).
6.🟫 Double Bar Low With A Higher Close / Lower Close
Reversal, three-candle, with elements of a repeated test of the level and a confirmation signal through closing.
- Higher Close - two lows at the same level, but the second candle closes higher - an upward signal.
- Lower Close — similar, but the second candle closes lower — signal down.
(Double Bottom/Top with Close Confirmation)
7. 🔚 Close Price Reversal Up / Down
Reversal, two-candle.
- Up — the candle closes higher after the previous decline — a possible upward reversal, a bullish signal.
- Down - closing lower after growth - downward reversal, bearish signal.
This pattern is built on the principle of taking over the initiative through the closing price, without pronounced shadows or bodies, as in other candlestick patterns. The main focus is on the change in the direction of the candlestick closing, indicating a change in market sentiment.
8. ⏸️ Neutral Bar / Two Neutral Bars
A pattern of uncertainty and possible preparation for a reversal or impulse.
- Neutral Bar - a single candle.
- Two Neutral Bars - two consecutive neutral candles that strengthen the signal.
The appearance of a neutral candle (or two) indicates a state of market equilibrium, when neither bulls nor bears dominate. This often happens: at reversal points, during consolidation, before a level breakout.
9. 🧩Double Inside / Inside / Outside Bar
Two- candle pattern.
- Inside Bar - a candle completely inside the previous one - volatility compression.
- Double Inside - two in a row inside the previous ones - strong compression.
- Outside Bar - the current candle absorbs the previous one - impulse signal.
10. 💪 Force Bar Up/Down
Trendy single candlestick pattern. Candles with a strong body and direction:
- Up — a powerful bullish candle, possible continuation of growth.
- Down — a strong bearish candle, possible continuation of the decline.
Impulse, signaling a sharp increase in pressure from buyers or sellers. Can serve as the beginning of a strong movement or confirmation of the current trend.
11. ⭐️ Evening Star / Morning Star
Three-candle reversal pattern.
- Morning Star - reversal up after a fall (bullish) .
- Evening Star - reversal down after growth (bearish) .
12. ✨ Evening Doji Star / Morning Doji Star
A “star” variation, where the second candle is a doji, reinforcing the reversal.
A three-candle reversal pattern, with special emphasis on the second candle - doji (a candle with a very small body, reflecting market indecision).
- Evening Doji Star - a downward reversal is formed.
- Morning Doji Star - reversal upward.
13. 🐍 Engulfing Bearish Line/Bullish Line
A reversal two-candlestick pattern signaling a change in market sentiment
- Bullish — a bullish candle engulfs the body of the previous bearish one — a reversal upwards. A strong signal to enter long positions.
- Bearish - bearish engulfs bullish - downward reversal. Strong signal to open short positions.
14. 🪞 Mirror Bar
A reversal pattern indicating a possible change in price direction. The body of one candle mirrors the previous one - may indicate a change in direction.
- The candle reflects a change in market sentiment - a change in pressure from buyers to sellers or vice versa.
- May indicate a reversal or a strong reaction to a support/resistance level.
15. 🌠 Shooting Star
A single candlestick pattern, a candlestick with a long upper shadow and a small body is a sell signal after growth. A downward reversal candlestick after growth, signaling strong seller pressure.
- Often serves as a warning of a trend reversal or correction.
- Stronger if it appears near resistance levels.
16. ☁️ Dark Cloud Cover
A two-candle reversal pattern that signals a change in trend from bullish to bearish. The first candle is bullish, the second is bearish, opens with a gap up and closes below the middle of the first. A signal of strong resistance and a possible reversal down.
17 🌟 Doji Star
Two-candlestick pattern: after a strong candle, a doji appears, signaling a possible reversal.
A candle with an open and close at almost the same level, reflecting the balance between buyers and sellers
- Often appears as part of reversal or continuous patterns (for example, Morning Star, Evening Star).
- May signal a change in trend if confirmed by subsequent candles.
Buy the indicator now:
MT4 version
👉 https://www.mql5.com/en/market/product/84305
MT5 version
👉 https://www.mql5.com/en/market/product/83325

AW Trading Software
Support: https://www.mql5.com/en/users/nechaevrealle


")