: Identifying the Signs and Causes")
Avoiding Over-fitting in Trading Strategies (Part 1): Identifying the Signs and Causes

Algorithmic Trading is a familiar concept to us because of the advantages it brings. The idea of using automated trading software to replace our daily trading activities and eliminate our inherent psychological factors, sounds promising. However, building a strategy with the truly trading edge is not simple, and testing it before implementing it in real trading is also the same.
The process of backtesting and optimization a trading strategy is actually a lot harder than many traders think because backtest results can be extremely deceving especially when statistic significance is low. When this is the case, it means that random chance starts to be more dominant than the meaningful information you’re getting from your backtest.
This article will go through what I consider to be the most important aspects of this process and provide some useful tips for you to follow and investigate this fascinating subject in a lot more detail. From there, you can build an effective backtesting process to avoid overfitting with your developing system. If you are looking for a reliable expert advisor (EA) to trade on your behalf, hopefully this article can help you identify signs of an over-optimized EA, allowing you to make more effective decisions.
Link 1: Avoiding Over-fitting in Trading Strategies (Part 2): A Guide to Building Optimization Processes
Link 2: Tracking the live performance of the strategy used for research here
1. What is an Over-fitting model? How is it different from a Generalized model?
Building a trading system is essentially the process of creating a model to predict future price data, and the foundation for building that model is analyzing historical price data. To achieve this, traders or developers need to analyze historical price data to identify patterns, trends, and relationships. This analysis serves as the basis for building a model that can make accurate predictions about future price movements.
Let’s say we have a relationship between two variables and some observed values like the chart bellows:

where:
- X: represents the performance of the trading system in the past (in sample data);
- Y: represents the performance of that trading system in the future (out-of-sample data).
If we observe a value for the component along the x-axis we can predict what the value of the component on the y-axis will be.
The more generalized the model, the greater its predictive power.
In this example, there is a fairly simple linear relationship between the X and the Y values. The model is helping us to predict future values well: for each value of x, we can easily find a corresponding value of y that is close to the linear regression line. Regardless of there will be some errors here and there, the model of the linear relationship will do a pretty good job of correctly predicting future values. Therefore, the model works.
This model can be modeled algebraically as y = ax + b.
There is one important note with the model we are observing: there are just two variables in this algebraic expression ‘a’ and ‘b’.
Now let's look at an example of an overfitting model:

The second model fits the past data really well and this is also what we easy to see when observing an overfitting model.
This relationship might be modeled as an algebraical form like this: y = ax3 + bx2 + cx + d. So we have a polynomial expression with four variables that dictate the model: a,b,c and d.
This polynomial model allows us to fit to the past data much better than the linear model did but fitting to past data is not what we want our model to do, the purpose of build a model to predict future data.
In this particular case, the level of the errors for predicted values is much greater than it was with the linear mode.
In conclusion, the polynomial model does a very bad job of predicting compared to the simple and linear model.
We can easily recognise the key difference between these two modes: number of parameters.
2. What constitutes an overfitting model?
a. The large number of parametes in the optimization.
The number of parametes in your optimization determines whether your model is prone to over-fitting.
If a trading system does not perform as expected, we often tend to add additional conditions to improve the system. This could be adding a Higher Time-frame Moving Average to ensure trades are in line with the larger trend, or it could be a time condition where we realize that trades during that time period have a higher win rate. The result is that we have a better backtest result with the "upgraded" system.
This seems logical and the system is being developed in the right direction. However, it is important to ensure that the model we are building is generalized. From a statistical perspective, with the addition of these two parameters, the number of combinations of input parameters will increase exponentially. With such a large number of combinations, producing some good output results can sometimes be random.
In reality, many novice algo traders and developers tend to adjust parameters, indicators, or rules to maximize past performance, but this can lead to a lack of robustness and adaptability. If the strategy is excessively tuned to fit historical data, it is likely to perform poorly in real-world scenarios. This process is called over-optimization.
We can see how a model built with 4 input parameters easily adapts to historical data in Part 1. To avoid over-optimization, we should limit the number of input parameters to be optimized at the same time to less than 3.
If practice requires us to add more parameters to the system, this should be done carefully to avoid the situation that the trading strategy is excessively tailored to historical data. As in the previous example, if you want to add the parameter ''Higher Time-frame Moving Average'' to the strategy for optimization, the recommended steps is:
- Step 1: Build a separate substrategy just to evaluate the trading edge of the Higher Time-frame MA and backtest this strategy separately with the same historical data as the main strategy.
- Step 2: Prove the existence of trading edge of sub-strategy. As in the example it is necessary to prove: (1) the Higher Time-frame MA can be used to determine the large-frame trend effectively; and (2) in a Higher Time-frame uptrend, the price at the end of the trend is greater than the price at the beginning of the trend (the opposite applies to a downtrend);
- Step 3: Add the optimized Higher Time-frame MA parameter in the substrategy to the main strategy. This parameter does not need to be optimized in the main strategy anymore because it has been proven that the sub-strategy has an trading edge.
b. Low level of statistical significance and insufficient number of sample size
Sample size is a general statistical term for the number of events or items that are being analyzed, for the context of trading, this is the number of uncorrelated trades that from the backtest.
Large numbers of trades reduces the effects of random chance, helping the parameter values with the genuine edges to be outstanding over those that have little or no edge at all.
High sample sizes is very essential in backtesting trading strategies because the more trades the more reliable and statistically significant the backtest results will be. Statistical significance helps the trading strategies with the genuine edges to be outstanding over those that have little or no edge by reducing the effects of random chance.
Thereby, it allows us to objectively assess which strategy is likely to perform better in the future based on historical data. By considering statistical significance, we can avoid overfitting or data mining, which occur when strategies are excessively tailored to historical data and fail to perform well in real-world scenarios.
The question is how large a sample is needed to ensure a high level of statistical significance during backtesting of a trading strategy. Is it 500 trades, 1000 trades or 2000 trades?
To determine the required size of the test piece, we need to clarify two issues:
- Number of input parameters of the strategy: There’s a really important relationship between what’s called the degrees of freedome and the sample size. Putting degrees of freedom into the context of an optimization is analogous to the number of parameters that we’re simultaneously attempting to optimize, the higher degrees of freedom, the higher sample size needed during backtesting, this is why many traders who attempt to optimize too many parameters will almost certainly be struggling for producing reliable backtest results.
- The trading edge of the strategy: if the system we are developing have a very strong trading edge, it is able to show that edge very quickly and easily, this means that with only a small amount of sample size, we have reached the high level of statistical significance. However, if the trading strategy is much weaker and it doesn’t have as good edge then it will take much longer to reach the asymptote level of high statistical significance. In reality, we would never be able to get sample sizes large enough in order to have that high probability with those systems.
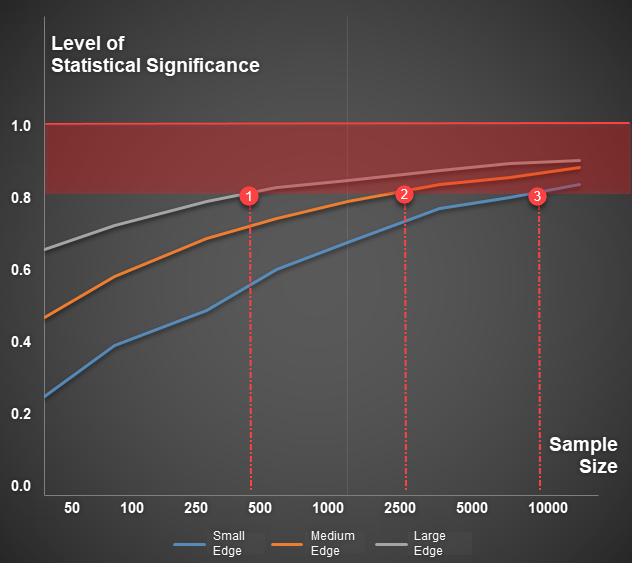
Illustrative example: To achieve a Statistical Significance level of 0.8, the trading system with a large edge requires fewer than 500 trades, the system with a medium edge requires 2500 trades, while the one with a small edge requires up to 10,000 trades.
In reality, evaluating the trading edge of a system is a very difficult task, this is why there is often no specific number for a reasonable sample size. However, if a strategy is tested for fewer than 500 trades or has a data history of less than 3 years, it is likely to not achieve any high levels of statistical significance.


