
THE NEW ITALO PIVOTS INDICATOR WITH SMART PANEL - THE BEST PIVOT POINT INDICATOR ON THE MARKET
EXPERIENCE A GAME CHANGER, AN INNOVATIVE PIVOT POINT INDICATOR
Take Your Trading To The Next Level With ITALO PIVOTS INDICATOR
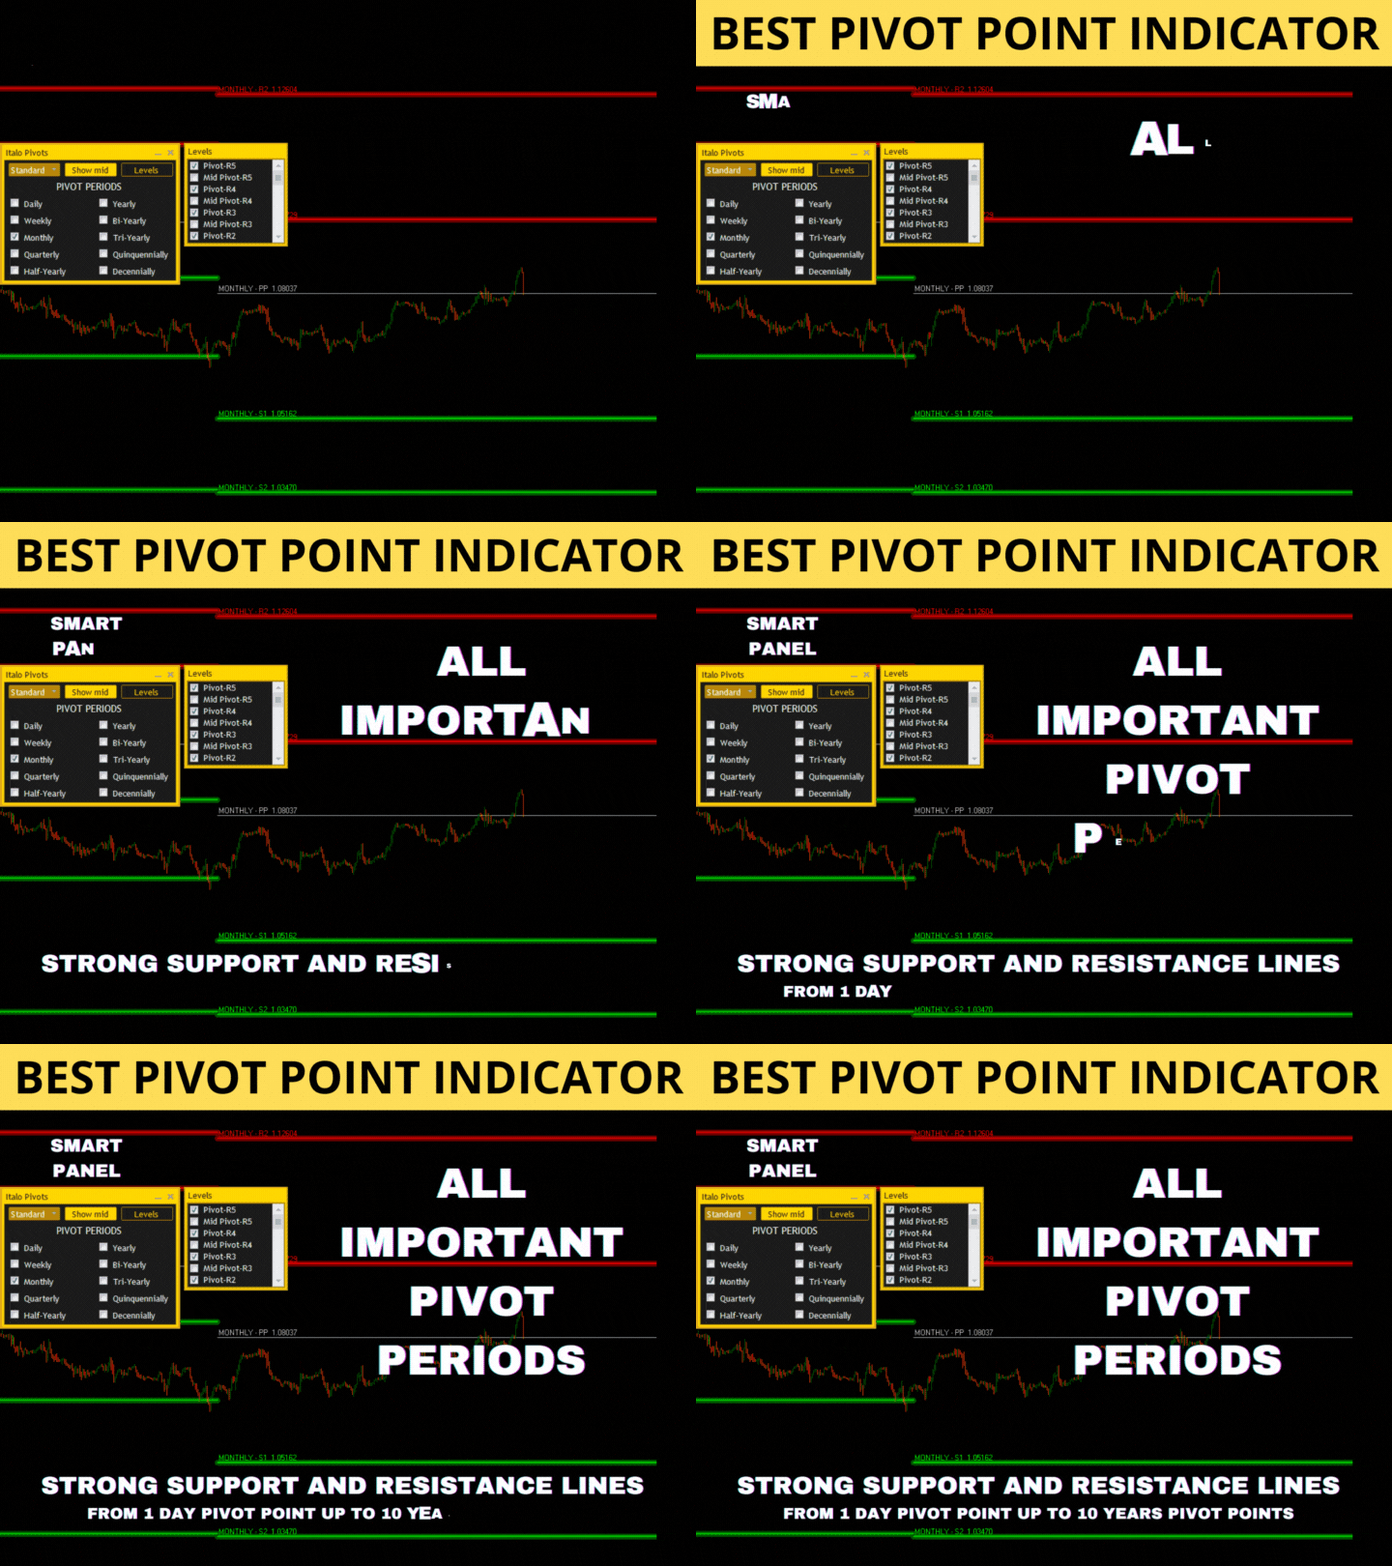
FOR THE FIRST TIME an amazing Indicator that has 1 Day pivot point up to 10 Years of Pivot Points to choose and trade with the best Strong Reversals and Continuations of Price Indicator.
Smart Panel, The Strongest Support and Resistance Lines, No Complicated Rules, No Confusing Charts, No Guesswork... The Best Pivots Indicator on the Market!
![]()
On the video tutorial bellow I explain every detail about the Italo Pivots Indicator, on how to use and choose the pivots from 1 Day up to 10 Years on the smart panel,
how you can put more than one pivot on the same chart from 1 Day up to 10 Years to confirm price movements to have confluence to enter the market with confidence.
FOR THE FIRST TIME ON THE MARKET YOU CAN CHOOSE THE MOST IMPORTANT PIVOT POINTS TO TRADE, FROM 1 DAY UP TO 10 YEARS IN A EASY WAY WITH THE SMART PANEL, TAKE A LOOK:
1. Italo Pivots Indicator is a professional Pivot Point Indicator that detects and predicts real reversals and breakouts on the market with precision, it works on all time-frames and assets.
2. Italo Pivots Indicator has an Edge over the market, this means you will predict where strong reversals and continuations/breakouts of price It's going to happen with the highest probability every single time, the probability is on our side!
3. Italo Pivots Indicator is profitable and stable, and it will show you the real strong reversals and continuations/breakouts.
4. You will have on your hands the perfect Pivot Point indicator to be profitable and consistent on the market.
5. Italo Pivots Indicator is easy to install and easy to use
6. The Indicator DOES NOT REPAINT, the Italo Pivots Indicator was made to make you a successful trader.
INDICATOR WITH AN UNIQUE ALGORITHM
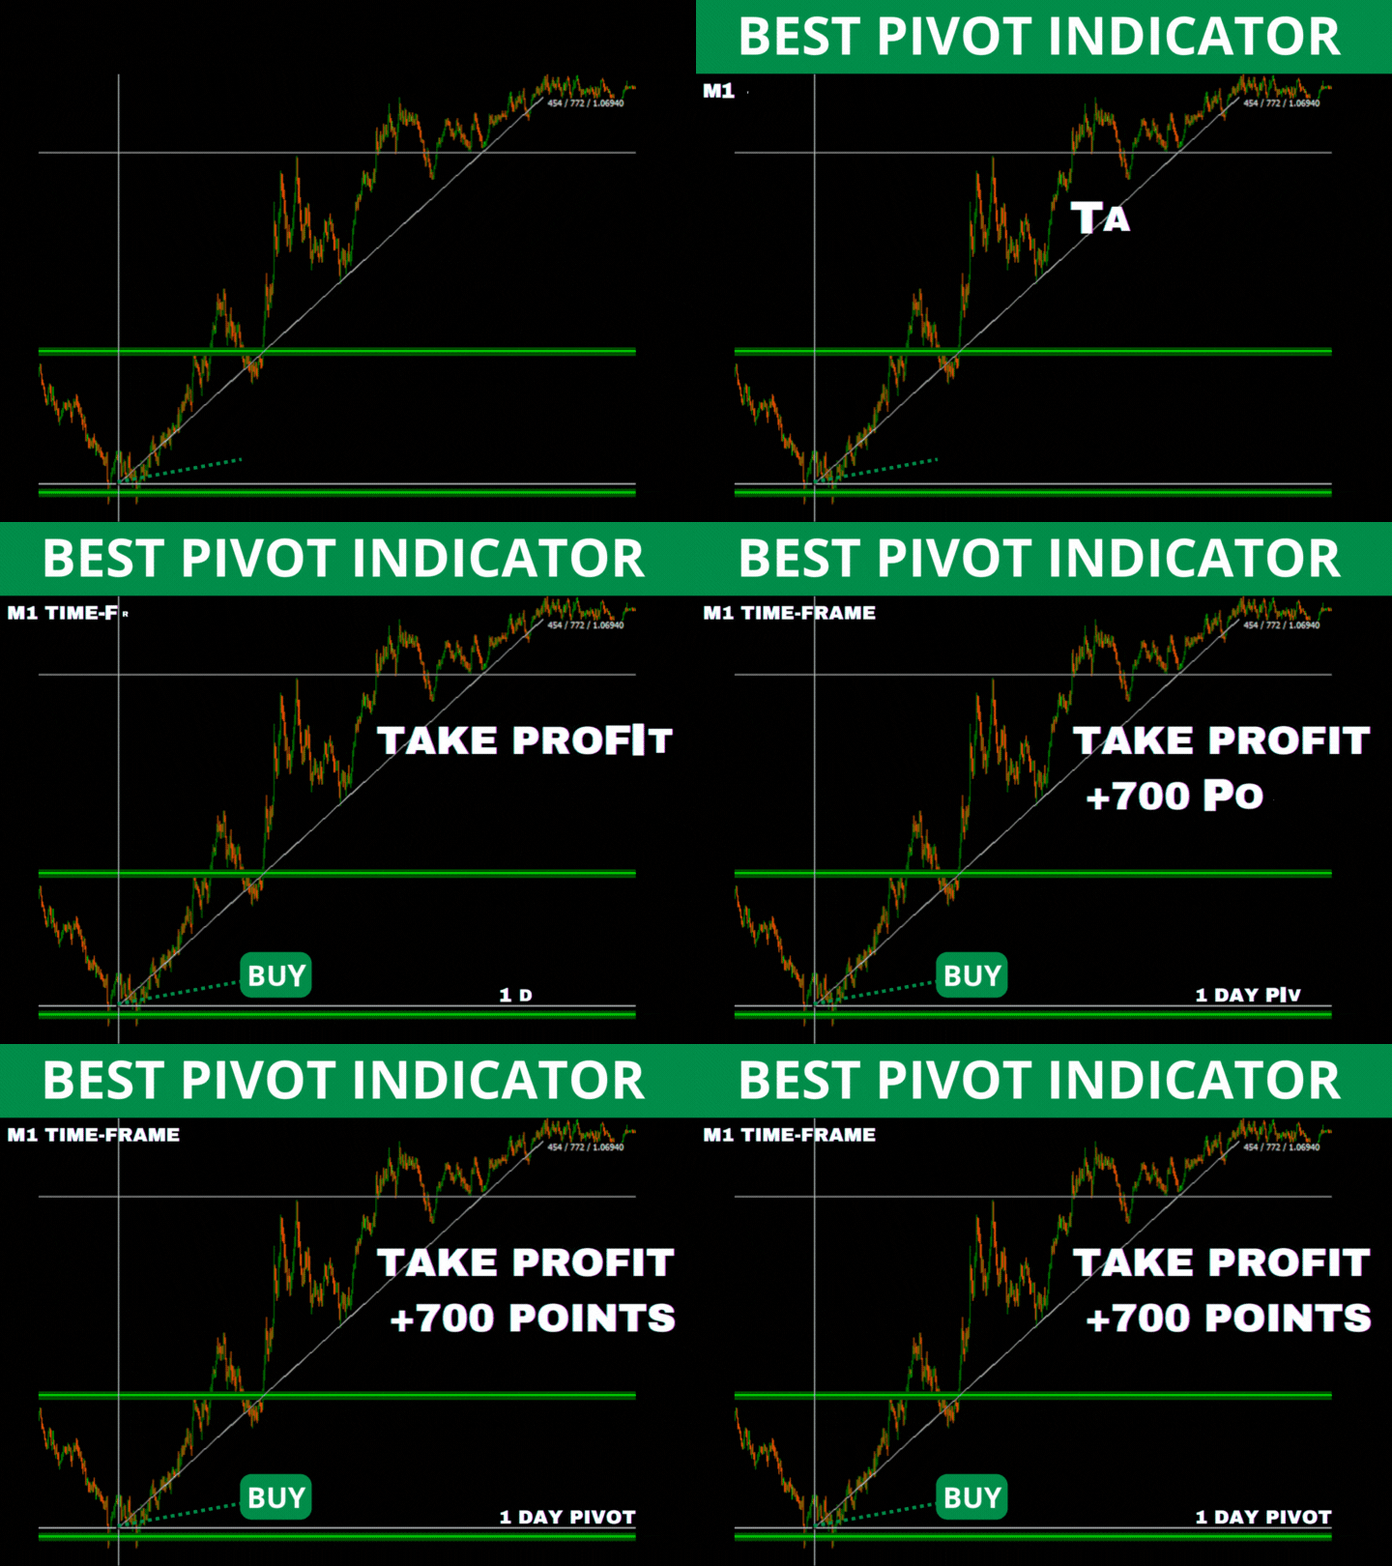
TRADE WITH CONFIDENCE
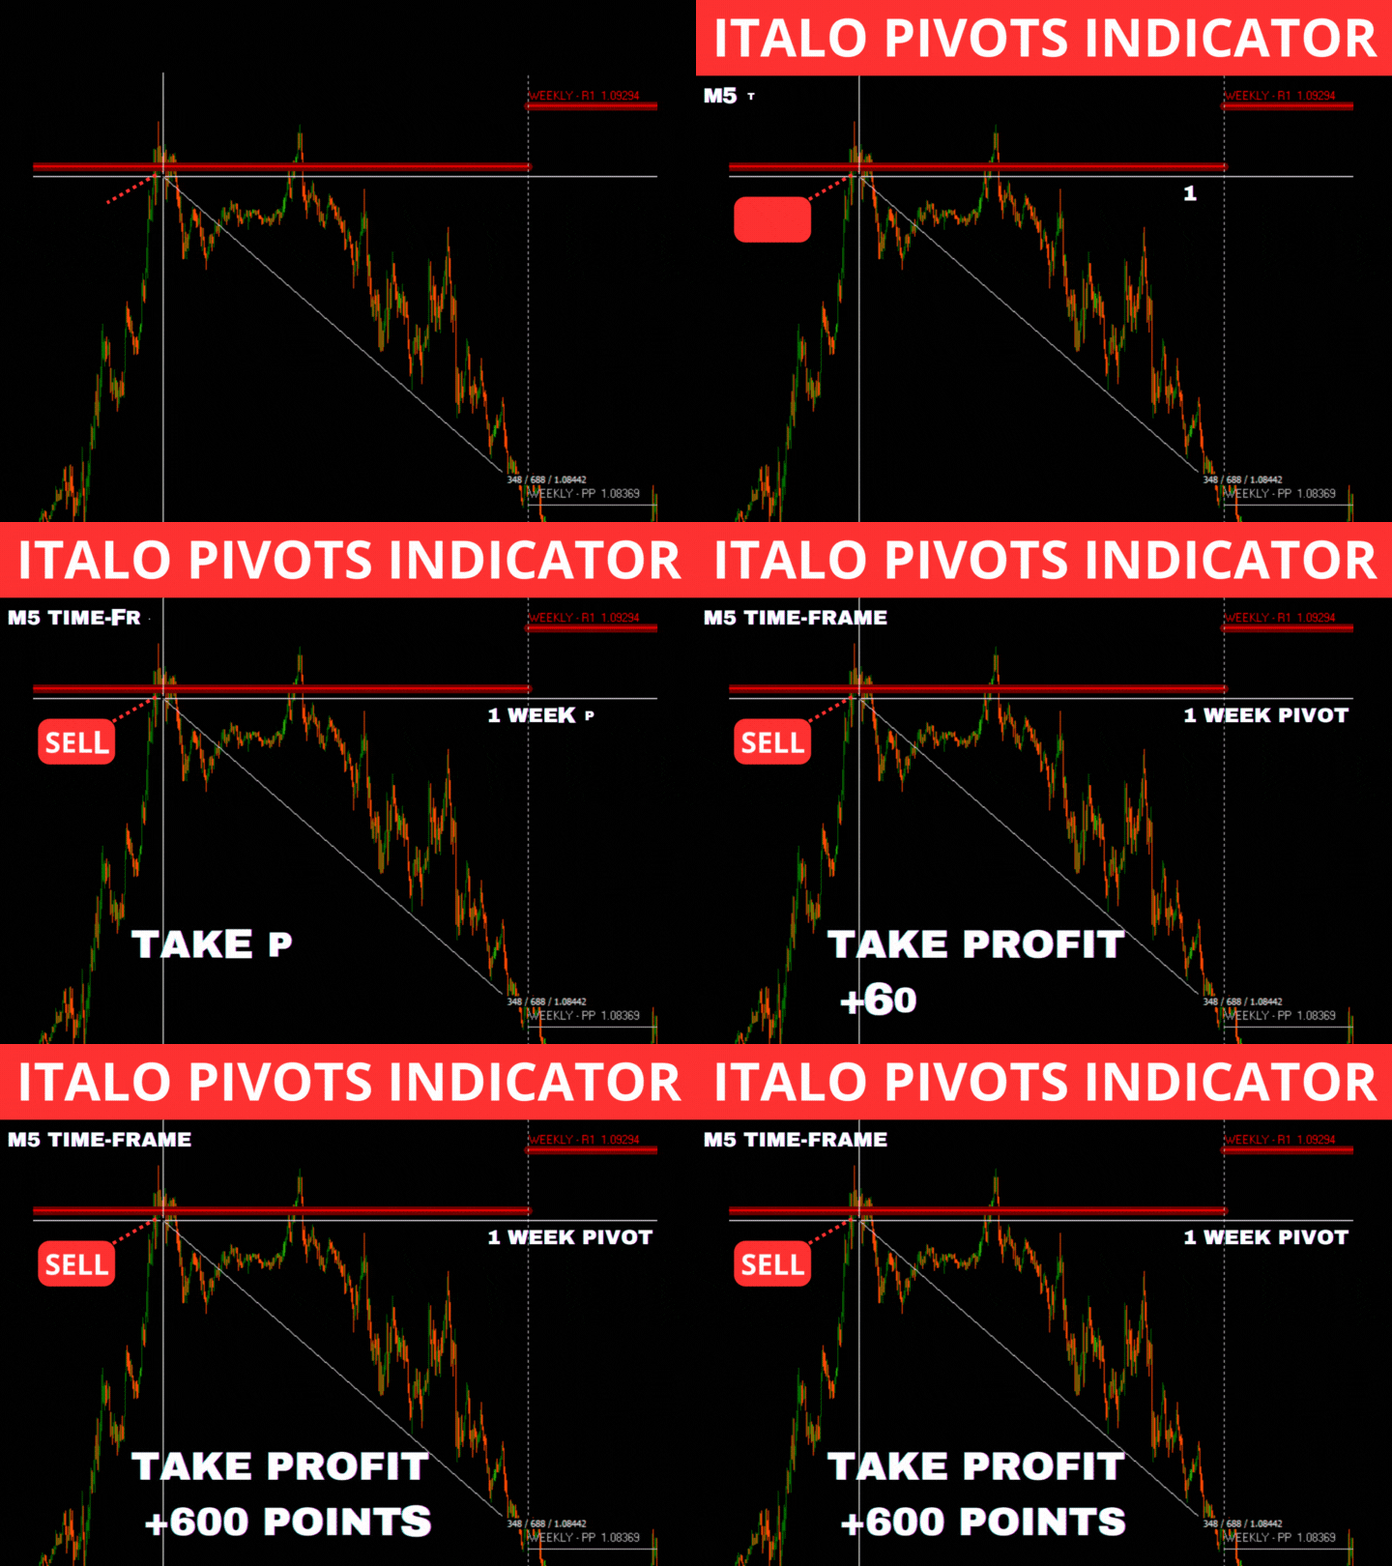
STRONG SUPPORT AND RESISTANCE LEVELS TO BUY AND SELL
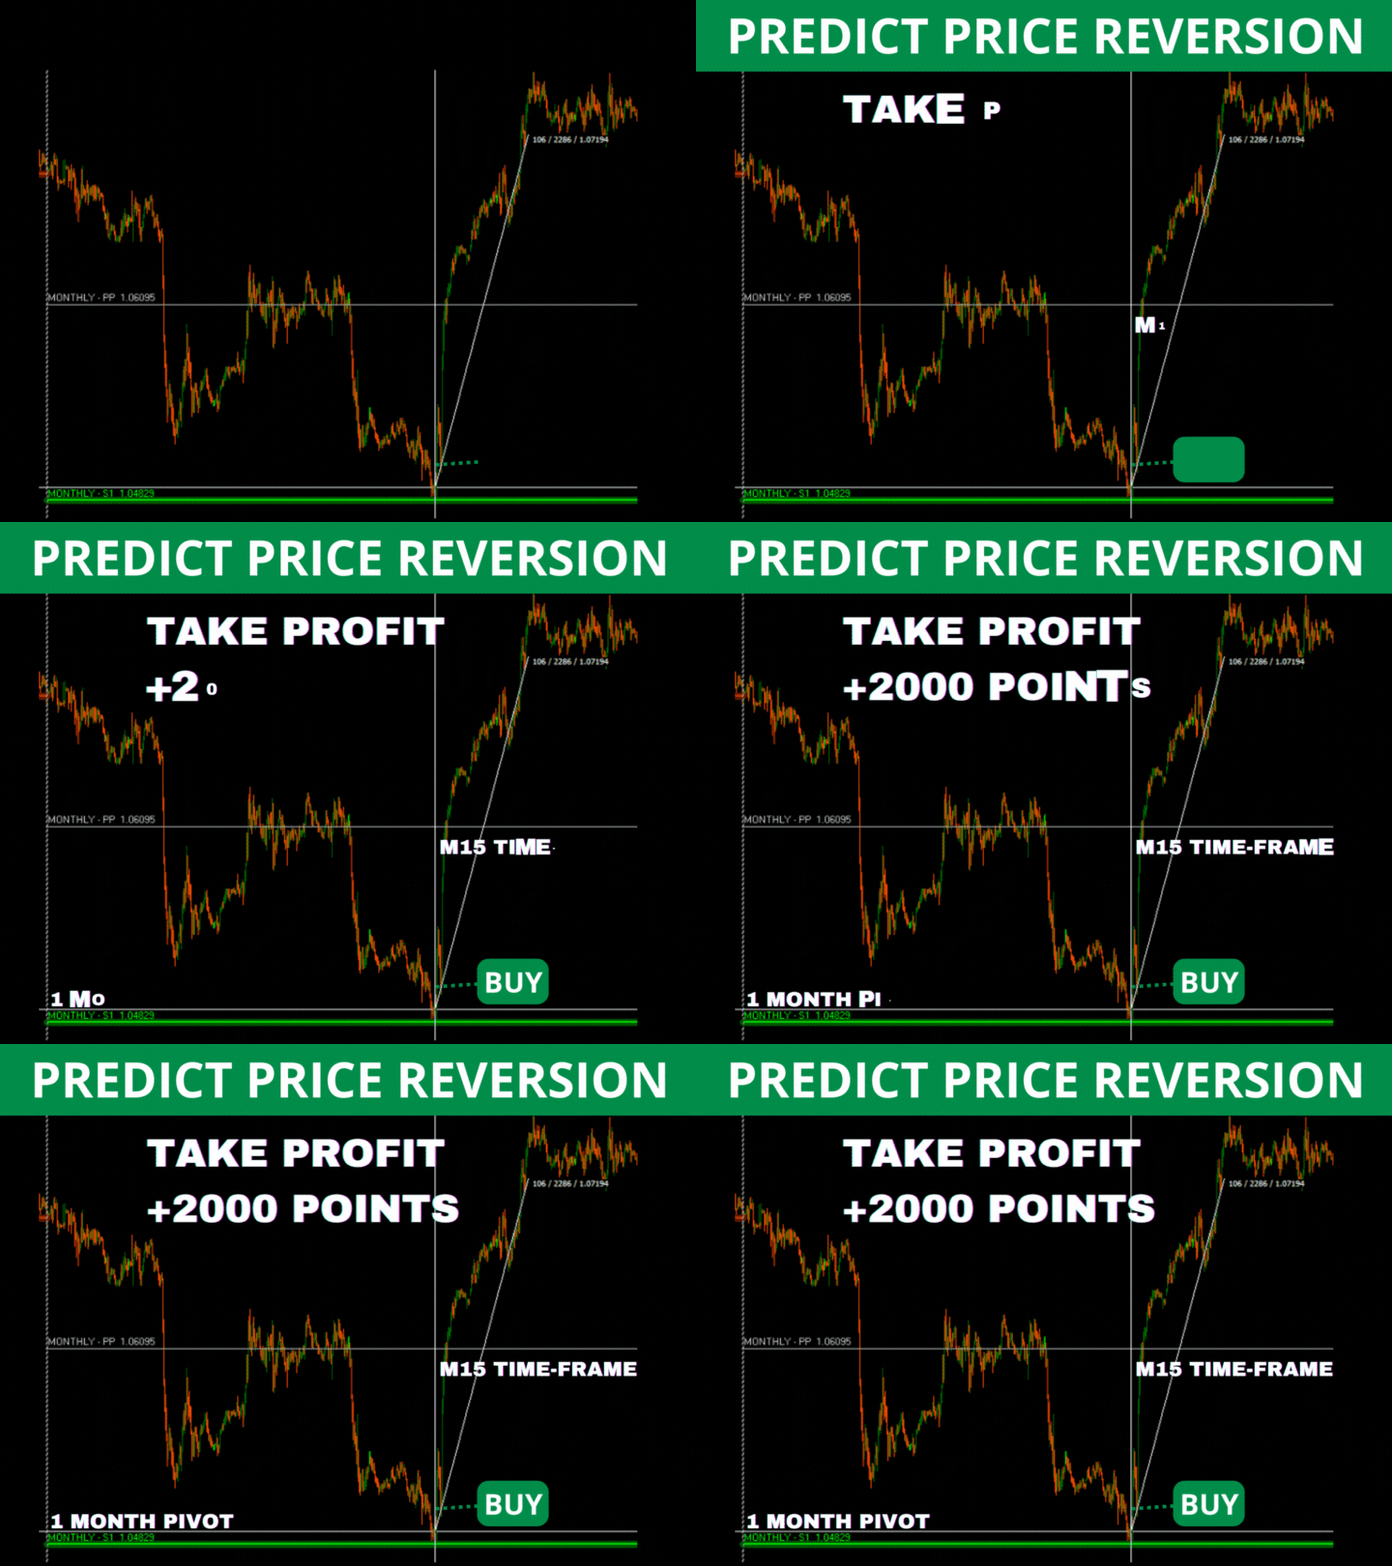
ITALO PIVOTS INDICATOR HAS ALL IMPORTANT LEVELS, FROM 1 DAY TO 10 YEARS
BELLOW WE SEE THE 3-MONTH PIVOT POINT PERIOD:
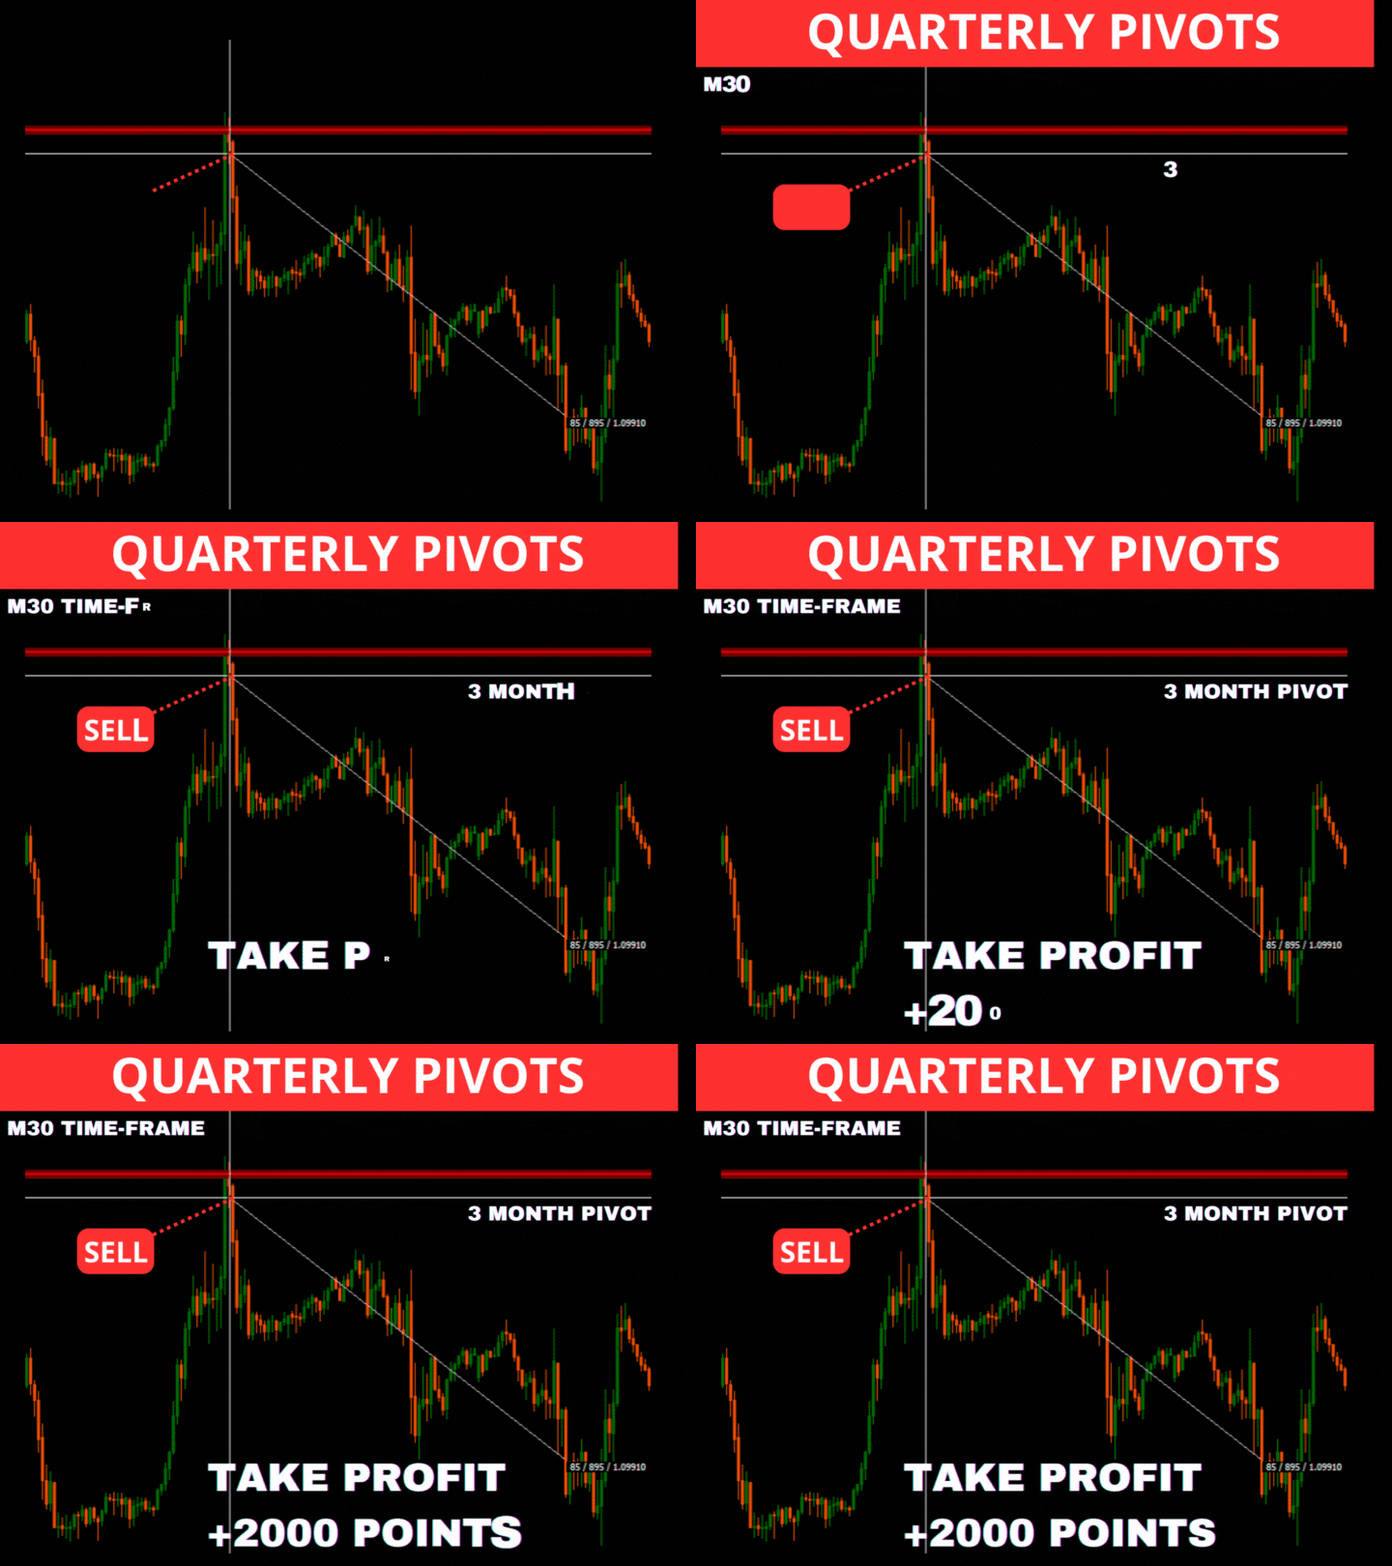
6 MONTHS PIVOT POINT PERIOD:
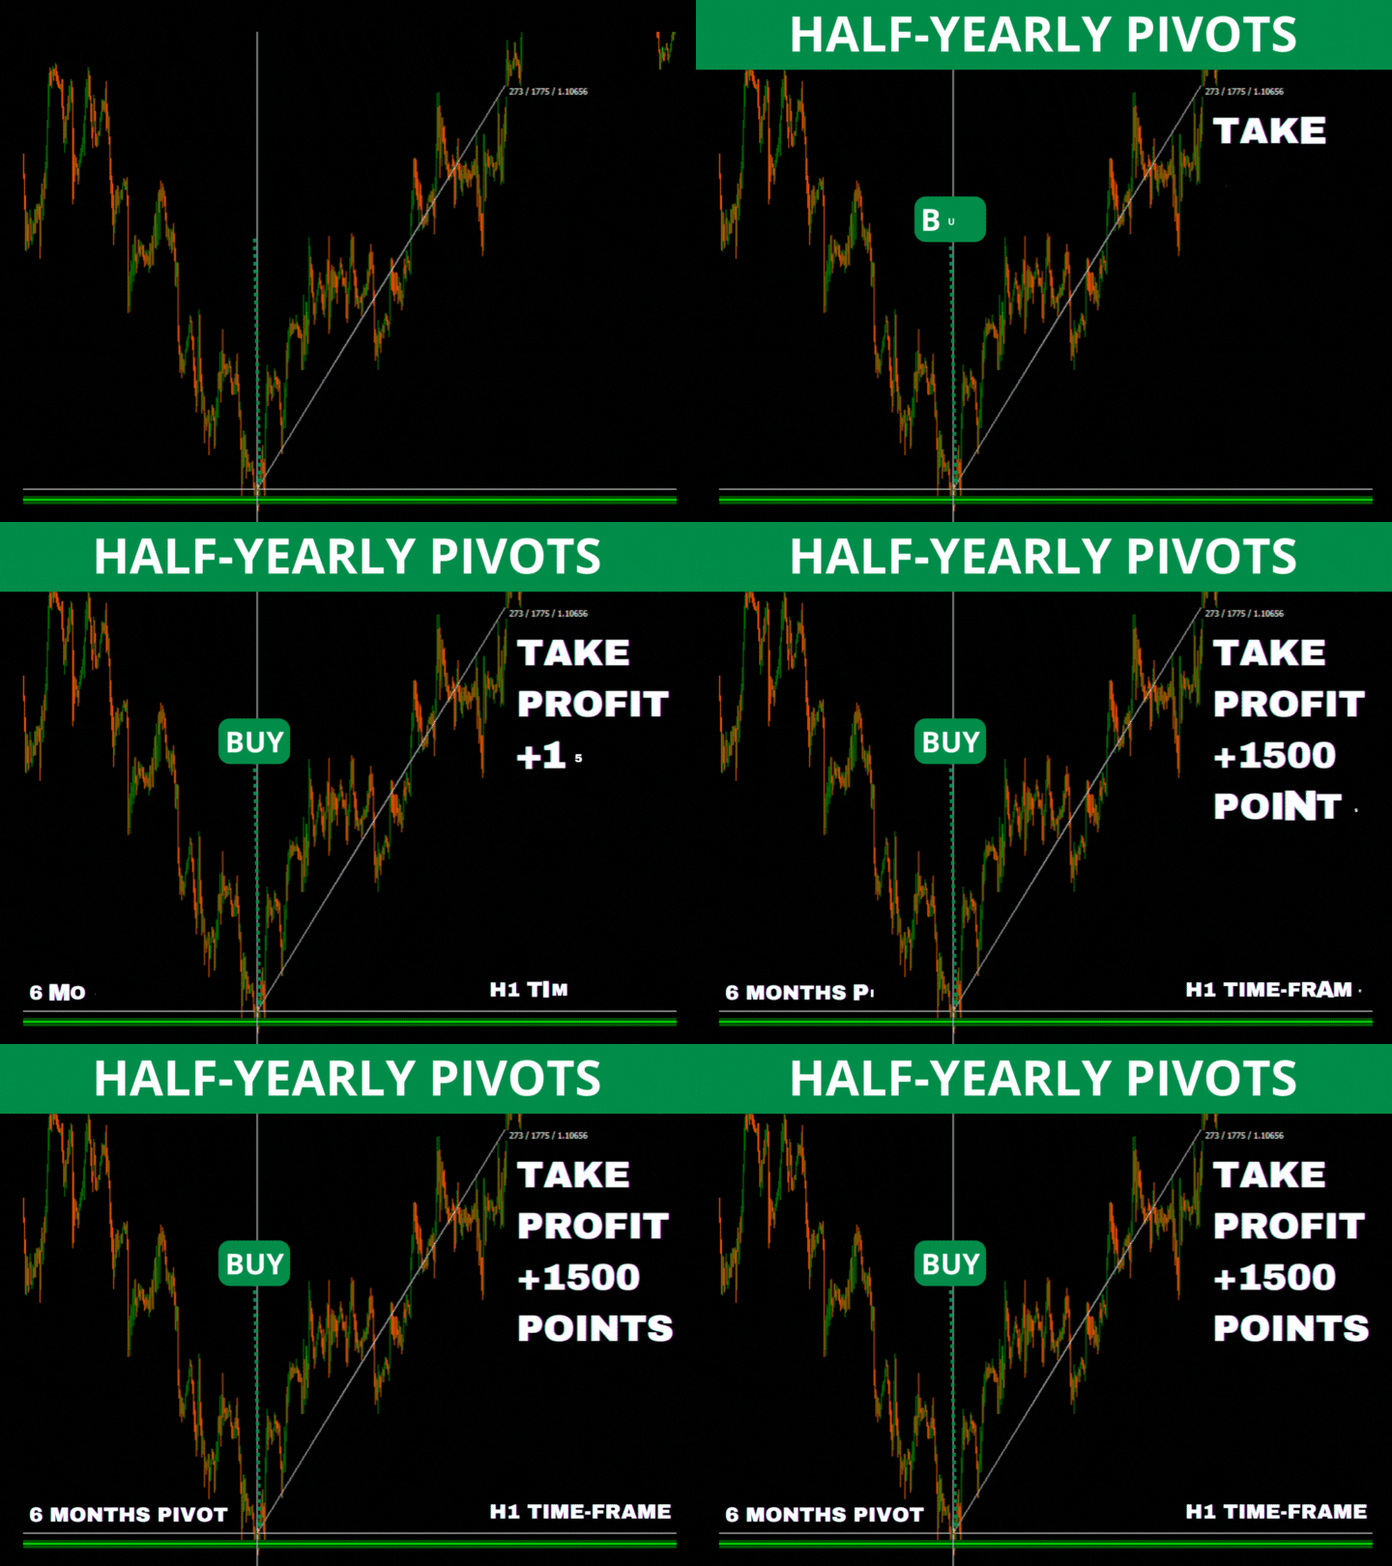
1 YEAR PIVOT POINT PERIOD:
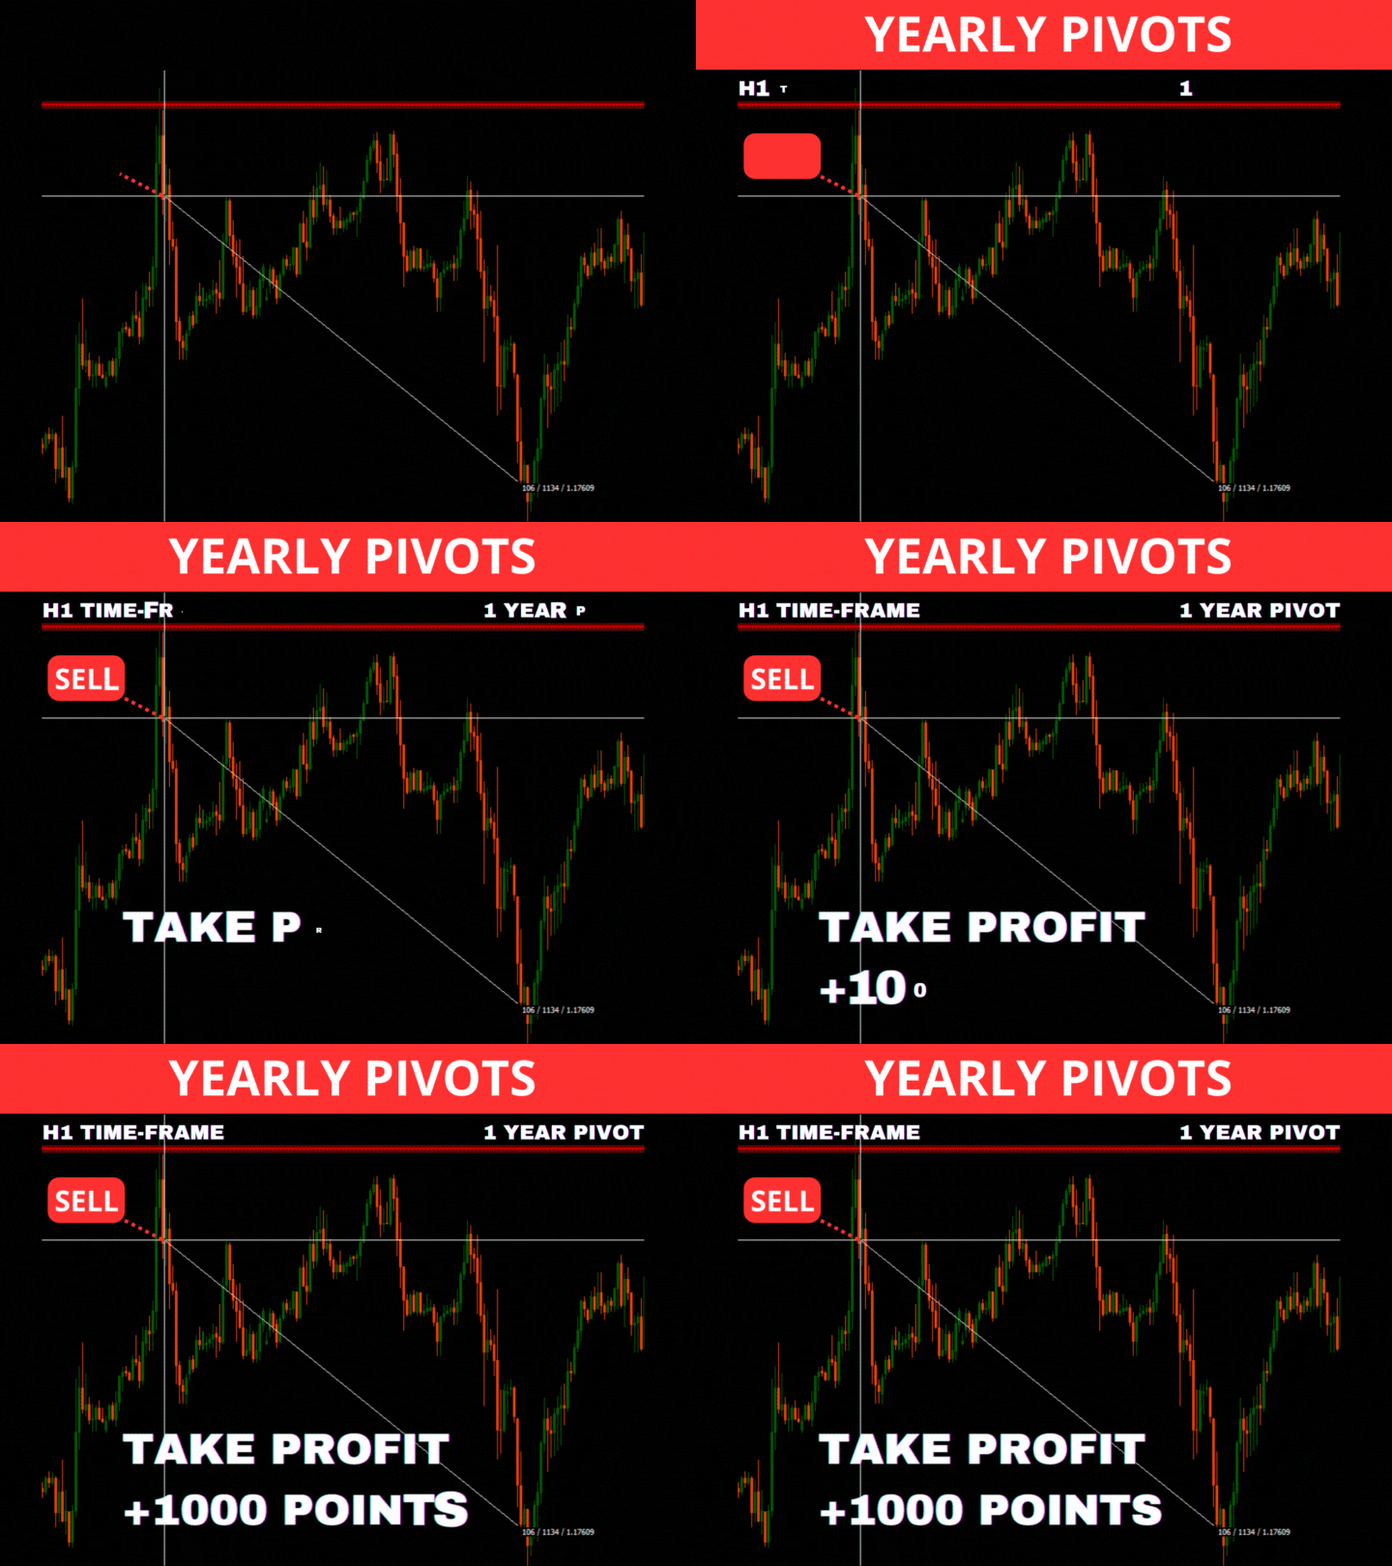
2 YEARS PIVOT POINT PERIOD:
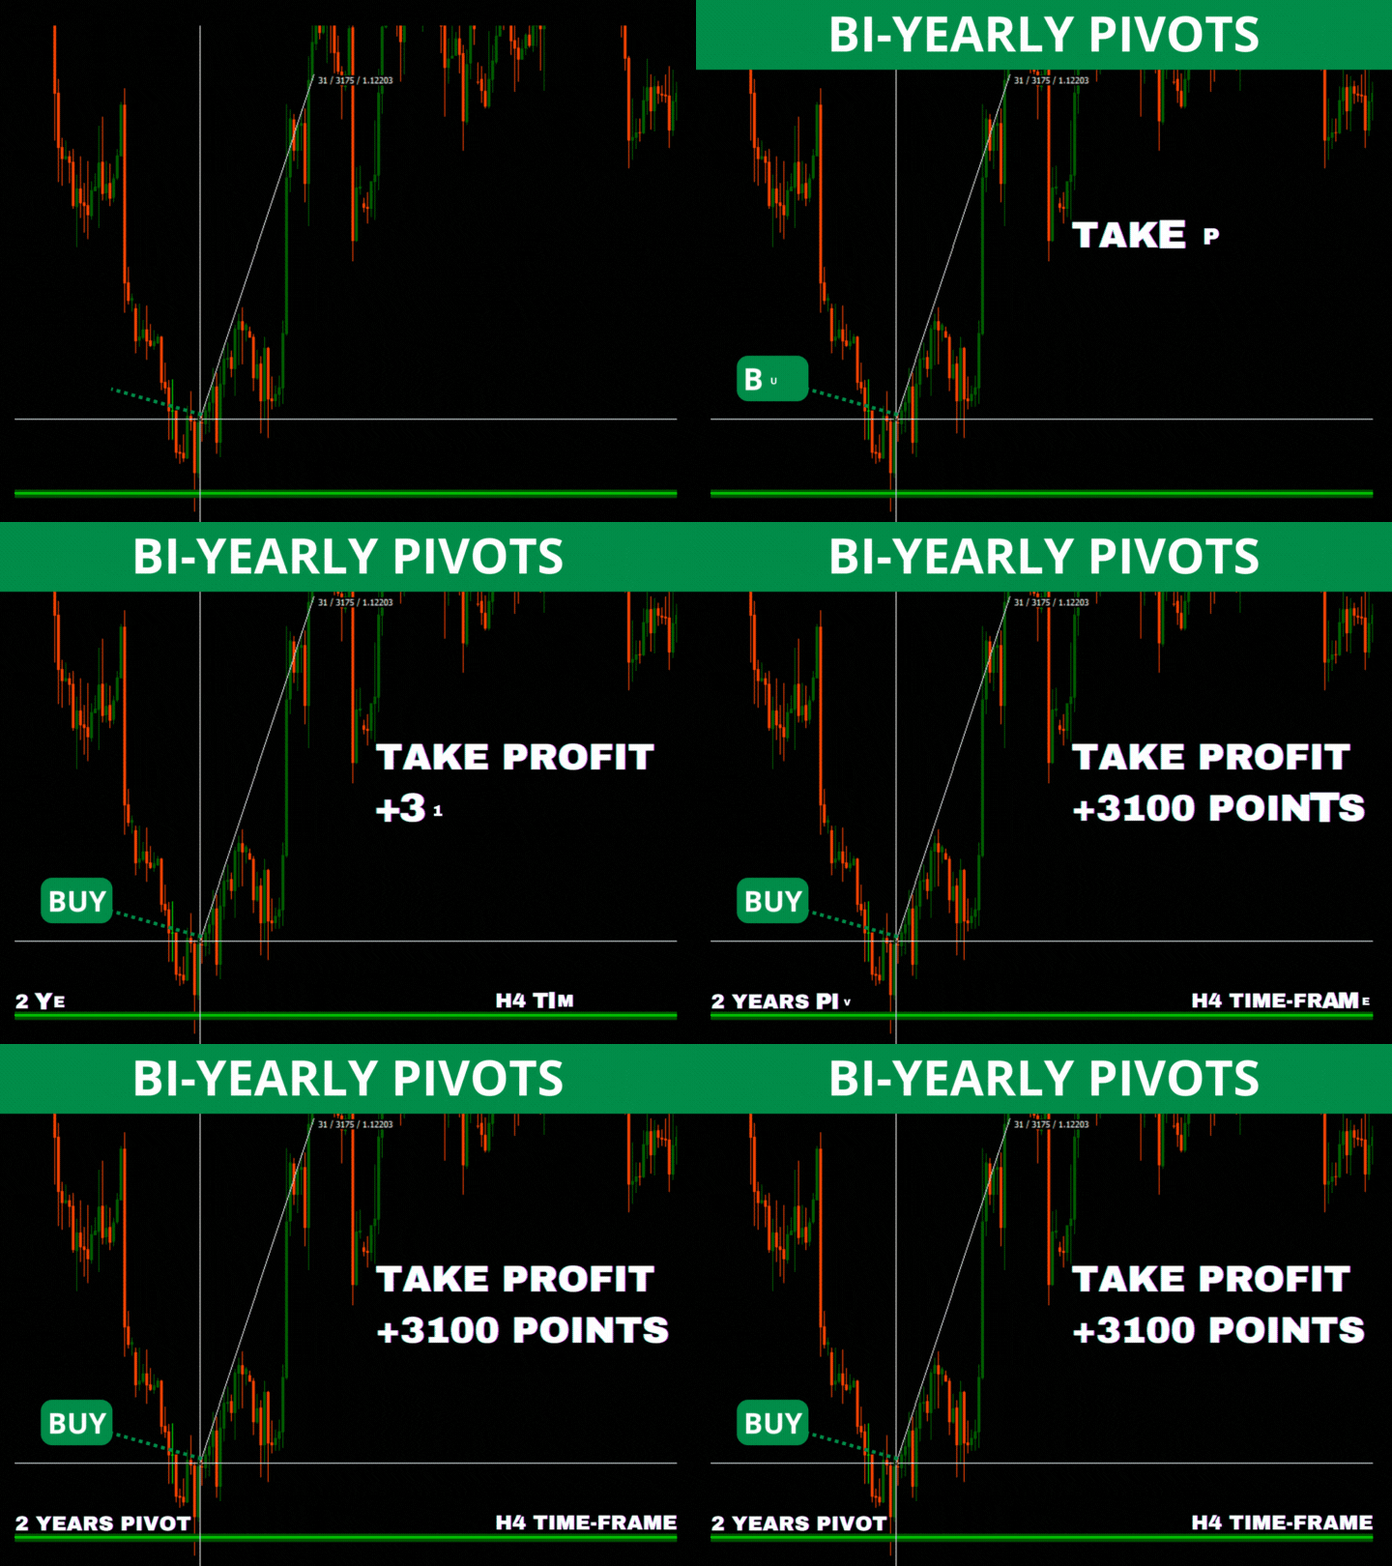
3 YEARS PIVOT POINT PERIOD:
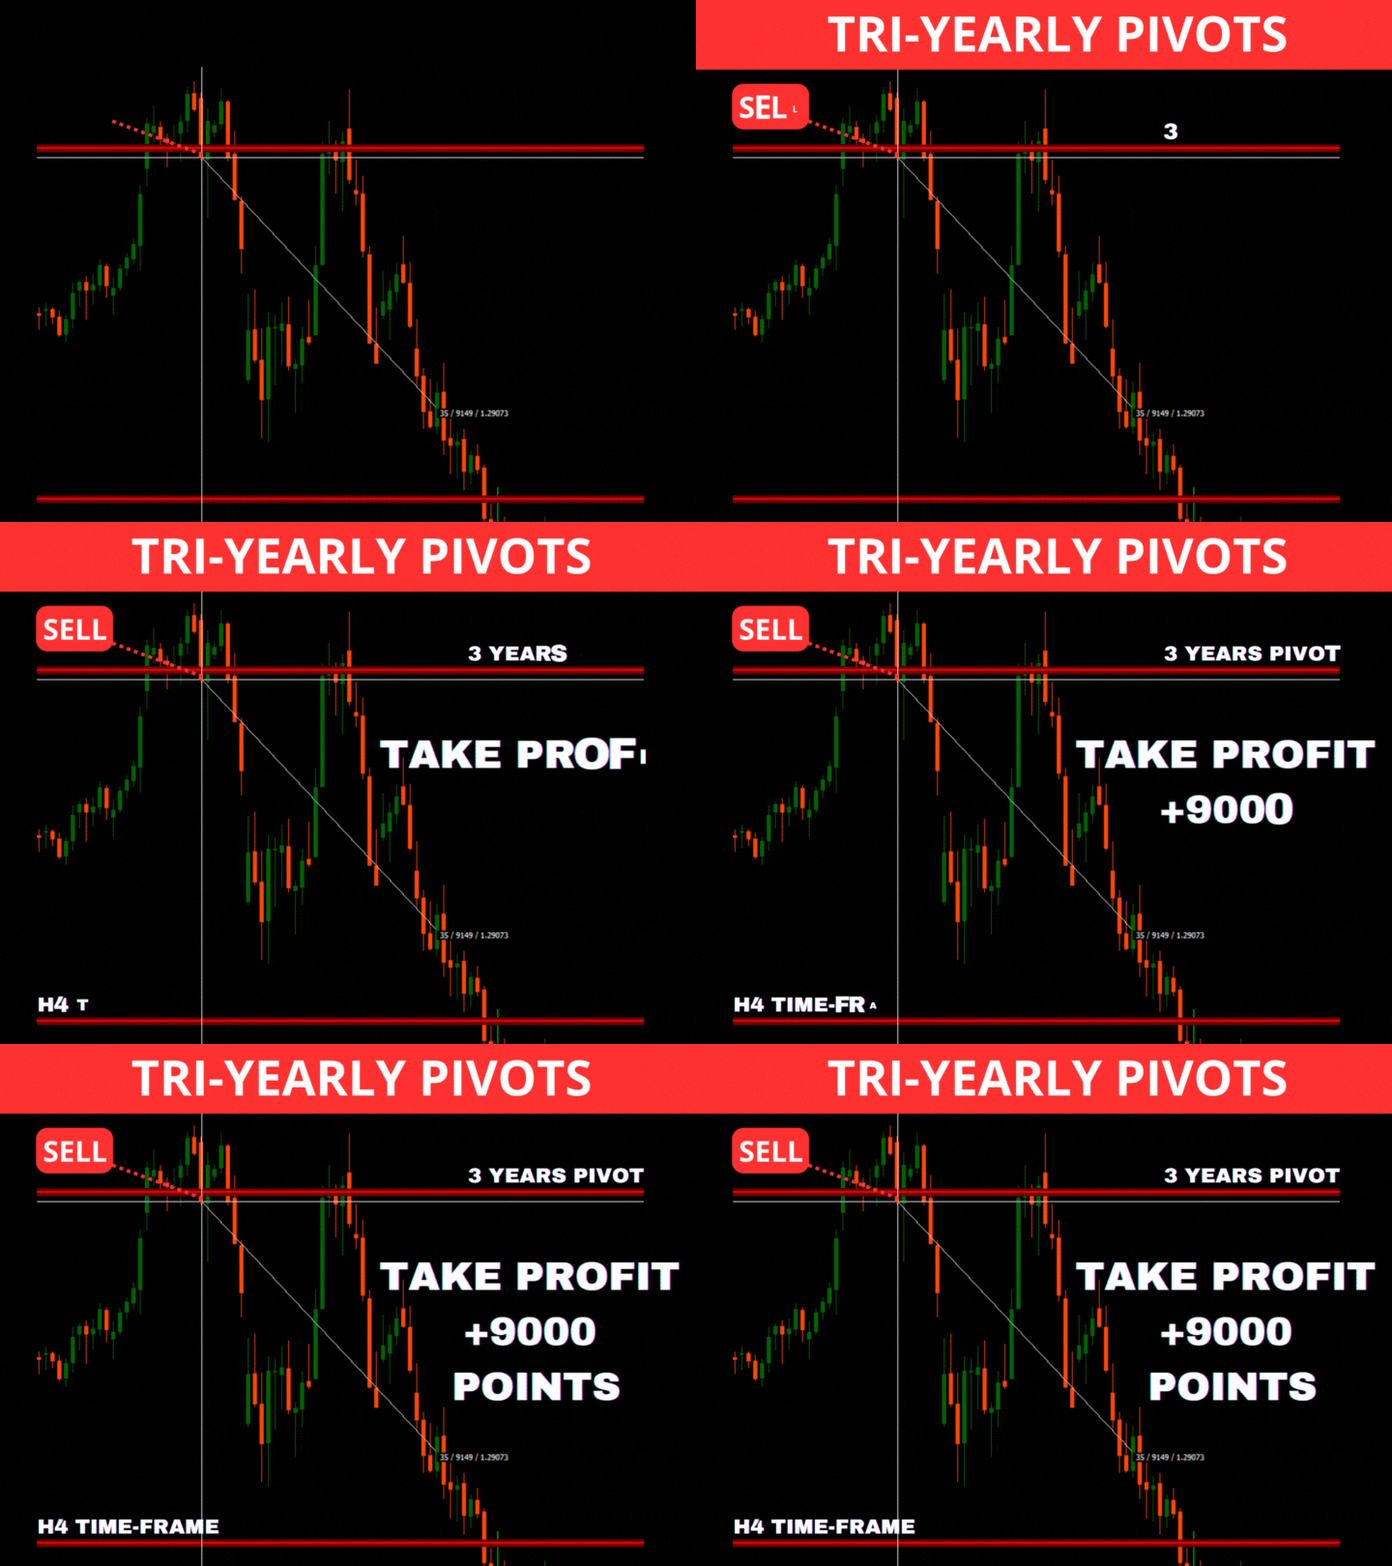
5 YEARS PIVOT POINT PERIOD:
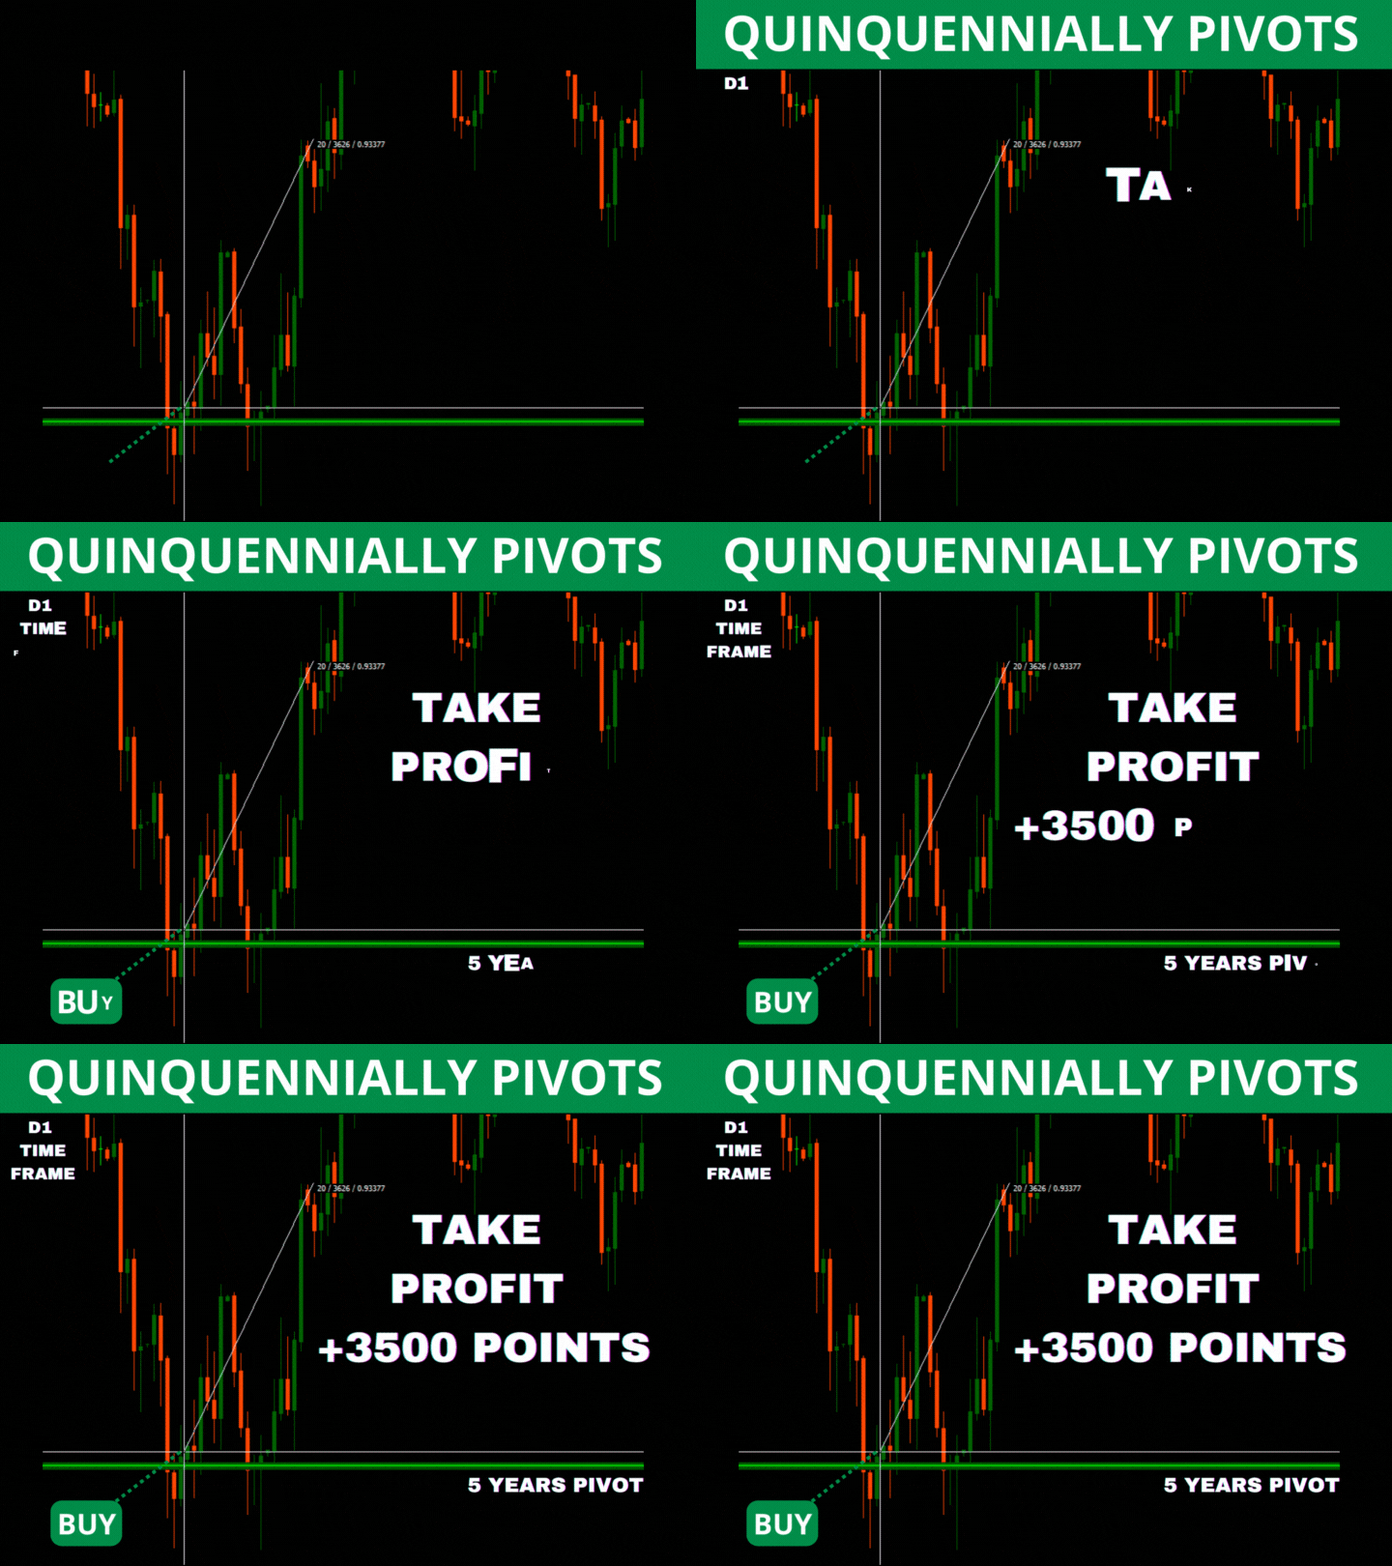
AND 10 YEAR PIVOT POINT PERIOD:
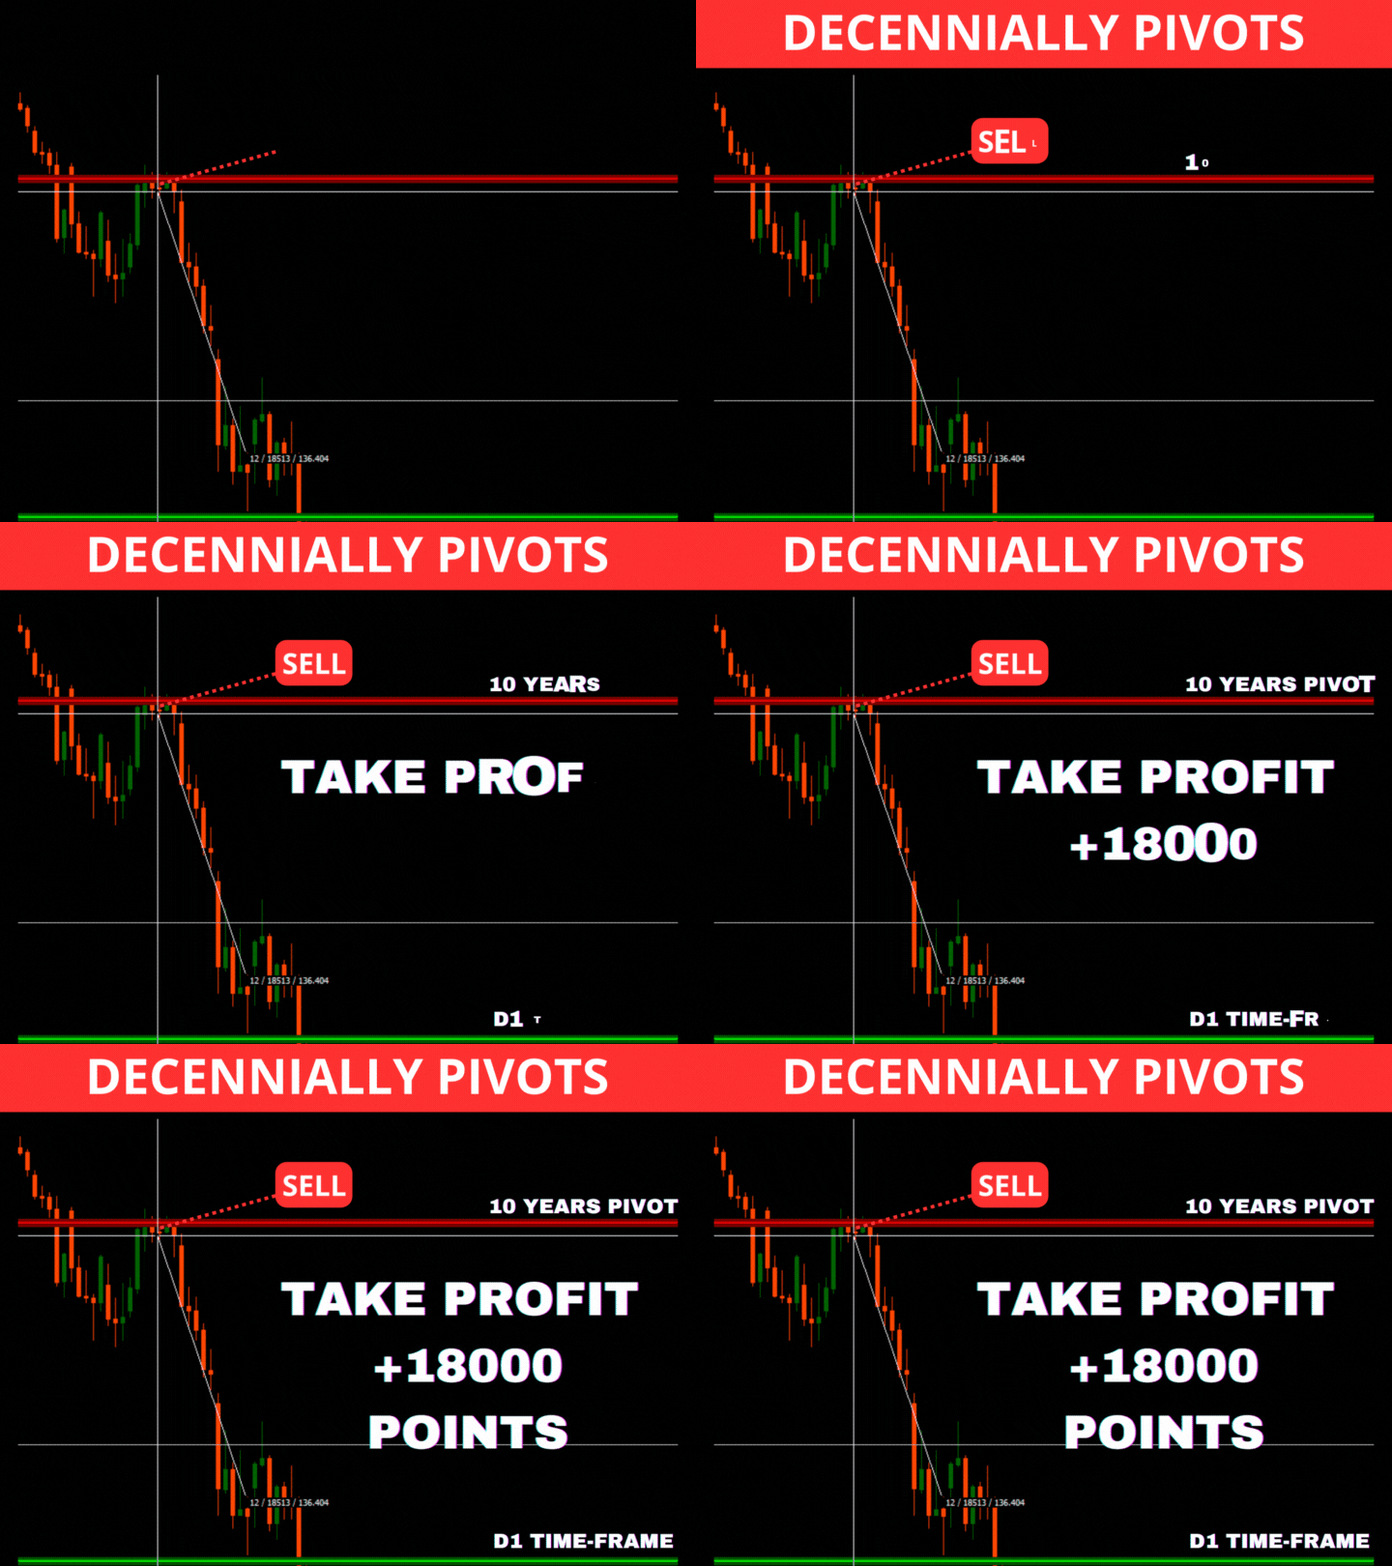
==== BELLOW WE SEE ALL THE IMPORTANT SETTINGS ON THE INDICATOR EXPLAINED THAT YOU HAVE THE OPTION TO CHANGE IF YOU LIKE====
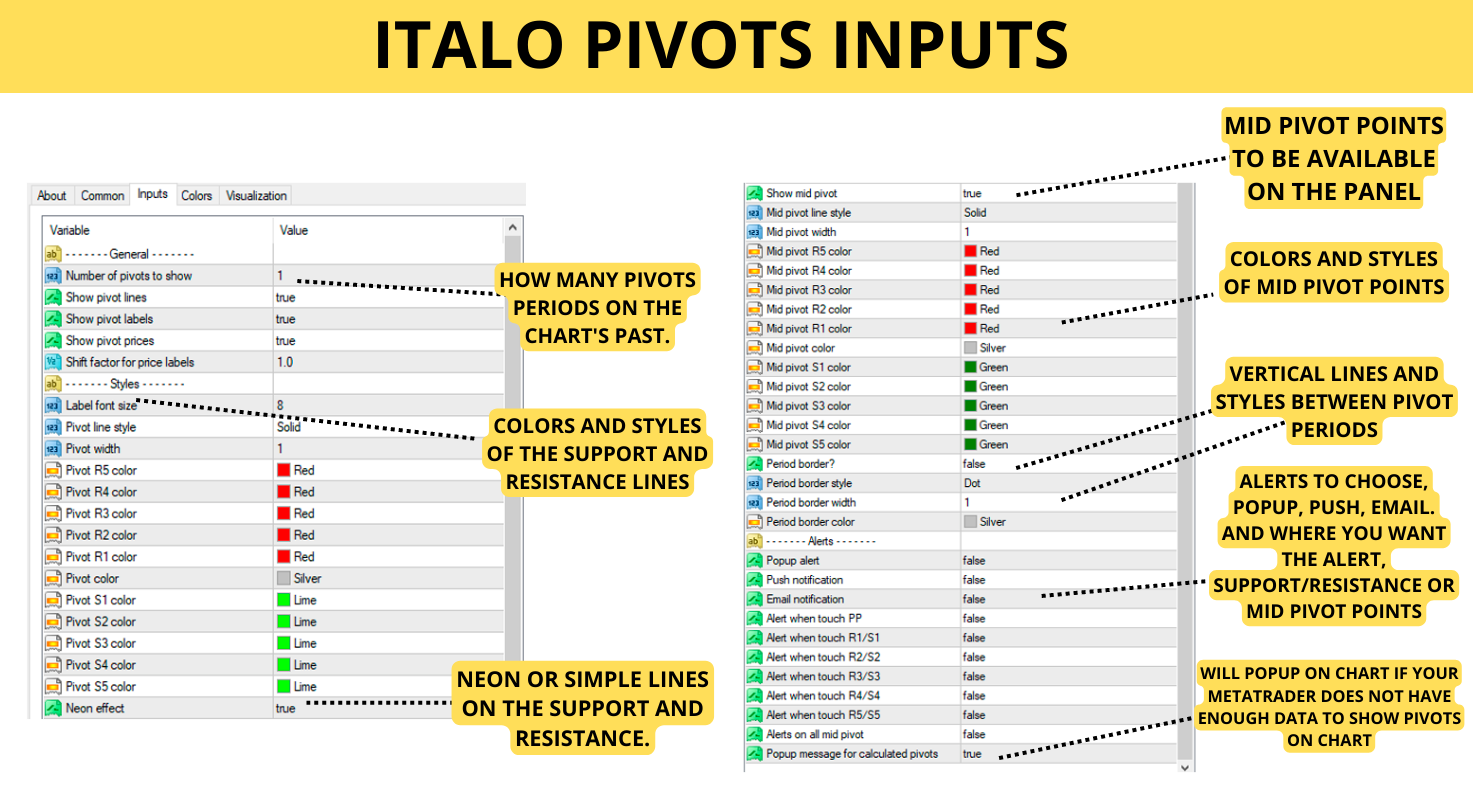
Important Parameters explained
- Number of pivots to show: Here is how many pivots on the past chart to show, so, if you put 10 and the pivot chose was the daily you will have on the chart the pivots from the last 10 days, if you put weekly would be 10 weeks and so on.
- Show Pivot Lines/Labels and Prices: Here you can choose if you want to see just the pivot lines, labels or prices.
- Shift factor for price labels: The more you increase this number you will have more distance between the price labels and the pivot lines.
- Styles: Here you can change every single color of all support and resistance lines, middle lines, show middle lines or not, width of lines and even put "true/false" to show neon into the pivot lines and so on.
- Alerts: Here you can choose what alert you want, Popup, Push notifications and E-mail notifications. Also on which pivot you want the alert: Alert when touch PP (Pivot point), R1/S1 (Support and Resistance 1), R2/S2, R3/S3, R4/S4, R5/S5 and alerts on all mid pivots.
- Popup message to calculated pivots: I recommend you to put true, this option will show a popup message when your metatrader historical data is not enough to make the calculations for the selected pivot period appear. Watch the video above on this article to know how to easily download a lot of historical data fast.
As you saw, the Italo Pivots Indicator has an Edge over the market, and another amazing feature is that you can put whatever pivot period you want on the same chart:
FOR EXAMPLE, BELLOW YOU HAVE THE PIVOT POINT OF 1 MONTH AND 1 YEAR ON THE SAME CHART
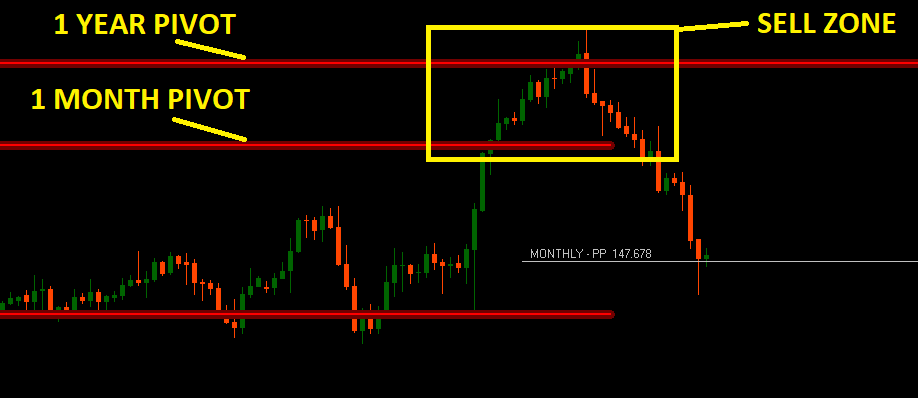
In the example above we had a confluence giving us a sell zone between 1 Month pivot and 1 Year pivot point, after that the market had a reversal downside
You can do this combination with every pivot period you want, the probability is on our side!
And of course, you will also have all the alerts when the signal appears if you want, on the support/resistance lines or on mid pivots.
TO KNOW HOW TO PUT ALL PIVOT PERIODS, ALERTS AND MUCH MORE WATCH THE DETAILED TUTORIAL I MADE FOR YOU BELLOW:
As you could see, the Italo Pivots Indicator is different from most Indicators, finally you can trade with confidence and peace of mind, let's see again the benefits of Italo Pivots Indicator:
1 - Unique Algorithm and Smart Panel
2 - Predict Reversals and Continuations of Price showing strong support and resistance pivot lines
3 - All Important Pivot Point Periods: Daily, Weekly, Monthly, Quarterly (3 months), Half yearly (6 months), Yearly (1-year), Bi yearly (2 years), Tri yearly (3 years), Quinquennially (5 years), Decennially (10 years).
4 - Identify in a precise way the reversal and Continuation movements putting together all pivots you want on the chart.
5 - Time-frames: All
6 - Assets: All
7 - Easy to use, does not overload charts with unnecessary information
8 - Does not repaint
9 - Alerts on support and resistance lines, pivot lines and middle lines if you like. Option of Popup Alerts, push notifications and e-mail notifications.
10 - Full customization: Color and styles of all lines.
11 - Excellent product support

Now You have the opportunity to trade with an Indicator that really works!
Italo Pivots Indicator (MT4) Italo Pivots Indicator (MT5)

Take Your Trading To The Next Level With Italo Pivots Indicator!
For any questions related to the purchase, installation, backtesting and use of the Indicator, send me a private message on my profile here on mql5
==== BELLOW WE SEE ALL THE IMPORTANT SETTINGS ON THE INDICATOR EXPLAINED THAT YOU HAVE THE OPTION TO CHANGE IF YOU LIKE====

Important Parameters explained
- Number of pivots to show: Here is how many pivots on the past chart to show, so, if you put 10 and the pivot chose was the daily you will have on the chart the pivots from the last 10 days, if you put weekly would be 10 weeks and so on.
- Show Pivot Lines/Labels and Prices: Here you can choose if you want to see just the pivot lines, labels or prices.
- Shift factor for price labels: The more you increase this number you will have more distance between the price labels and the pivot lines.
- Styles: Here you can change every single color of all support and resistance lines, middle lines, show middle lines or not, width of lines and even put "true/false" to show neon into the pivot lines and so on.
- Alerts: Here you can choose what alert you want, Popup, Push notifications and E-mail notifications. Also on which pivot you want the alert: Alert when touch PP (Pivot point), R1/S1 (Support and Resistance 1), R2/S2, R3/S3, R4/S4, R5/S5 and alerts on all mid pivots.
- Popup message to calculated pivots: I recommend you to put true, this option will show a popup message when your metatrader historical data is not enough to make the calculations for the selected pivot period appear. Watch the video above on this article to know how to easily download a lot of historical data fast.
As you saw, the Italo Pivots Indicator has an Edge over the market, and another amazing feature is that you can put whatever pivot period you want on the same chart:
As you saw, the Italo Pivots Indicator has an Edge over the market, and another amazing feature is that you can put whatever pivot period you want on the same chart:
FOR EXAMPLE, BELLOW YOU HAVE THE PIVOT POINT OF 1 MONTH AND 1 YEAR ON THE SAME CHART

In the example above we had a confluence giving us a sell zone between 1 Month pivot and 1 Year pivot point, after that the market had a reversal downside
You can do this combination with every pivot period you want, the probability is on our side!
And of course, you will also have all the alerts when the signal appears if you want, on the support/resistance lines or on mid pivots.
TO KNOW HOW TO PUT ALL PIVOT PERIODS, ALERTS AND MUCH MORE WATCH THE DETAILED TUTORIAL I MADE FOR YOU BELLOW:
As you could see, the Italo Pivots Indicator is different from most Indicators, finally you can trade with confidence and peace of mind, let's see again the benefits of Italo Pivots Indicator:
1 - Unique Algorithm and Smart Panel
2 - Predict Reversals and Continuations of Price showing strong support and resistance pivot lines
3 - All Important Pivot Point Periods: Daily, Weekly, Monthly, Quarterly (3 months), Half yearly (6 months), Yearly (1-year), Bi yearly (2 years), Tri yearly (3 years), Quinquennially (5 years), Decennially (10 years).
4 - Identify in a precise way the reversal and Continuation movements putting together all pivots you want on the chart.
5 - Time-frames: All
6 - Assets: All
7 - Easy to use, does not overload charts with unnecessary information
8 - Does not repaint
9 - Alerts on support and resistance lines, pivot lines and middle lines if you like. Option of Popup Alerts, push notifications and e-mail notifications.
10 - Full customization: Color and styles of all lines.
11 - Excellent product support
![]()
Now You have the opportunity to trade with an Indicator that really works!
Italo Pivots Indicator (MT4) Italo Pivots Indicator (MT5)
![]()
Take Your Trading To The Next Level With Italo Pivots Indicator!
For any questions related to the purchase, installation, backtesting and use of the Indicator, send me a private message on my profile here on mql5


