Introduction
Advanced Trade Simulator is an indicator you can attach to any chart and then buy and sell the given symbol virtually. You can buy it in the market. See utilities.
No actual trading takes place. You can attach it to multiple charts. Then you can buy multiple symbols.
This simulator aims to be faithful to reality, using price from your broker and you can set spread yourself.
Why?
To test trading strategies, you use a demo account or trade live. The third option is to use a simulator. Metatrader provides a tester but mt4 does not allow testing more than one symbol but this program can. You can enter trades by hand.
So this is much faster way of testing a strategy. Place trades , close them. It also allows trying other forms of order that is not available in Metatrader such as OCO and OSO.
Features
- buy and sell immediately on the given time frame
- market , limit and stop orders
Set their price with a click of button.
- set lot based on risked % (risk a % of the balance) and stop-loss
- trailing stop-loss
- generalized OCO, more than 2 orders can cancel each other.
Choose the orders which are part of OCO and that it is.
- OSO, one sends another..
Another lesser known way of sending orders.. "One sends another".. One order actives another.
- buy and sell many times and multiple symbols
Each chart can be traded separately. The time of simulation is synchronized among them.
- you can set take profit and stop loss level by clicking
And you can see the expected profits and losses in the currency of the account.
- set starting date and test from the point onwards
And restart trading to practice again
- no trade tester needed as in other products you find
Yes, just attach to a chart as an indicator.
- it hides the future prices so you cannot know what is coming. It makes the simulation more realistic.
It hides the future for other attached indicators as well.
- so you start in the past.. and move forward one bar or 10 bars by pressing buttons.
Or go back with "Set time" option.
- you can close any given trade or all of them
- swap is calculated
- margin is calculated.. It is not possible to open positions when there is not enough margin.
-There is Stop Call, positions can be liquidated.
- calculate pips and expected profit/loss for take profit and stop loss
- you can save trades in a file or load them from a file
- you can view profit factor, total profit, current profit of each position and total.
- buttons can be used to perform all required operations
- it uses open price of each bar to open a new position
- you can set volume you would like to buy
- you can test all bars in the charts.. if you need older bars , you need to scroll bar your chart.
- you can set start time by clicking "Set Time" button
- yellow horizontal line shows "current" price
- It displays number of wins and losses
- You can resize the panel by FontSizeMultiplier parameter and ZoomFactor parameter
-Navigation through existing trades using "first", "<", ">", "last" buttons
Normal workflow
- Attach indicator to the chart you would like to use
- Set StartAt parameter where you would like to start
- Or navigate to the time on the chart where the simulator should start
Then press "Set Time" button.. Then click on the chart where you would like to start the simulator.
You will see a lot of buttons.
- "Buy" button buys given amount lot, default is 1 lot
- "Sell" button sells given amount lot, default is 1 lot
- "Close" button at the top closes all positions
- "Step 1" steps 1 bar at a time
- "Step 10" steps 10 bar at a time
- So Set Lot size
- Press Buy or Sell button...
- Step the simulator ,
- then press Close button at the top or in the list of trades to close given or all positions.
- You will see a red or green rectangle showing start/end of the trade...
- Repeat
Setting stop loss or take profit or limit or stop
- Make sure you bought or sold something
- Press Takeprofit button... Then click on the chart where you want the takeprofit to be . You will see a horizontal line.
- Press Stoploss button . Then click on the chart where you want the stoploss to be. You will see a horizontal line.
- Press Stop button, same as above.
- Press Limit button, same as above.
Putting orders into same group for OCO
-Press select button of each order or position you would like to be part of the same OCO group
-Press OCO button. You will see a letter appear next to each member of the group. Such A,B,C etc.
At this point, OCO is active. If any of orders or positions of that group is closed, the rest is closed too.
Removing OCO:
-Click on one of the red button which contain one letter such A, B,C ,D.. the group with that letter will be removed.
Conditional orders
They are shown in light grey in the list of trades.
To make an order conditional..
-Press "Cond" button , then press a pending order ("Limit" or "Stop")
OSO (One sends another):
-Press "Select" button of the parent limit or stop order... then press the "Select" button of the conditional order you would like to be the children..
- if you hover your mouse above "OSO" button you can see the order in which you pressed the "SELECT" buttons. The first (shown by 1) will be the parent, the rest will be the children
-Press "OSO"
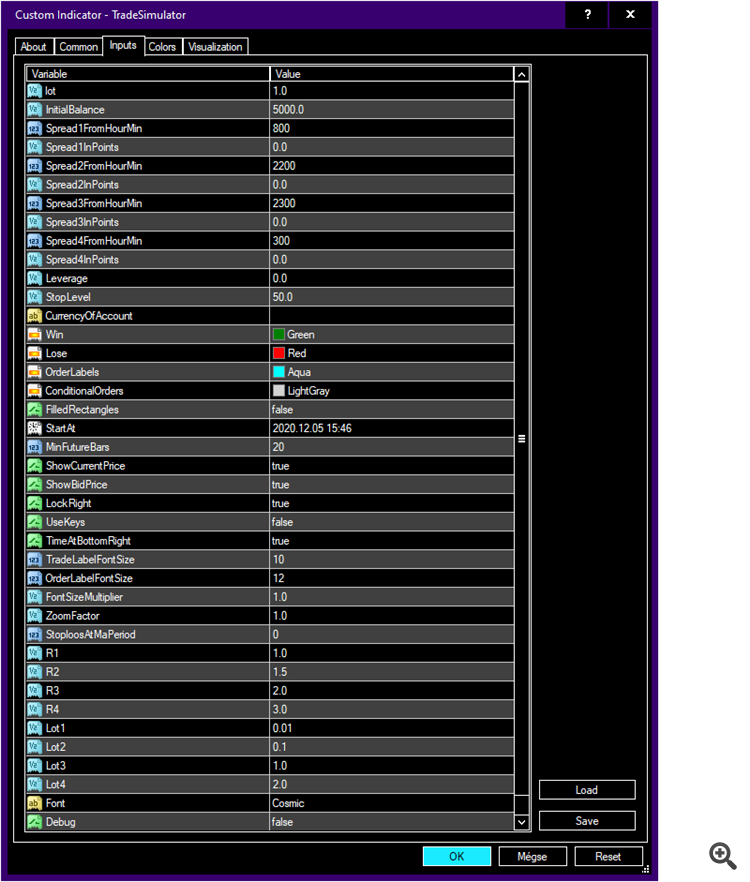
First look - Input Parameters
Lot size - you can set the initial lot size to use trade with.
Lot1,Lot2,Lot3,Lot4 - these will create 4 buttons with specified lot size.. A faster way of setting lot size
Initial balance - the simulator starts with this balance.
Spread1HourMin and Spread1In Points..etc for the current chart you can set what spreads should bed.
E.g 8:00 to 22:00.... the spread is going to be 0.
You can set the spread for 4 time periods within a day reflecting how the spread can change during the day.
Leverage - if 0, it uses default account leverage. If not zero, for the current symbol, it is going to use this leverage.
StopLevel - stop level in percentage... that is when open position will get closed if the margin level reaches that leve.
CurrencyOfAccount - if it is not filled, the simulator uses account currency of your account. Use upper 3 letter abbreviation e.g. EUR
Win - color of trades of won on the chart which are drawn as rectangles.
Lose - color of trades of lost on the chart which are drawn as rectangles.
OrderLabel - color of the text which displays information about an order... e.g open position number, pip profit/loss for stoploss.
ConditionalOrder - the color of conditional order in the list of orders/positions box.
FilledOrder - filled rectangles are shown in the chart to show the start and the end of a trade and the entry and exit price.
StartAt - start time of the simulation.... Note you cannot use a date for which their is no price data.
MinFutureBars --- on the chart, that many bars will be hidden on the right side at least. The simulator hides future candles from you.
ShowCurrentPrice -- if true, the current ASK price of the simulation is shown with a horizonal yellow line which changes as you step through the simulation.
ShowBidPrice - if true, the current BID price of the simulation is shown with a horizonal yellow line which changes as you step through the simulation.
LockRight - if true, at least MinFutureBars number of candles will be hidden at all times.. As you step, the chart will scroll left while keeping MinFutureBars on the right.
You need to set it false .. to be able to scroll the chart right. You can do that with Button "Lock RIght".... That button is the same as this input parameter.
UseKeys - if true, you can use keys to control the simulation e.g button 1
TimeAtBottomRight - it displays the time of simulation in the bottom right corner of the chart.
TradeLabelFontSize - the size of the font of the label which is displayed at the top of rectangle (which shows trade start/end and entry/exit price).
OrderLabelFontSize - the size of the font of the label of the text which displays information about an order... e.g open position number, pip profit/loss for stoploss.
FontSizeMultiplier - multiplies the size of all the fonts used by this multiplier.. Useful if you cannot see the text well at higher screen resolution.
Zoomfactor - multiplies the size of all graphical objects displayed... It can be used to magnify the user interface.
StoplossAtMaPeriod - not used
R1..R4... you can have a list of button setting the risk R to these values.
Font - font family used to display all fonts
Debug - shows more messages in expert window.. for software development
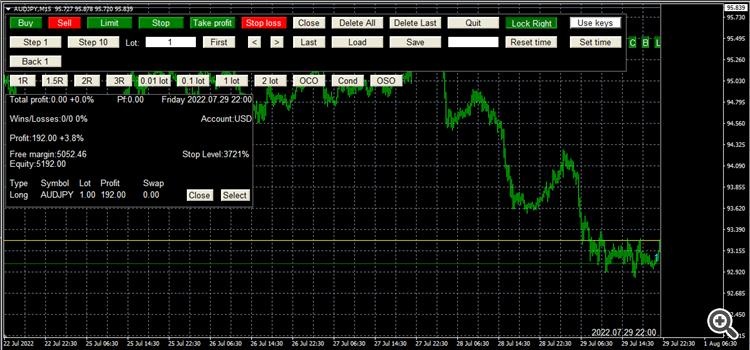
First Look - User Interface
What can you see here?
On the right side the black rectangle hides the future.
At the top...
Buy button - open a buy market order at current price(yellow horizontal line)
Sell button - open a sell market order at current price(yellow horizontal line)
Limit - open a limit order
Stop - open a stop order
Takeprofit -set the take profit of the last order or any position any time (even later on) which you selected (press "Select" button)
Stoploss -set the stop loss of the last order or any position any time (even later on) which you selected (press "Select" button)
Close - close all orders/positions
Delete all - delete history. past orders/positions from the chart.
Delete last - delete last history entry
Quit - quit the software
Lock right - same as the input parameter ,if true, at least MinFutureBars number of candles will be hidden at all times
Use keys - same as the input parameter ,if true, you can use keys to control the simulation e.g button 1
Next row of buttons from the top
Step 1 - step 1 candle forward in time in simulation
Step 10 - step 10 candles forward in time in simulation
Lot: lot size of a trade, in this case, 1 lot
First - jump to the first entry in history... it will scroll the chart to that date of the first entry.
Last - jump to the last entry in history... it will scroll the chart to that date of the last entry.
Load- load the history of the trades , use the filename that you specified in white filled rectangle/edit box.. look right.
Save- save the history of the trades , use the filename that you specified in white rectangle/edit box .. look right.
Reset time - jump back to the start of the simulation which is StartAt input parameter or the time which you specified when you pressed "Set Time" button.
Set time - set the start time of the simulation.... Reset time button will jump back here.
Back 1 - move back 1 bar in backwards in time of simulation.
Buttons with lot label.. if you press them , the lot of the next trade is set to their value.
1R,2R..buttons etc... these can be set as input parameters... When you have a trade and you set Stop loss (and not TP) of the trade, it will set TP by R.
When you have a trade and you set only TP (not SL) of the trade, it will set SL of a position or order by R.
OCO button - set a set of pending orders to be part of a One-closes-Other group.. If any order is fulfilled, the rest of the pending order are cancelled.
The usage is this. Press the select button of each pending order you want to be part of his group order, then press OCO button. Each order will get a letter, the same letter.
A letter represent a group. Uppercase letters represent OCO.
OSO button - One-Send-Another... If one order is triggered, filled, another conditional order can be activated.
The usage is this.. Select the orders which you want to be the child . then press Cond button.
Then first select the "parent", the order which triggers the rest of the orders. Then select the conditional orders. Then press OSO button.
A lowercase letter will appear for each order which are "children" , which are to be triggered.
Optionally, you can see button A,B,C,D... those buttons can remove group assignments.. that is they can cancel OSO and OCO.
On the right..
C, B and L buttons can be used to hide and to show various part of the user interface.
C hides buttons on the top.. B hides the list of trades and the statistics.
L button hides all labels on the chart...
Below these buttons, there is a list of trade box.
The list of open positions and pending (waiting and conditionals) orders are shown.
In this example, there is a long order AUDUSD, opened with 1 lot, the profit is 192 USD (without swap), swap is 0.
There are more information in that box.
We can see the total unrealized profit is 192$..which is 3.8% of the current account.
Spread 20/20.00 means the spread is 20 in points and it is equal to 20.00 dollars for current lot size which is 1 lot.
The win/loss statistics is available as well . 0/0 is 0 wins (left number) and 0 losses (right number). 0% is the % of wins compared to all trades made.
Pf 0in the top of the box is the profit factor (0).
"Account USD" .. So the account is in USD, you can set it as an input parameter.
The List of Keys
If you set Usekeys input parameter to true or you pressed Usekeys button, you can use these keys except the escape key. You can use all the time.
Escape key - you can exit any pending operation... let us say you press Stoploss to set stop loss , then you do not want to set it.. you press escape button.
B key - buy market order.
S key - sell market order.
Q key - make a limit order
E key - make a stop order
C key - close
1 key - step 1 candle forward in time
Backspace key - step 1 candle backward in the time
T - set the take profit of the selected orders/positions or the last order/position
L- set the stop loss of the selected orders/positions or the last order/position
Link to the product/Advanced Trade Formatter
MT4 version:https://www.mql5.com/en/market/product/61670
MT4 demo version:https://www.mql5.com/en/market/product/85687
MT5 version:https://www.mql5.com/en/market/product/85877
Conclusion
I hope it is clear now what the software can do.
…


