
BTCUSD: Bearish Doji Star Pattern Below $31,750
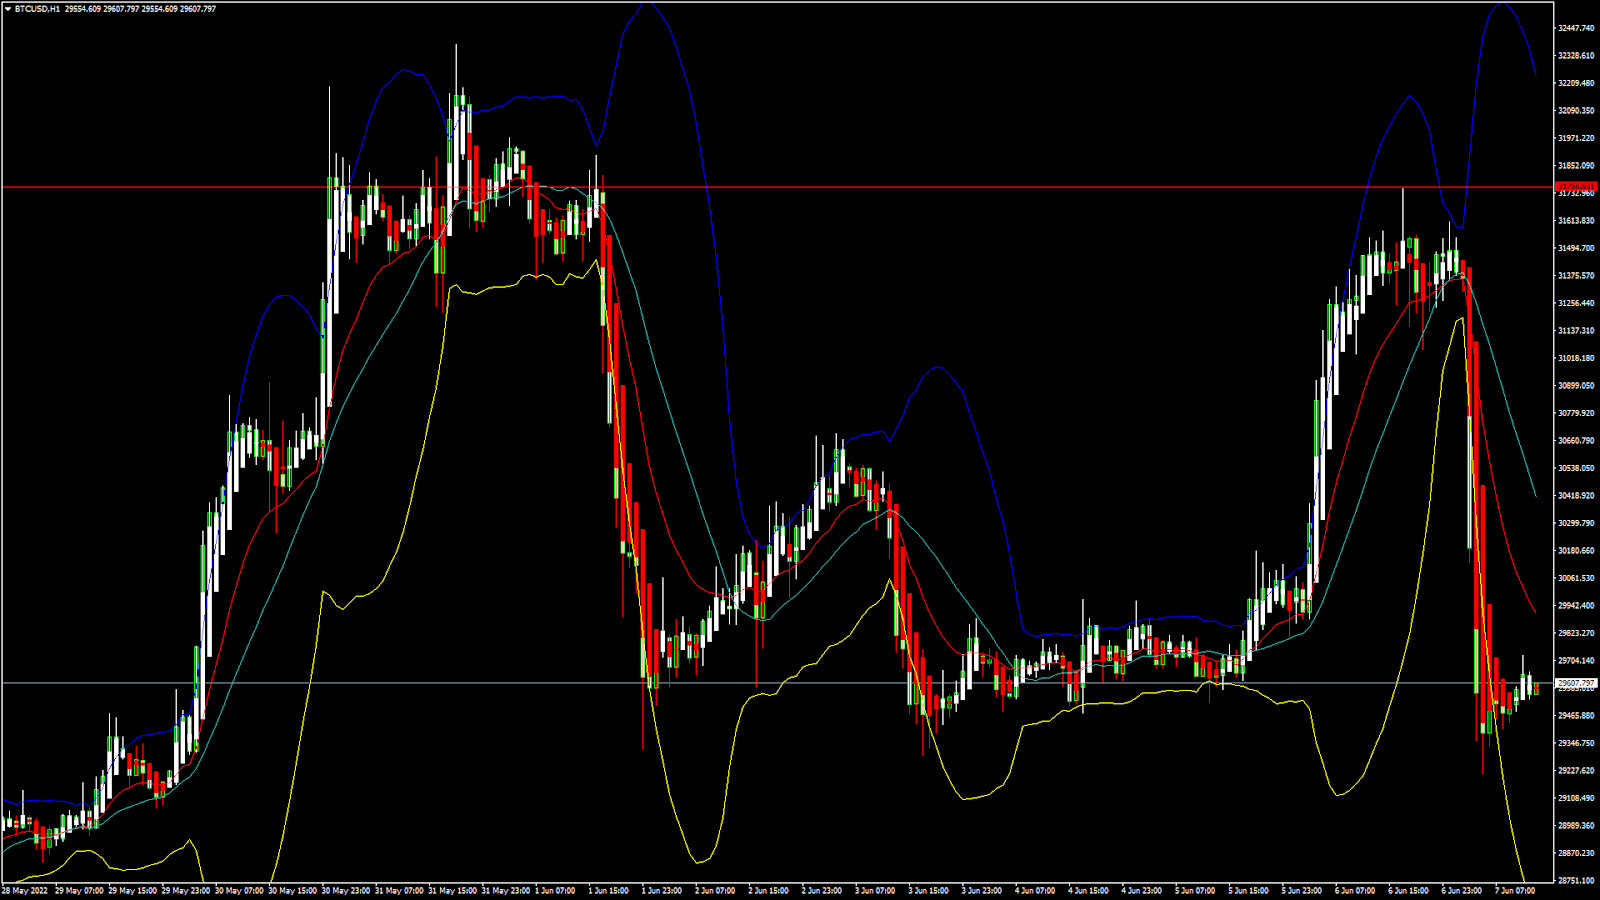
Bitcoin was not able to sustain its bullish momentum this week and after touching a high of 31,730 on 06th June, started to decline against the US dollar.
Bitcoin entered into a bearish trend channel below the $31,750 handle and continues to decline touching a low of 29,217 in the European trading session today.
We can see a weak demand for bitcoin in the medium-term range, and the prices are expected to fall further towards the $25,000 level.
We can clearly see a bearish doji star pattern below the $31,750 handle which is a bearish reversal pattern because it signifies the end of an uptrend and a shift towards a downtrend.
Both the Stoch and Williams percent range are indicating an overbought level which means that in the immediate short term a decline in the prices is expected.
The relative strength index is at 29 indicating a WEAK demand for Bitcoin at the current market levels.
Bitcoin is now moving below its 100 hourly and 200 hourly simple MAs.
All of the major technical Indicators are giving a STRONG SELL signal, which means that in the immediate short term we are expecting targets of 28,000 and 27,500.
The average true range is indicating LESS market volatility with a strong bearish momentum.
- Bitcoin: bearish reversal seen below $31,750
- The StochRSI is indicating an OVERSOLD level
- The price is now trading just below its pivot level of $29,643
- All of the moving averages are giving a STRONG SELL market signal ..More info: blog FXOpen
- Bitcoin: Bearish Reversal Seen Below $31,750


")

