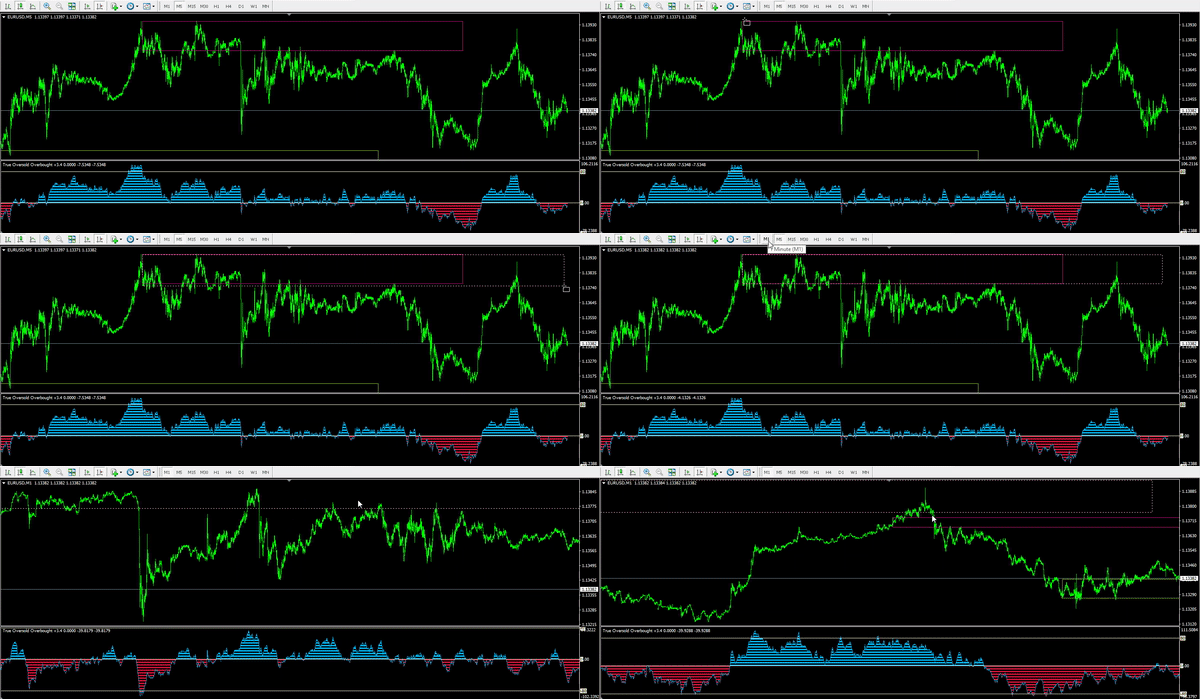
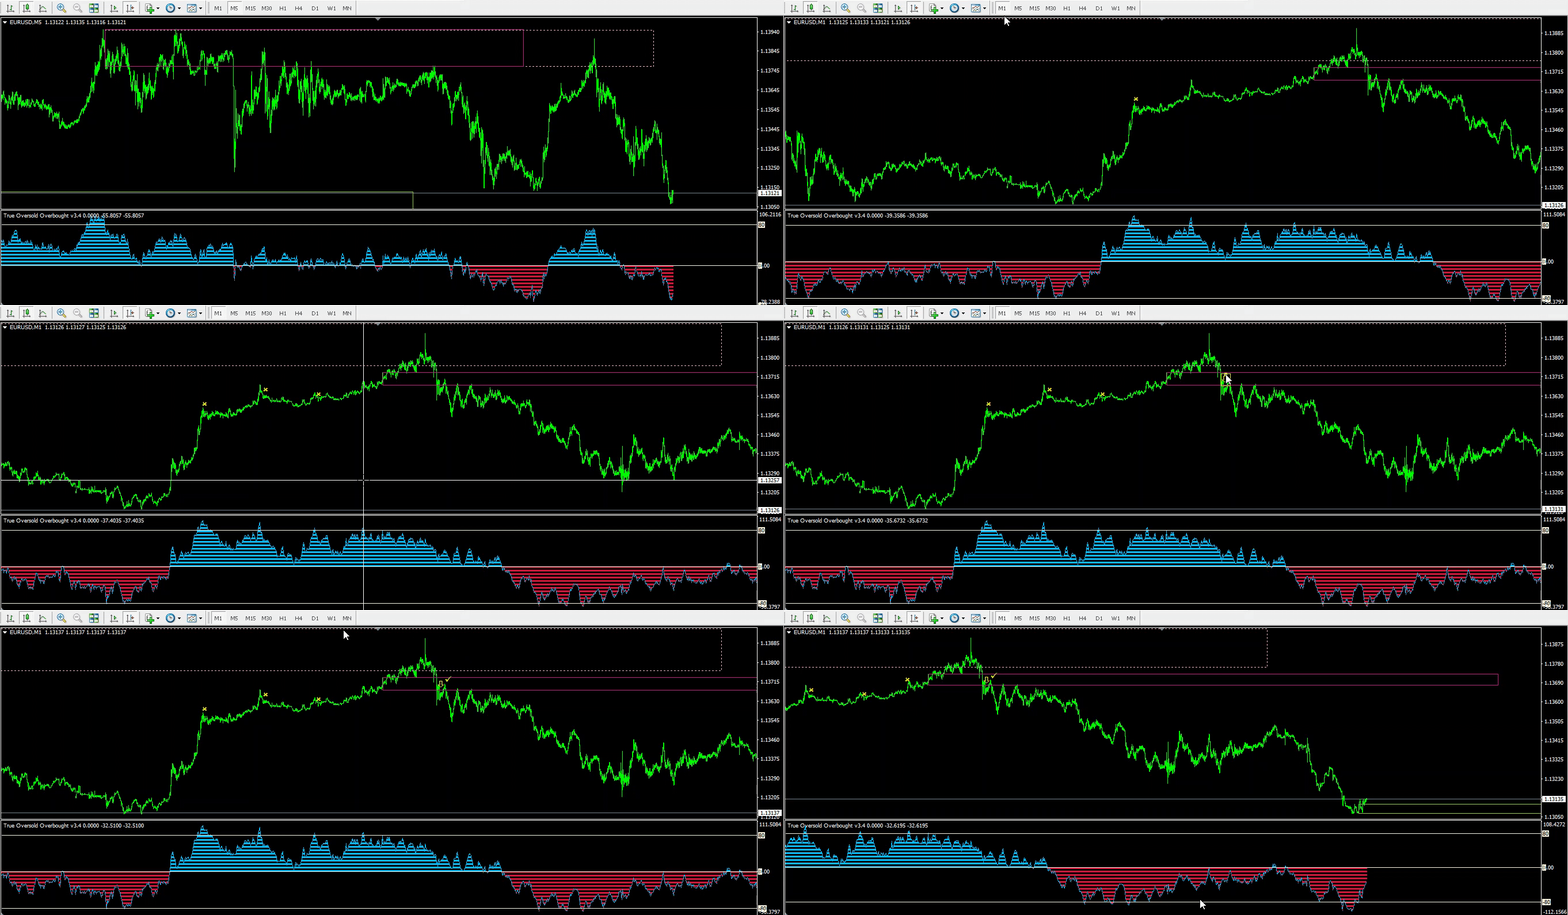
Simply, True Oversold Overbought indicator can be used as a trading system.
Step 1. Check the higher timeframe for an oversold/overbought zone.
| Timeframe to trade | Timeframe to check |
|---|---|
| 4Hr | Daily Chart |
| 1Hr | 4Hr |
| 30M | 1Hr |
| 15M | 30M |
| 5M | 15M |
| 1M | 5M |
Step 2. Set the ordinarily sell/buy level=80/-80 then trace the green/violet zone/ rectangle on the higher timeframe.
Example, if you want to trade on 1 m, trace on 5M chart.

Step 3. Move to the lower timeframe (1M chart in this case).
If you have traced the violet box (overbought box) check for overbought boxes on 1M chart that form within /near the traced 5M chart. Sell when a candle opens below the rectangle.

Step 3. Lock Profit.
Keep locking your profit above the previous high after the oversold zone forms.
Step 4. Repeat step 1 after another auto oversold/overbought zone forms in the higher timeframe.
Manual Part 1 | Manual Part 2 | Manual Part 3
Download Indicators
True Oversold Overbought (MT4)
True Oversold Overbought (MT5)
Link to MQL5 Store: https://www.mql5.com/en/users/pipmontra/seller
Subscribe to our Telegram Group | Telegram Channel for support and tips

