

Personal Chart Settings
MT4: mql5.com/en/market/product/70324
Save Changes After Remove Tool:
Changes you make to the chart, such as color and background image, can be enabled if you want to keep them after deleting the tool. These settings are useful. You can run this tool once, then delete it. All settings remain. Just enable these settings.
This setting is disabled in default mode. This means that if you run this tool and make changes to the chart, and then remove this tool from the chart, all settings will return to the previous state. To the state before running this tool
Back Ground Photo:
Choose the name of the photo.
To create a background image, you need to put a photo with the dimensions of your chart in the image folder (if you do not know exactly what to do, read the background image creation tutorial file). Then you have to put the name of the photo in a number. A number from 1 to 9. Then select the name of that photo in this section. Finally, that photo will be displayed.
So in this section, you have to choose one of the photos.
Note that at first, there are no photos. You must place a photo in the MetaTrader folder to display it.
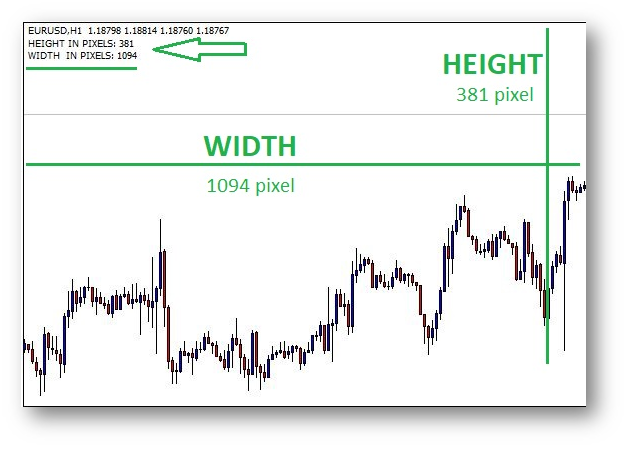
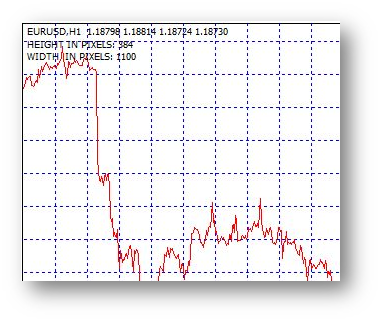
Show chart dimensions:
Enable these settings to display the dimensions of your chart.
If you enable these settings, at the top left of the chart, you will see the dimensions of your chart in pixels. These dimensions are useful for selecting photos. In order to put a background image in your chart, you need to select a photo with the dimensions of your chart. Or if you can not find a photo with the dimensions of your chart, select any photo you like and convert it to the dimensions of your chart. If you do not know how to do this, send me your photo so I can do it for you.
So these settings are useful for those who want to create a background image for themselves. If you do not know how to create a background image, read the background image help file.
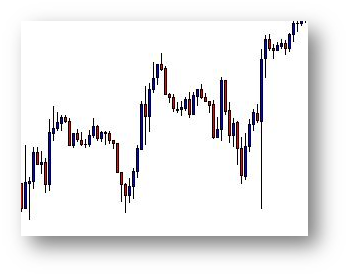
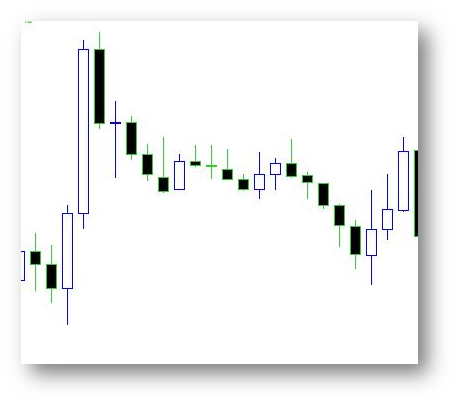
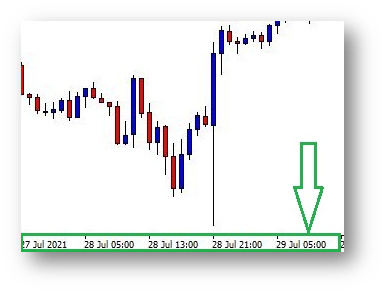
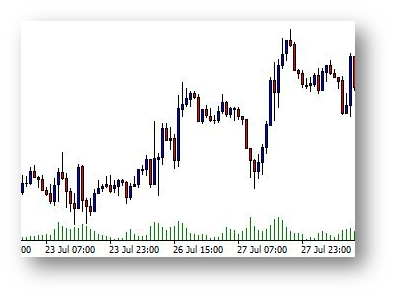
Bearish Candlestick:
Specify the color of the descending candlesticks in this section.
For example, in this image, the color of the descending candelabra is red.

Bullish Candlestick:
Specify the color of the ascending candelas in this section.
For example, the color of the ascending candlesticks in this image is blue.
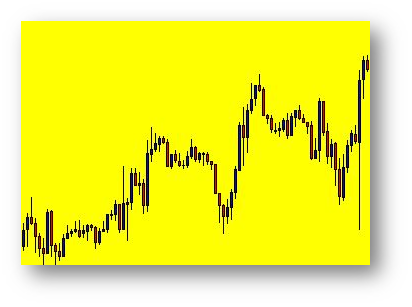
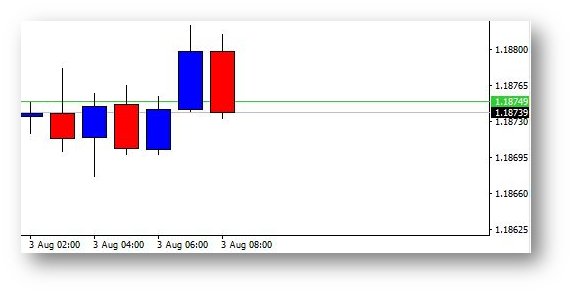
Background:
Specify the background color in this field. For example, the background color in this figure is yellow.
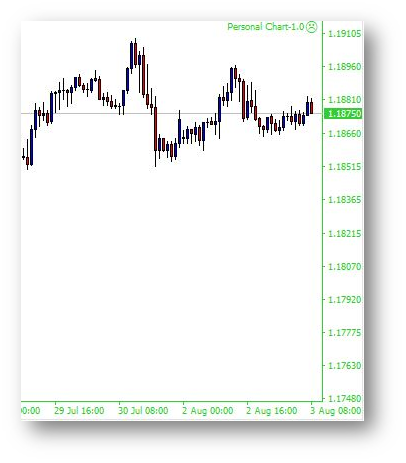
Foreground:
Color of axes, scales and OHLC line
For example, in the image below, it is green.
Shadow and Border Bearish Candle:
Color for the down bar, shadows and body borders of bear candlesticks
For example, in the figure below, this color is green.
Shadow and Border Bullish Candle:
Color for the up bar, shadows and body borders of bull candlesticks
For example, in the figure below, this color is blue.

Ask Line:
Ask price level color
For example, in the figure below, this color is green.
Bid Line:
Bid price level color
For example, in the figure below, this color is gray.

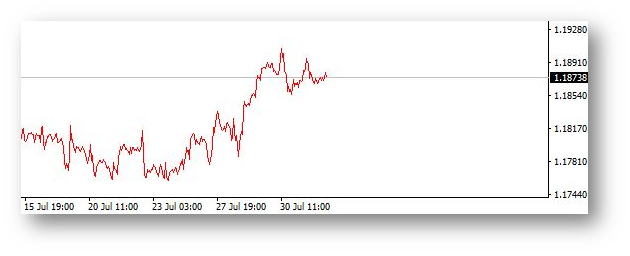
Line Chart:
Line chart color and color of "Doji" Japanese candlesticks
For example, in the figure below, this color is red.
Grid:
Grid color
For example, in the figure below, this color is blue.
Last Price Line:
Line color of the last executed deal price (Last)
Stop Order Levels:
Color of stop order levels (Stop Loss and Take Profit)
Volumes and Order Pending Levels:
Color of volumes and order opening levels
For example, in the figure below, this color is green.
Four prices at the top left of the chart:
Show OHLC values in the upper left corner
If you set these settings to false, these prices will not be visible.

Date chart at the bottom of the chart:
Showing the time scale on a chart
If you set these settings to false, these dates will not be visible.
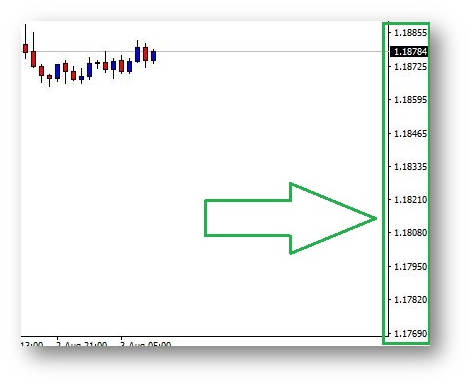
Price chart to the right of the chart:
Showing the price scale on a chart
If you set these settings to false, these prices will not be visible.
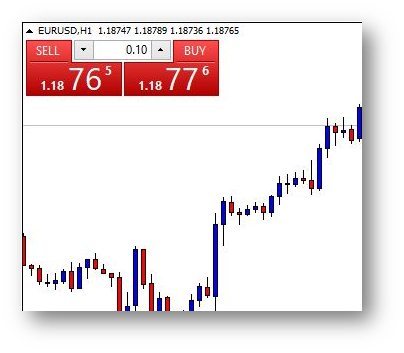
Trade panel with one click:
Show quick trading panel
If you set these settings to false, this panel will not be visible.
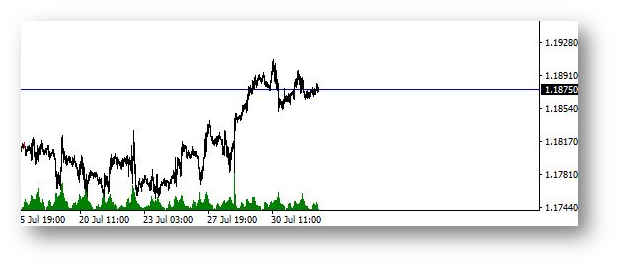
Volume lines:
Display volume in the chart
If you enable these settings, volume bars will be visible.


")