14 Indicators and auxiliary tools for convenient trading
This utility contains 14 additional tools that can be useful for certain actions of the trader, thereby simplifying and speeding up the trading process.
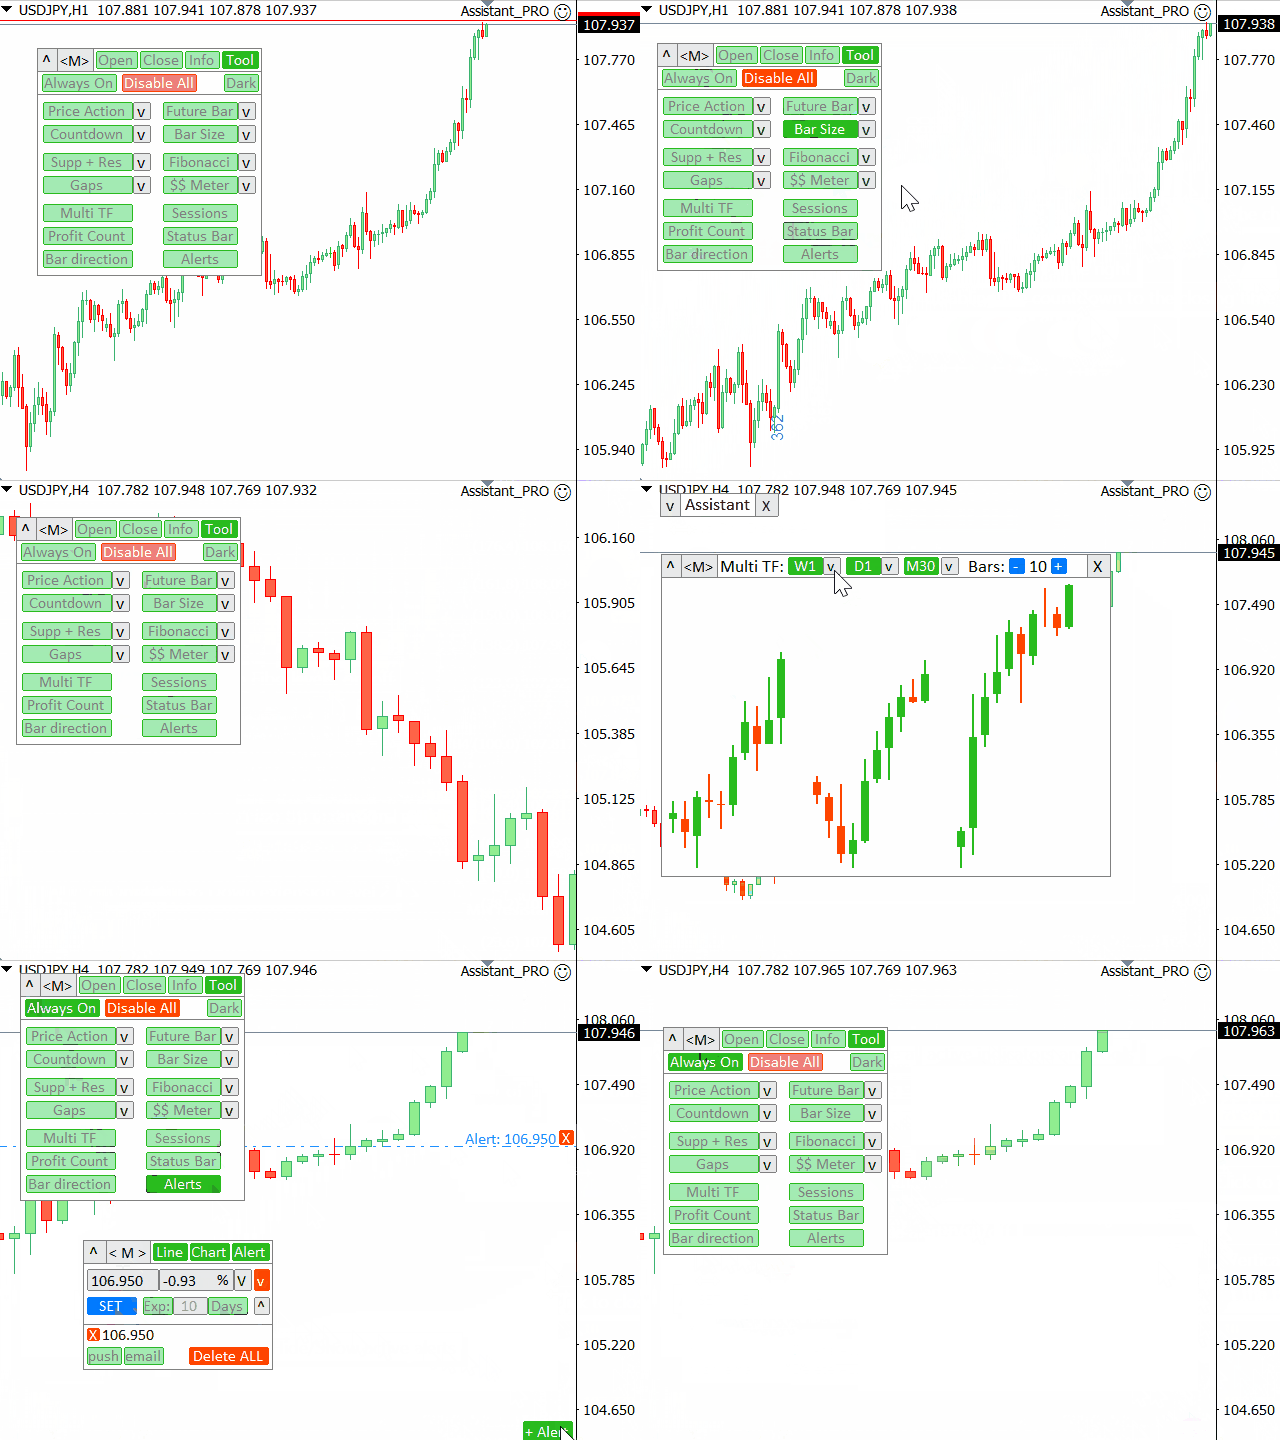
- Each of the auxiliary tools can be turned on/off individually by clicking on the corresponding green button.
- To turn off all the indicators at once, click on the [Disable All] button.
Download Indicator: https://www.mql5.com/en/market/product/54005
Demo version (USDCHF only): https://www.mql5.com/en/market/product/63886
Below I will describe each of the indicators/tools separately.
Please note that the screenshots are taken from the description of my 23-in-1 Assistant with some additional features, so in the screenshots, the top part of the panel is different (contains additional buttons).
And the entire functionality of the indicators is absolutely identical.
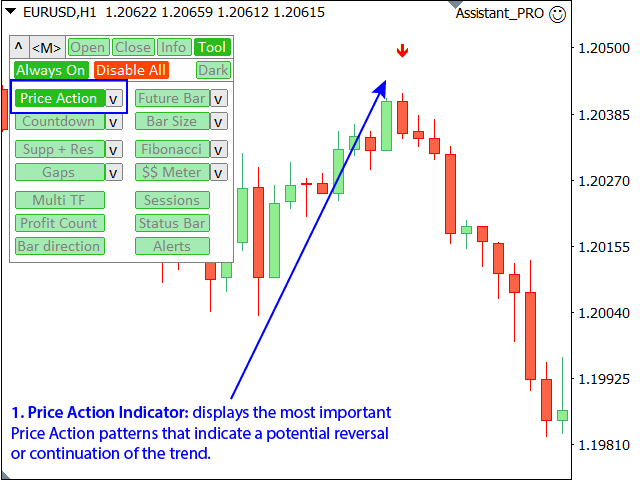
1. Price Action Indicator:
The indicator displays the most important Price Action patterns that indicate a potential reversal or continuation of the trend.
- Pin bar;
- Engulfing;
- Inside bar (Harami);
- Morning star;
- Evening star;
- Dark Cloud Cover;
- Piercing Line;
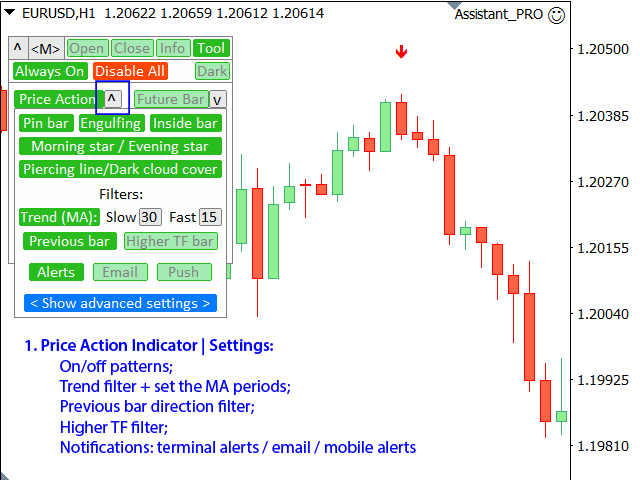
In the indicator settings ("v" button), you can:
- Disable unnecessary patterns, so that they will not be displayed.
- Enable the mode of filtering patterns by the current trend.
When this filter is activated, only the patterns that correspond to the direction of the current trend will be displayed.
The trend is determined by moving averages: their parameters can also be changed. - Enable the mode of filtering patterns in the direction of the previous bar on the current timeframe.
- Enable filtering of patterns in the direction of the last closed bar on a higher timeframe (M15 when trading on M5, H1 when trading on H1, and so on).
- Enable notifications: terminal alerts / email / to the mobile device (tothe mobile MT4 / MT5 terminal).
For the correct operation of e-mail and mobile notifications - please check the general settings of the terminal.
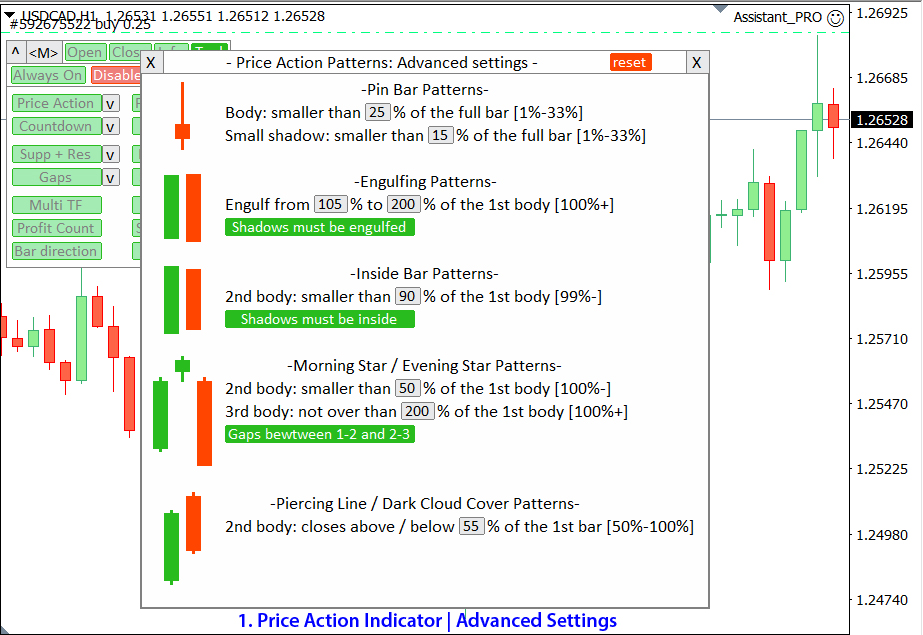
An advanced pattern setting mode is also available, which allows you to adjust the patterns for the best results:
Blue [< Show advanced settings >] button.
Advanced settings: in this mode, you can configure each of the 5 pattern types individually.
A rough visualization of what the pattern will look like is displayed on the left.
When you change the parameters, the appearance of the patterns will change.
You can always reset the settings to their original settings by pressing "reset" button (at the top of the panel).
2. Future Bar Indicator:
The indicator shows the currently forming candle of the selected time frame.
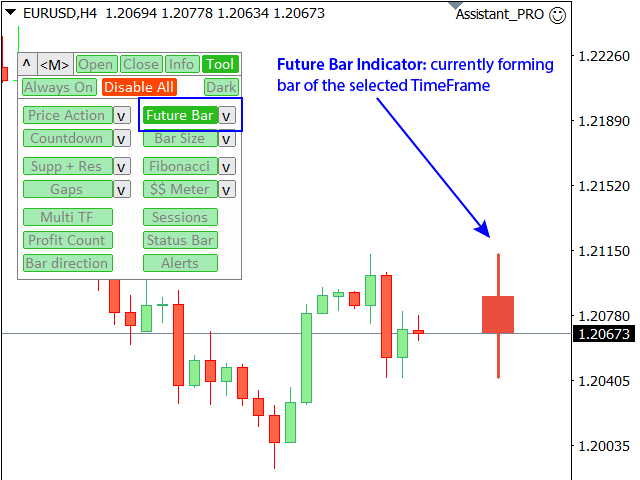
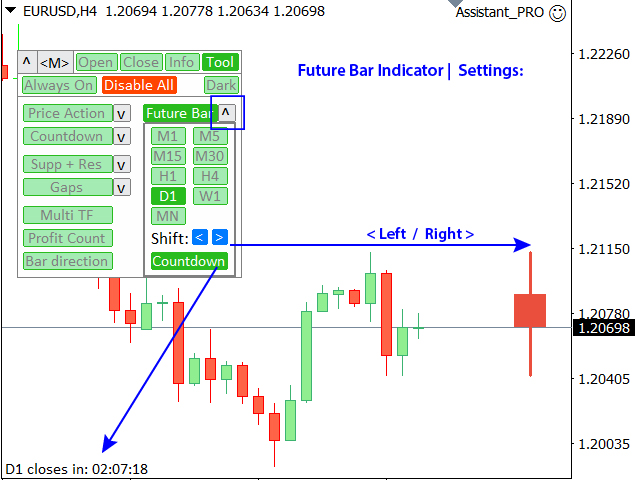
In the indicator settings ("v" button), you can:
- Select the timeframe that will be used to display the future bar;
- Using the blue "<" and ">" buttons - move the future pair to the left or right relative to the current bar on the chart;
(if you don't see the future bar after changing the chart, try zooming out the chart away and changing the bar shift). - Enable / disable the display of the countdown to the closing time of the future bar;
(the timer will be displayed at the bottom of the chart).
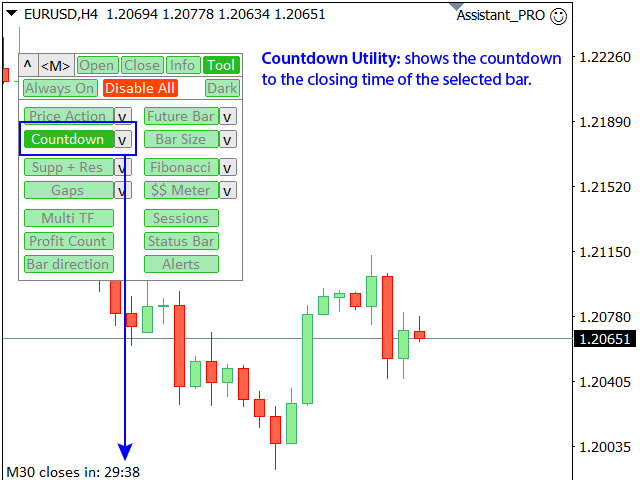
3. Countdown Utility:
The utility shows the countdown to the closing time of the selected bar.
The timer is displayed at the bottom of the chart.
The TimeFrame can be selected in the utility settings ("v" button).
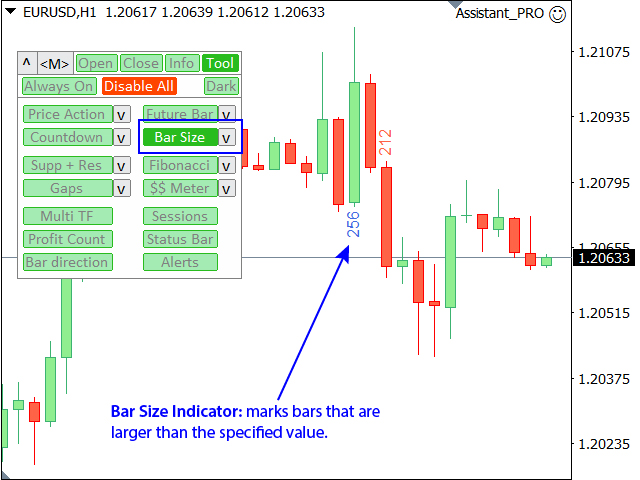
4. Bar size Indicator (marking of large bars):
In the indicator settings ("v" button): You need to set the size of the bar (in points).
All bars whose size is equal to or exceeds the specified value will be marked on the chart, indicating its size.
This indicator:
- convenient for filter patterns in a period of low volatility;
- indicates the potential beginning of a new trend;
- helps to see the most significant bars;
- can be used when trading binary options;
5. Automatic Support and Resistance levels:
The indicator displays the extremum levels of the selected time frames.
- The resistance level is the maximum price of the last closed bar;
- The support level is the minimum price of the last closed bar;
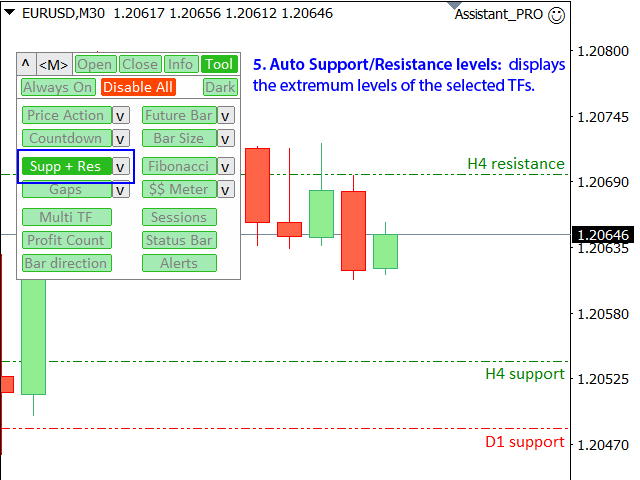
In the indicator settings ("v" button), you can set:
- Select the TimeFrames, the levels of which will be displayed on the chart, and turn off the unnecessary ones.
- Use the lower switch to select the calculation mode: Real bodies (Open/Close prices), or shadows (High/Low prices).
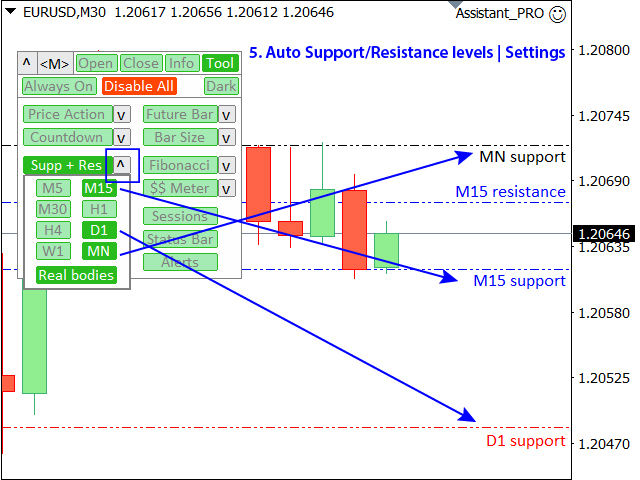
The style, thickness, and color of the lines for each time frame can be set in the initial settings of the utility.
This indicator:
- helps you see potential reversal levels;
- patterns formed near the levels may have more significance;
- when working on a lower timeframes, it allows you to see the overall picture;
6. Automatic Fibonacci levels:
The indicator automatically draws the Fibonacci levels based on the last closed bar on the selected timeframe.
The extremes (0% and 100% levels) are the High and Low prices.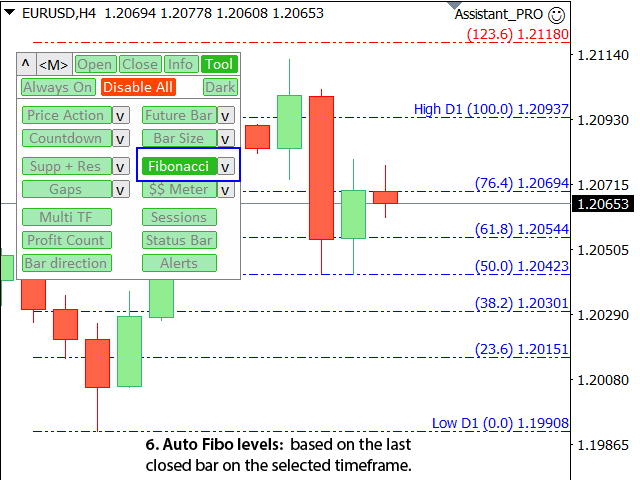
In the indicator settings ("v" button), you can:
- Set the TimeFrame that will be used for the calculation (you can also select the "Current", and the levels will be adjusted when switching the time frame of the chart).
- Customize the fibonacci levels:
a) 5 main levels: if necessary, you can disable any of them (The 0% and 100% levels will always be displayed, they cannot be disabled).
b) 6 Up extension levels: if necessary, you can disable any of them;
c) 6 Down extension levels: if necessary, you can disable any of them; - When you click on the "reset" button, you can reset the levels to their original settings (classic Fibonacci levels).
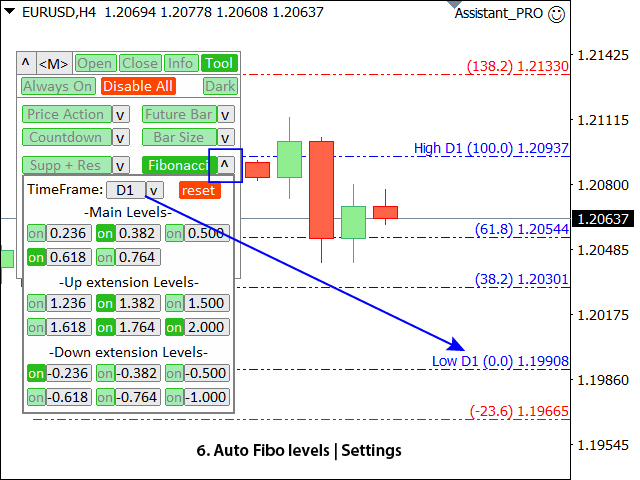
The style, thickness, and color of the lines for for each of the three Fibo level categories can be set in the initial settings of the utility.
This indicator:
- helps you see potential reversal levels;
- patterns formed near the levels may have more significance;
- significantly saves time spent on manual level plotting;
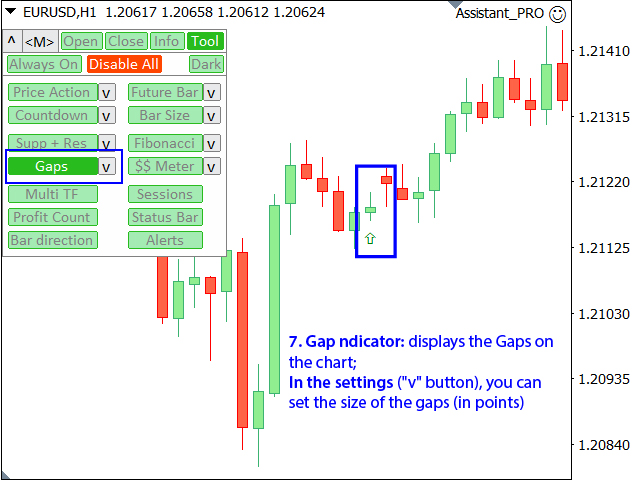
7. Price Gap Indicator:
The indicator displays the appearance of a gap on the chart (when the closing price of the previous bar differs from the opening price of the new bar).
- The size of the gap (in points): only gaps that exceed this value will be displayed.
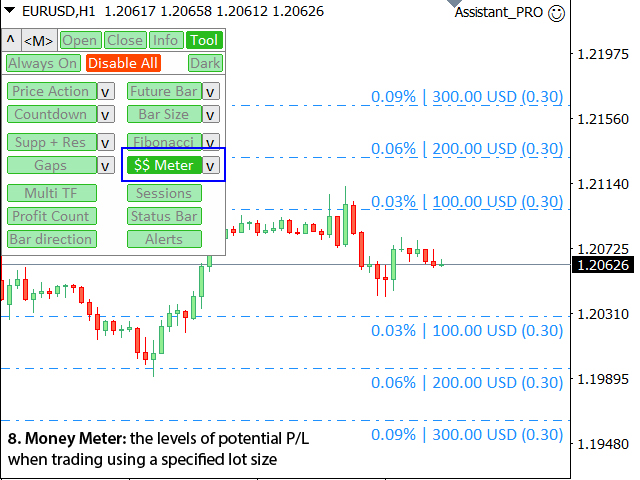
8. Money Meter [$$ Meter]:
The indicator displays the levels of potential profit/loss when trading using a given lot size.
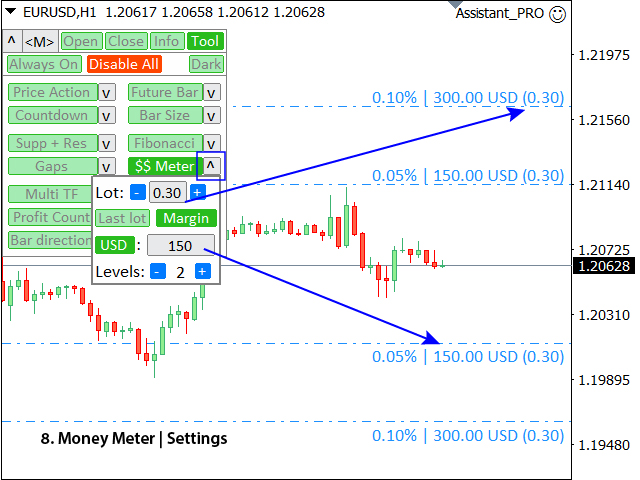
In the indicator settings ("v" button), you can set:
- Lot size (there is also an option to auto-set the last used lot);
- Grid step: percentage / amount of money (green switch);
- Number of levels for each direction;
- Risk calculation for the current account balance / or for the free margin;
The style, thickness, and color of the lines can be set in the initial settings of the utility.
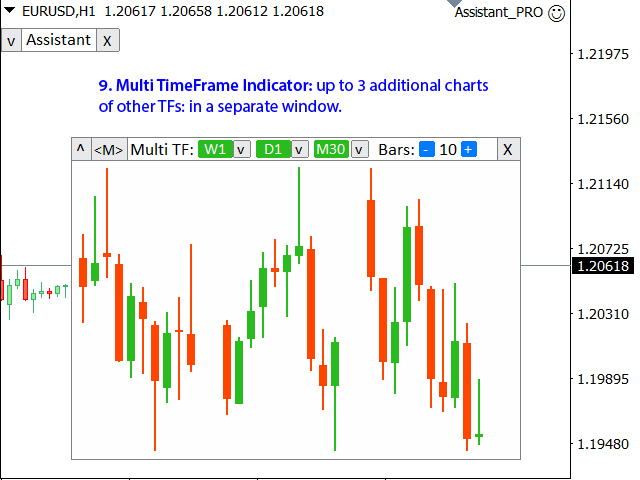
9. Multi TimeFrame Indicator:
The indicator allows you to analyze up to 3 additional charts of other timeframes, without switching the main chart.
In the window that appears, you can configure:
- The period of the 1st chart (left);
- The period of the 2nd chart (center);
- The period of the 3rd chart (right);
(Each of the timeframes can be disabled); - The number of bars for each timeframe.
Maximum number of bars:
a) With 3 active charts: 30;
b) With 2 active charts: 45;
c) With 1 active chart: 90;
The indicator opens in a separate window:
- The window can be moved to any place on the chart (using the [<M>] button).
- The window can also be minimized to save space ([<^>] button).
10. Market Sessions Indicator:
The indicator displays the working hours of the world's exchanges.
The vertical line moves as the day progresses and displays the current time, allowing you to see which markets are currently most active.
This indicator:
- Helps to select the most volatile trading instruments at the moment;
- Especially useful for intraday traders;
Displayed sessions: Sydney, Tokyo, Hong Kong, London, New York, Chicago.
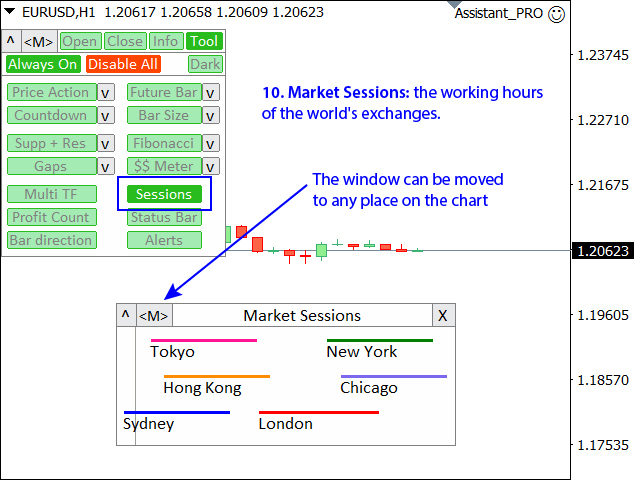
Important: for the indicator to work correctly, you need to set the broker time difference compared to Greenwich mean time: in the initial settings of the utility (the second line in the settings).
The broker's time can be found at the top of the "MarketWatch"section" (View > Market Watch [or CTRL+M]).
For example, if the broker's time is now 16:30:00 and the Greenwich mean time is now 14:30:00, the parameter value should be [2] (2 hours difference).
If the difference is negative, do not forget to specify the sign of minutes before the number (If the broker time is now 13:20:00, and Greenwich mean time is now 14:20:00, the parameter value should be [-1]).
Greenwich mean time can be found on the website: https://time.is/GMT
The indicator opens in a separate window:
- The window can be moved to any place on the chart (using the [<M>] button).
- The window can also be minimized to save space ([<^>] button).
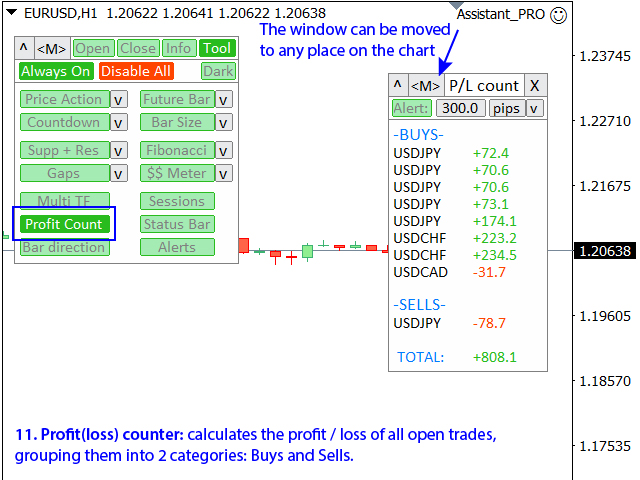
11. Profit(loss) counter:
The utility calculates the profit / loss of all open trades, grouping them into 2 categories: Buys and Sells.
The trading symbol and the floating profit are displayed.
The type of profit calculation can be selected at the top of the panel:
- pips;
- points;
- %: percentage of your account balance;
The total result for all open trades is shown below.
Using the "Alert" button, you can enable a notification that the floating profit / loss exceeds the value you set.
The utility opens in a separate window:
- The window can be moved to any place on the chart (using the [<M>] button).
- The window can also be minimized to save space ([<^>] button).
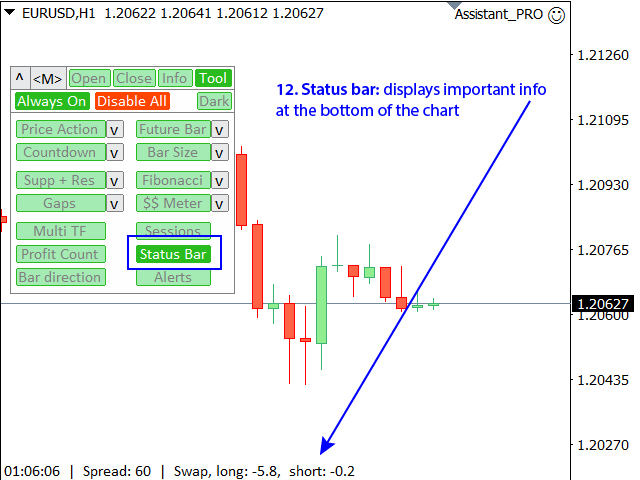
12. Status bar:
The utility displays important information at the bottom of the chart:
- Local time (on the computer);
- Current spread;
- Swap for Long trades (buys);
- Swap for Short trades (sells);
Optionally, the status of some utility functions will be shown, if they are active:
- Active automatic breakeven function, and its parameters;
- Notification of active price alerts;
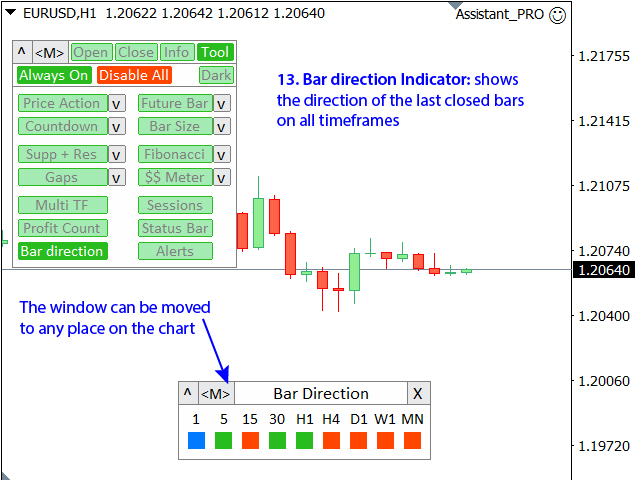
13. Bar direction Indicator:
The indicator shows the direction of the last closed bars on all timeframes.
- Red square means that the Close price is lower than the Open price (Close<Open);
- Green square means that the Close price is higher than the Open price (Close>Open);
- Blue square means that the Close price is equal to the Open price (Close=Open);
This indicator:
- Helps to see the overall market trend;
- Useful when trading binary options;
- Useful for finding corrective movements;
The Indicator opens in a separate window:
- The window can be moved to any place on the chart (using the [<M>] button).
- The window can also be minimized to save space ([<^>] button).
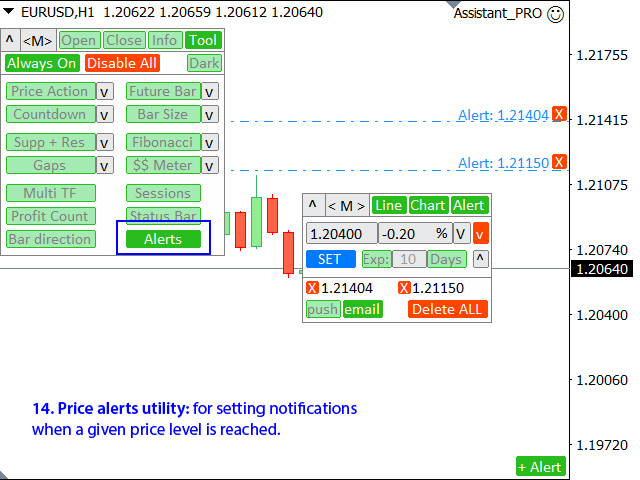
14. Price alerts Utility:
Utility for setting notifications when a given price level is reached.
The alert can be set in three ways:
- Manual entry of the price level;
- Setting the price change: in percent / in pips / in market points;
- By moving the level with the mouse: there is also a magnet function, when activated, the level will snap to the nearest OHLC values;
- Notifications in the terminal;
- Email notifications;
- Push-notifications to your mobile device;
- Option to set the alert lifetime: when activated, the notification will be automatically canceled after the specified time (minutes / hours / days);
- Option to display alert levels on the chart;
- Quickly delete all existing alerts, or delete each one individually;
Advantages of the interface:
- Option to invert the magnet while moving the alert: (press and hold the [TAB] button on the keyboard to turn the magnet on/off while moving the alert level);
- There is an option to close the main panel and leave only the quick alert button [+Alert] (in the lower right corner of the chart): [_] button when the panel is collapsed]
- The utility displays not only the price level of the alert: in the right input field, you can see the difference compared to the current price (in percent / in pips / in market points);
- Option to quickly invert the alert in the opposite direction from the current price;
The style, thickness, and color of the alert lines can be set in the initial settings of the utility.
The utility opens in a separate window:
- The window can be moved to any place on the chart (using the [<M>] button).
- The window can also be minimized to save space ([<^>] button).
A more detailed description of the functions of the alert utility is available here: https://www.mql5.com/en/market/product/56247
Download Indicator: https://www.mql5.com/en/market/product/54005
Demo version (USDCHF only): https://www.mql5.com/en/market/product/63886
Professional Assistant: includes 23 tools for a convenient trading, including this utility
If you have any comments or suggestions for improving the functionality of the utility, please contact me: https://www.mql5.com/en/users/mqlmoney


