")

Moving Average (MA)
What Is a Moving Average (MA)?
In statistics, a moving average is a calculation used to analyze data points by creating a series of averages of different subsets of the full data set. In finance, a moving average (MA) is a stock indicator that is commonly used in technical analysis. The reason for calculating the moving average of a stock is to help smooth out the price data by creating a constantly updated average price.
By calculating the moving average, the impacts of random, short-term fluctuations on the price of a stock over a specified time-frame are mitigated.
KEY TAKEAWAYS
A moving average (MA) is a stock indicator that is commonly used in technical analysis.
The reason for calculating the moving average of a stock is to help smooth out the price data over a specified period of time by creating a constantly updated average price.
A simple moving average (SMA) is a calculation that takes the arithmetic mean of a given set of prices over the specific number of days in the past; for example, over the previous 15, 30, 100, or 200 days.
Exponential moving averages (EMA) is a weighted average that gives greater importance to the price of a stock on more recent days, making it an indicator that is more responsive to new information.
Understanding Moving Average (MA)
Moving average is a simple, technical analysis tool. Moving averages are usually calculated to identify the trend direction of a stock or to determine its support and resistance levels. It is a trend-following—or lagging—indicator because it is based on past prices.
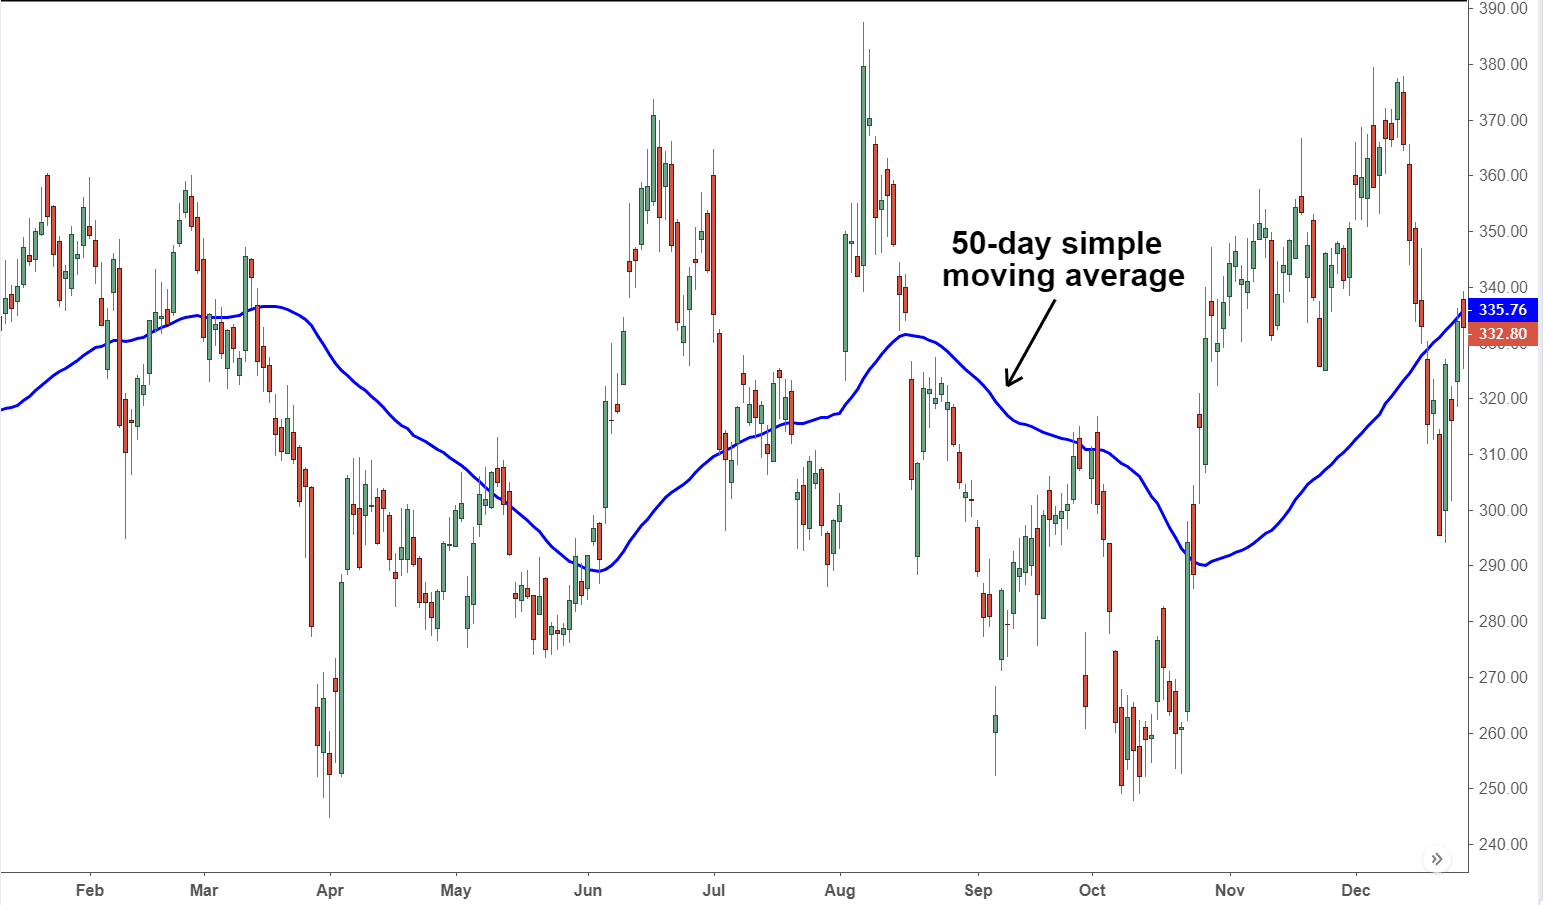
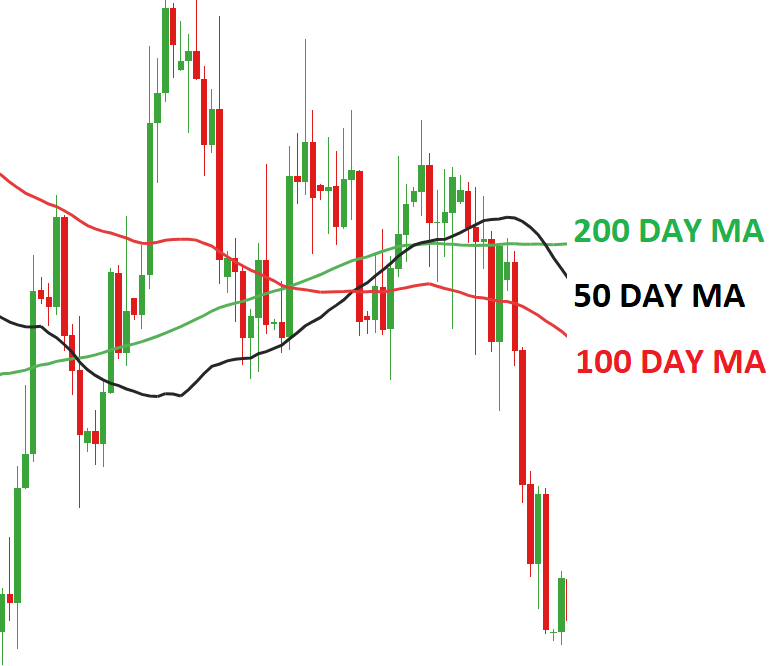
The longer the time period for the moving average, the greater the lag. So, a 200-day moving average will have a much greater degree of lag than a 20-day MA because it contains prices for the past 200 days. The 50-day and 200-day moving average figures for stocks are widely followed by investors and traders and are considered to be important trading signals.
Moving averages are a totally customizable indicator, which means that an investor can freely choose whatever time frame they want when calculating an average. The most common time periods used in moving averages are 15, 20, 30, 50, 100, and 200 days. The shorter the time span used to create the average, the more sensitive it will be to price changes. The longer the time span, the less sensitive the average will be.
Investors may choose different time periods of varying lengths to calculate moving averages based on their trading objectives. Shorter moving averages are typically used for short-term trading, while longer-term moving averages are more suited for long-term investors.
There is no correct time frame to use when setting up your moving averages. The best way to figure out which one works best for you is to experiment with a number of different time periods until you find one that fits your strategy.
Predicting trends in the stock market is no simple process. While it is impossible to predict the future movement of a specific stock, using technical analysis and research can help you make better predictions.
A rising moving average indicates that the security is in an uptrend, while a declining moving average indicates that it is in a downtrend. Similarly, upward momentum is confirmed with a bullish crossover, which occurs when a short-term moving average crosses above a longer-term moving average. Conversely, downward momentum is confirmed with a bearish crossover, which occurs when a short-term moving average crosses below a longer-term moving average.
While calculating moving averages are useful in their own right, the calculation can also form the basis for other technical analysis indicators, such as the moving average convergence divergence (MACD).
The moving average convergence divergence (MACD) is used by traders to monitor the relationship between two moving averages. It is generally calculated by subtracting a 26-day exponential moving average from a 12-day exponential moving average.
When the MACD is positive, the short-term average is located above the long-term average. This an indication of upward momentum. When the short-term average is below the long-term average, this is a sign that the momentum is downward. Many traders will also watch for a move above or below the zero line. A move above zero is a signal to buy, while a cross below zero is a signal to sell.
Types of Moving Averages
Simple Moving Average
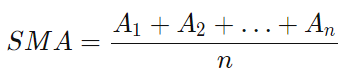
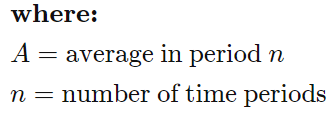
The simplest form of a moving average, known as a simple moving average (SMA), is calculated by taking the arithmetic mean of a given set of values. In other words, a set of numbers–or prices in the case of financial instruments–are added together and then divided by the number of prices in the set. The formula for calculating the simple moving average of a security is as follows:
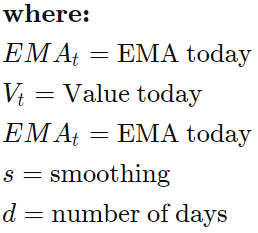
Exponential Moving Average (EMA)
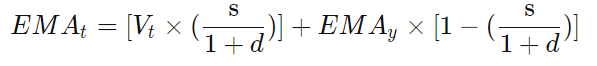
The exponential moving average is a type of moving average that gives more weight to recent prices in an attempt to make it more responsive to new information. To calculate an EMA, you must first compute the simple moving average (SMA) over a particular time period. Next, you must calculate the multiplier for weighting the EMA (referred to as the "smoothing factor"), which typically follows the formula: [2 ÷ (selected time period + 1)]. So, for a 20-day moving average, the multiplier would be [2/(20+1)]= 0.0952. Then you use the smoothing factor combined with the previous EMA to arrive at the current value. The EMA thus gives a higher weighting to recent prices, while the SMA assigns equal weighting to all values.
Simple Moving Average (SMA) vs. Exponential Moving Average (EMA)
The calculation for EMA puts more emphasis on the recent data points. Because of this, EMA is considered a weighted average calculation.
In the figure below, the number of time periods used in each average is identical–15–but the EMA responds more quickly to the changing prices than the SMA. You can also observe in the figure that the EMA has a higher value when the price is rising than the SMA (and it falls faster than the SMA when the price is declining). This responsiveness to price changes is the main reason why some traders prefer to use the EMA over the SMA.
Example of a Moving Average
Moving average is calculated differently depending on the type: SMA or EMA. Below, we look at a simple moving average (SMA) of a security with the following closing prices over 15 days:
Week 1 (5 days): 20, 22, 24, 25, 23
Week 2 (5 days): 26, 28, 26, 29, 27
Week 3 (5 days): 28, 30, 27, 29, 28
A 10-day moving average would average out the closing prices for the first 10 days as the first data point. The next data point would drop the earliest price, add the price on day 11 and take the average.
Example of a Moving Average Indicator
A Bollinger Band technical indicator has bands generally placed two standard deviations away from a simple moving average. In general, a move toward the upper band suggests the asset is becoming overbought, while a move close to the lower band suggests the asset is becoming oversold. Since standard deviation is used as a statistical measure of volatility, this indicator adjusts itself to market conditions.
email: mohamedkabesh@yahoo.com
https://www.mql5.com/en/market/product/54894


