

AW Trend Predictor combines trend and level breakout in one system. The line of the indicator follows price and shows the current trend, and a change of trend gives an entry signal.
For every signal the indicator calculates two targets, TakeProfit 1 and TakeProfit 2, and a StopLoss in one of two modes. The signal appears at the close of a bar, and the entry price is the close price of that bar.
All the signals in the history go into the statistics. The panel shows how many signals reached each target and the Success Rate of the chart, which shows on which symbols and timeframes the signals work better.
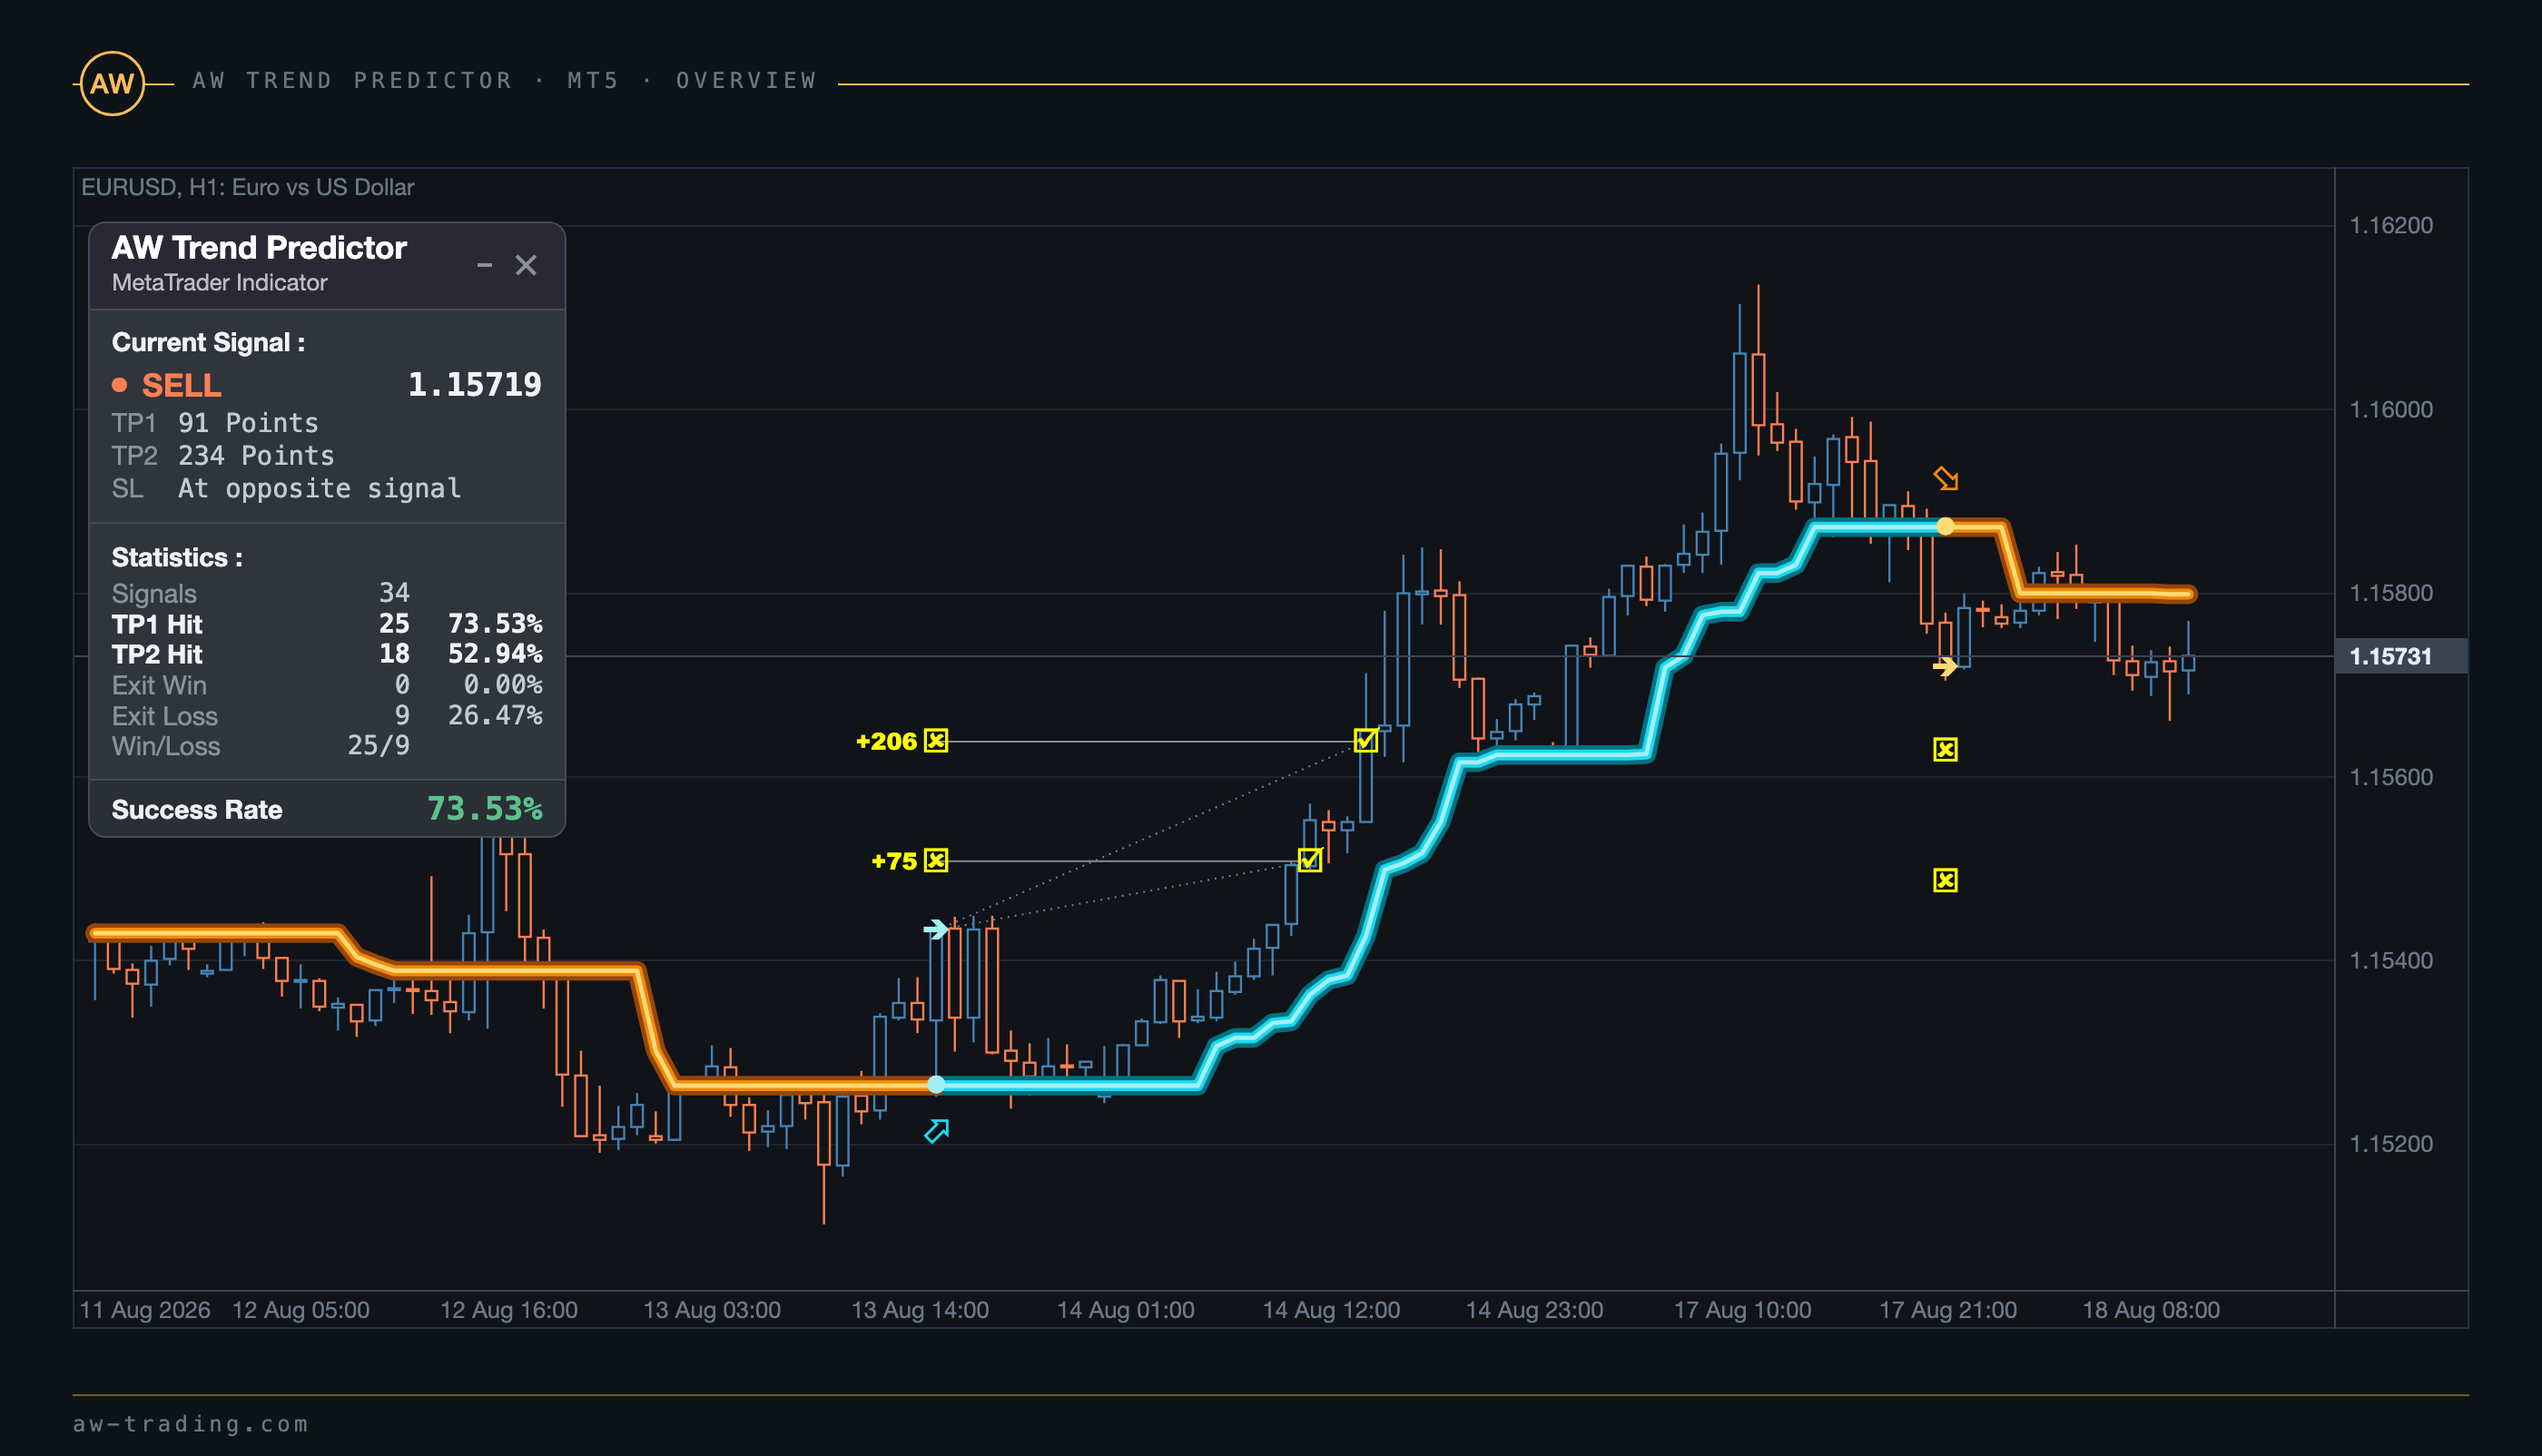
All the charts in the article are real quote history and what the indicator showed on it without any change of settings. The MT4 and MT5 versions calculate the signals the same way, and the differences in the names of a few variables are listed in section 9.
Product links: MT5 version and MT4 version. The indicator comes with the multi-currency panel AW Trend Pad, section 8.
The article contains the following sections:
- What the indicator shows on the chart
- The panel of the indicator
- How to buy
- How to sell
- StopLoss: two modes
- Multi-timeframe use
- Notifications
- AW Trend Pad
- Input settings of AW Trend Predictor
- Input settings of AW Trend Pad
- For developers
1. What the indicator shows on the chart
The trend line. In an uptrend the line runs below price, in a downtrend above price. The line trails price in steps and turns around when the trend has changed. The reversal bar is the signal bar.
The signal. On the reversal bar a round marker appears on the line together with a hollow direction arrow, and an entry arrow appears at the close price of the bar. The indicator looks for signals only on closed bars: while a bar is forming, there is no signal on it.
The targets. On the signal bar two squares mark the TP1 and TP2 levels. The distance to the targets depends on the volatility of the recent bars and on the Multiplier of target variable. When price has reached a target, a check mark appears on that bar, a level line runs to it from the signal bar, and the result in points, +178 for example, is written to the left of the signal bar. The points are counted from the entry price.
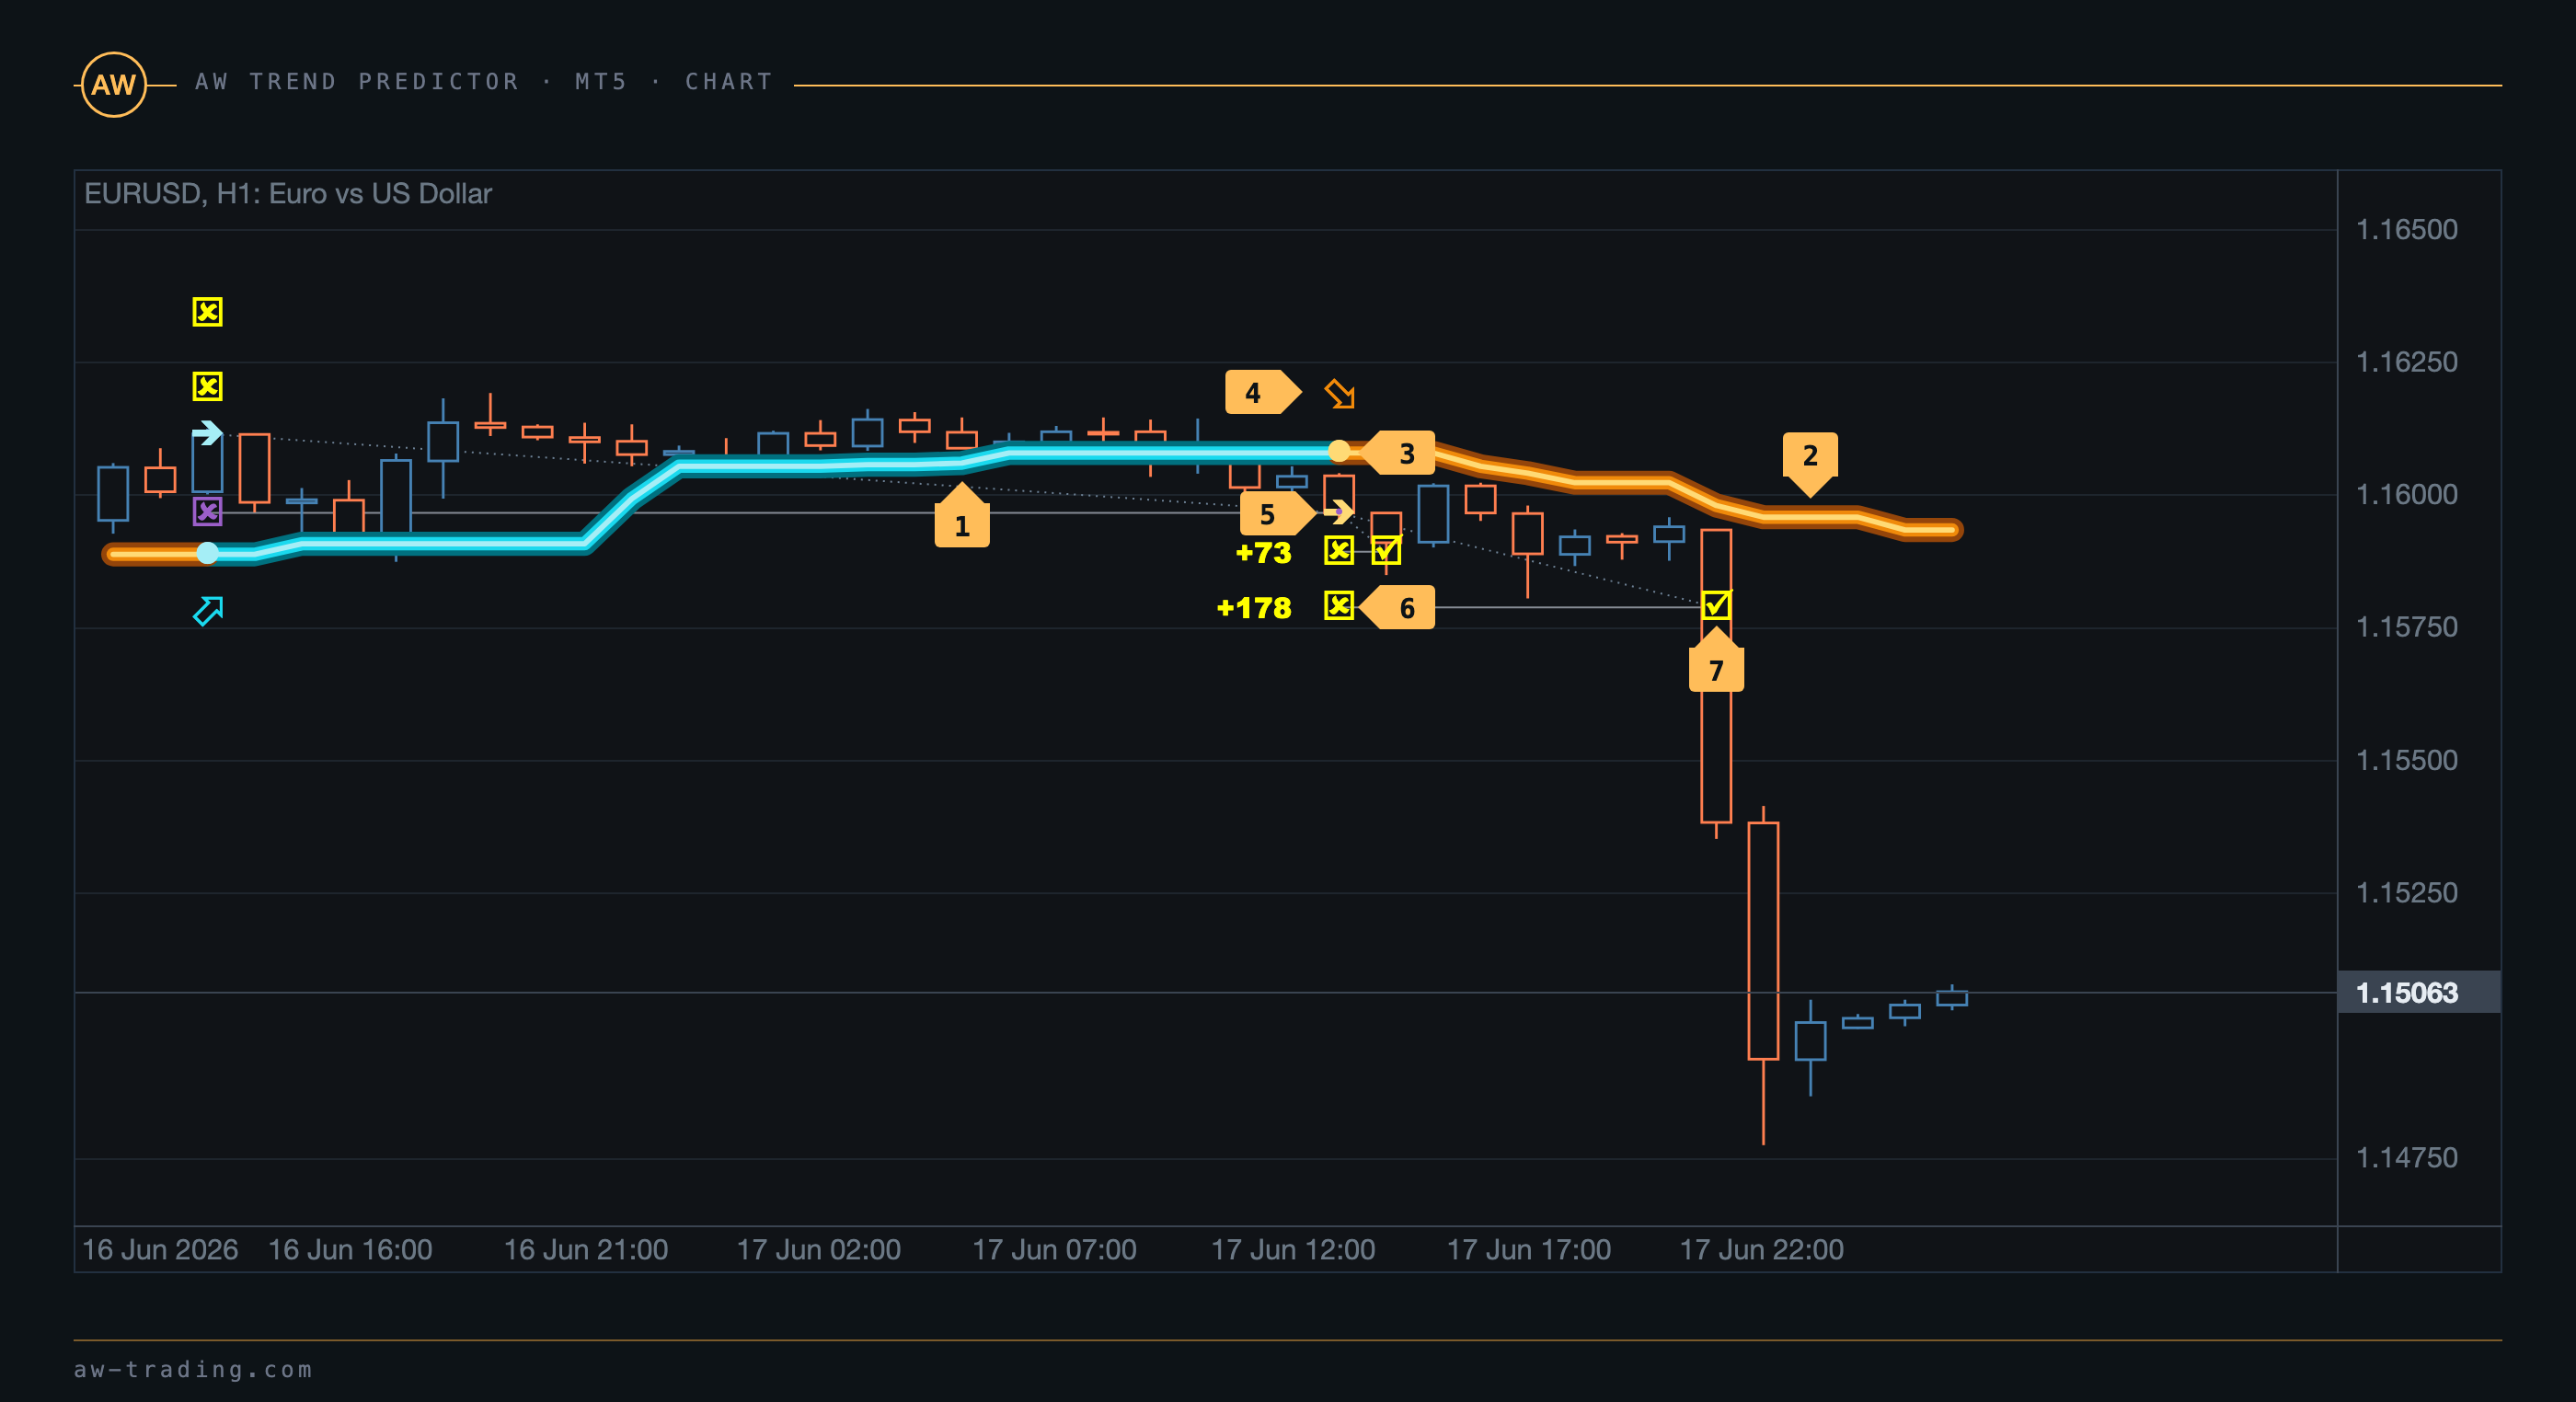
| No. | On the chart |
|---|---|
| 1 | The uptrend line. |
| 2 | The downtrend line. |
| 3 | The round marker: the reversal bar, the signal appeared on it. |
| 4 | The hollow arrow of the signal direction: down is a sell, up is a buy. |
| 5 | The entry arrow at the close price of the signal bar. |
| 6 | The TP1 and TP2 levels on the signal bar. |
| 7 | The target is reached: the mark on the bar where price reached the level, the level line and the result of +178 points to the left of the signal bar. |
The color of the line. The Color scheme for lines variable sets the color of the line, the arrows and the markers with one scheme. Each scheme is picked so that the line reads both on a dark chart and on a white one.
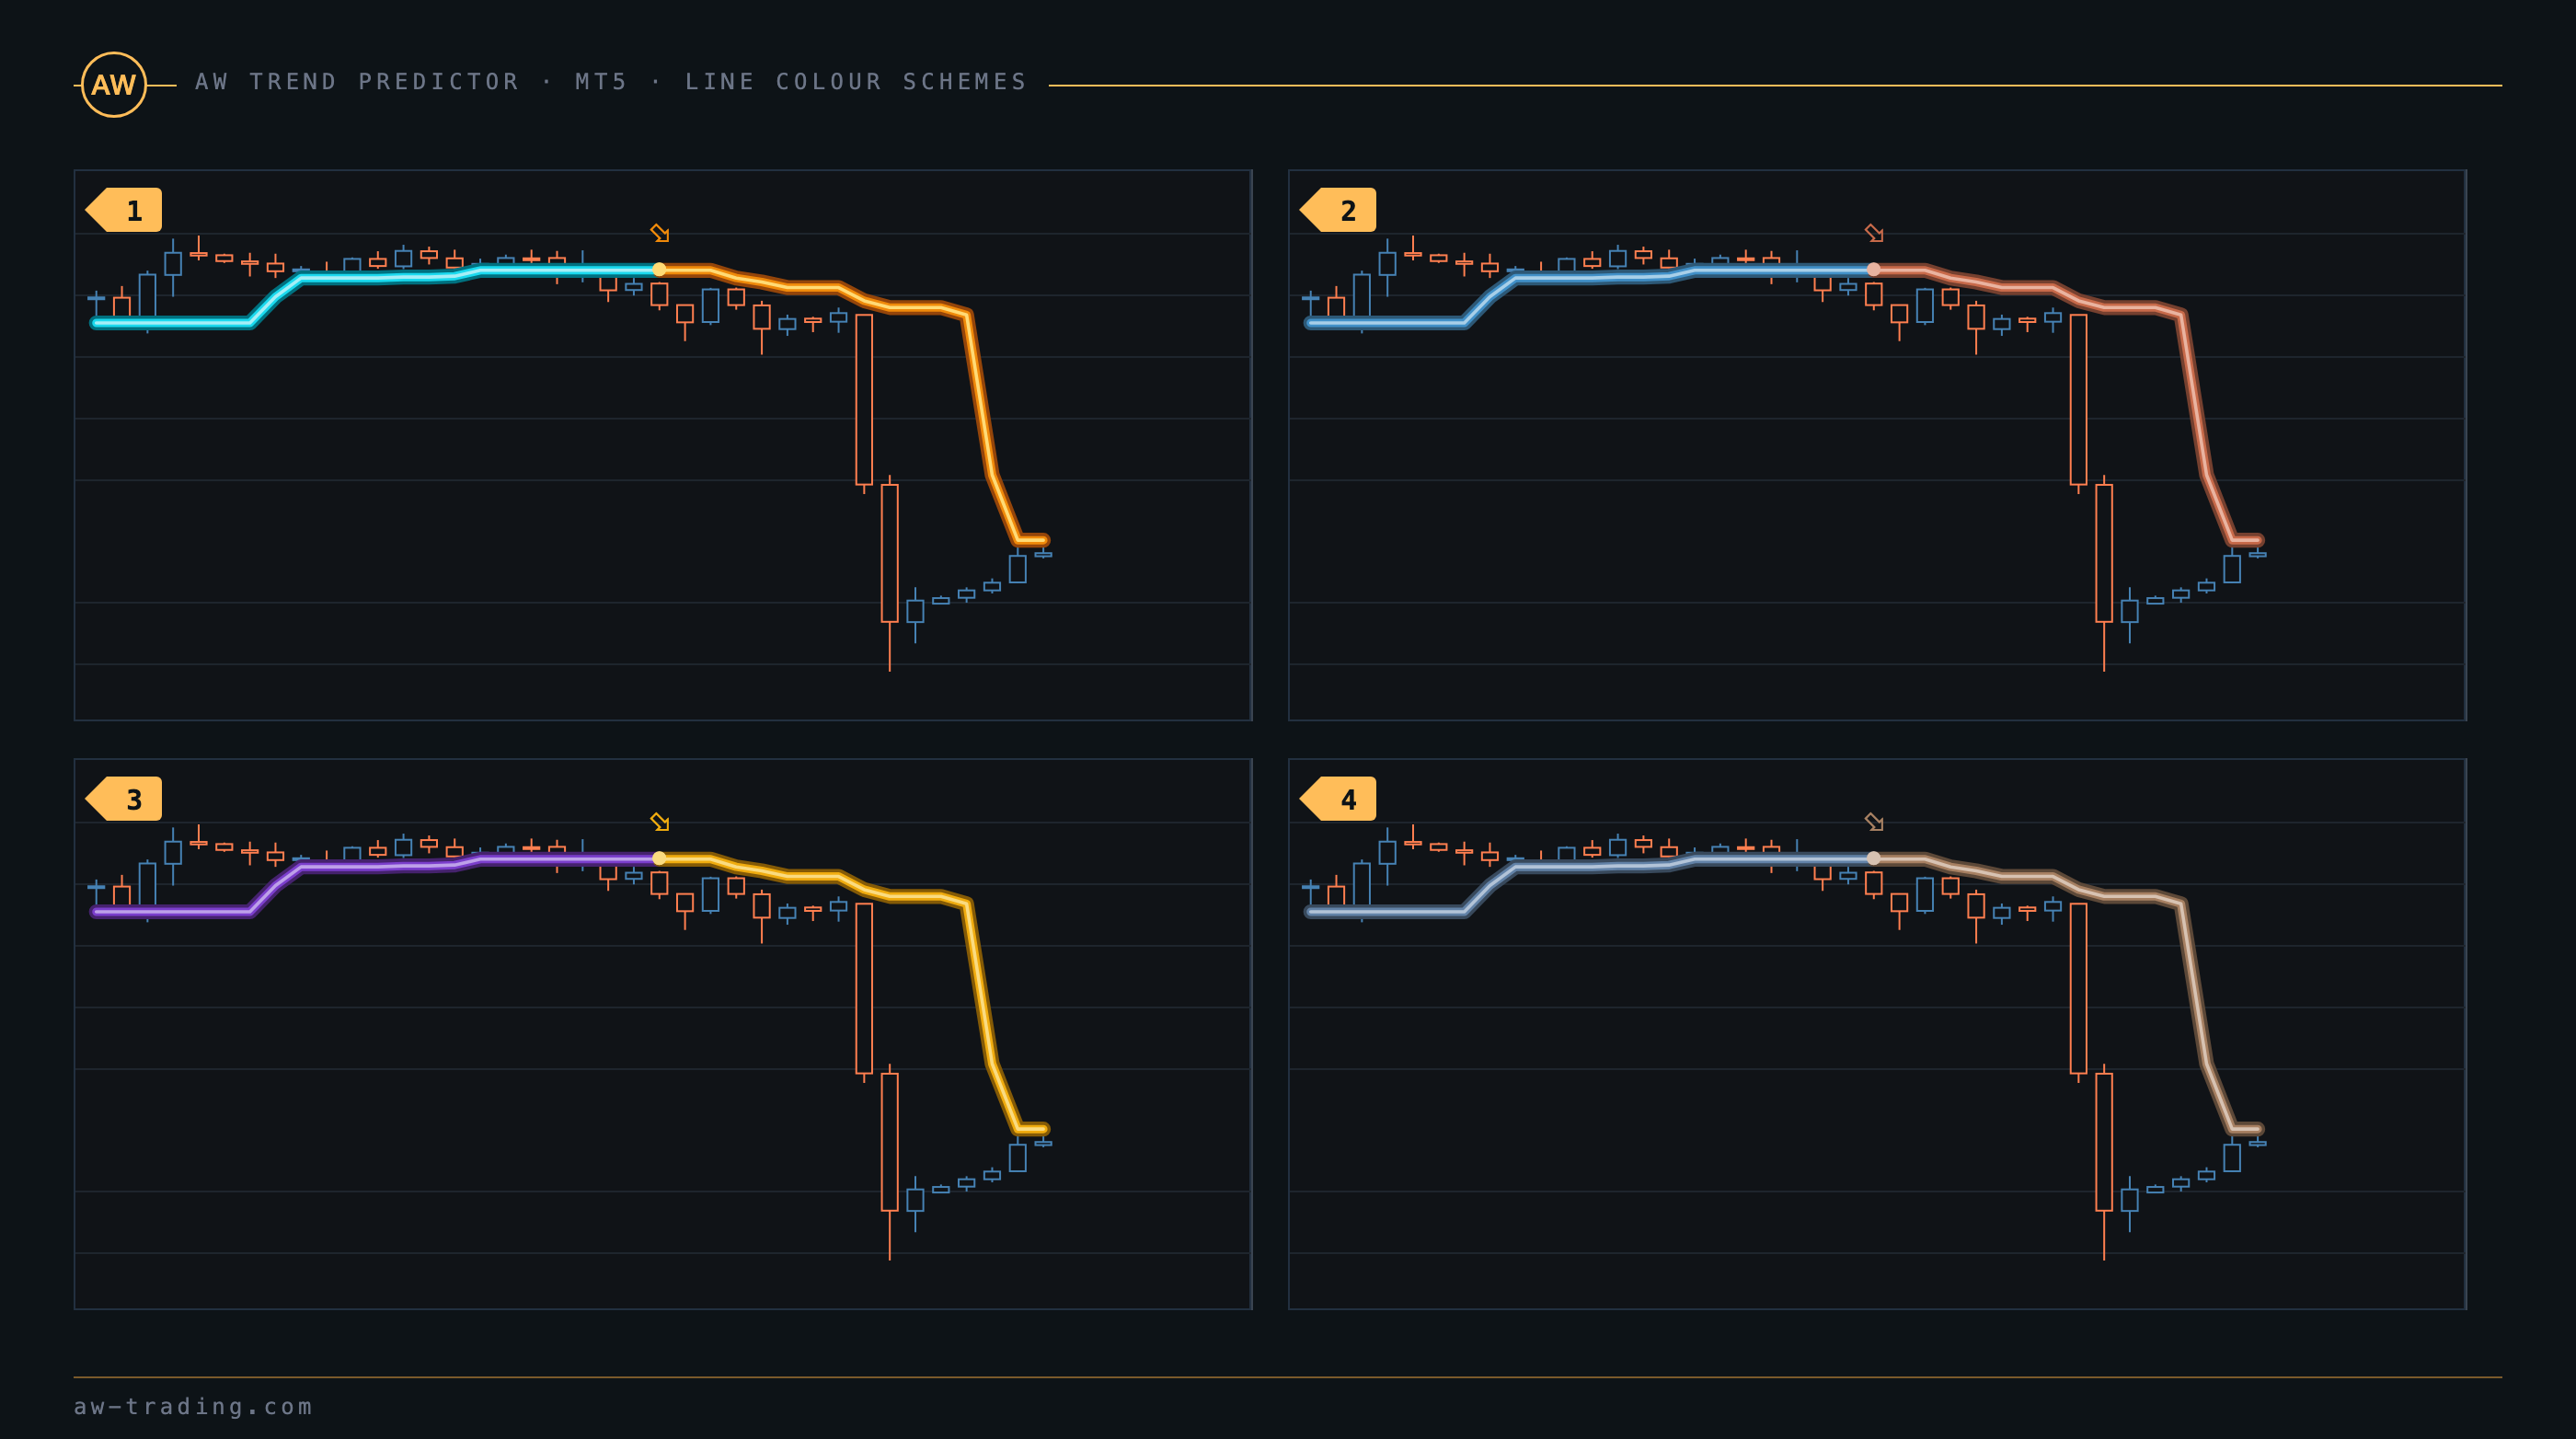
| No. | Scheme | When to choose it |
|---|---|---|
| 1 | Neon | Turquoise and orange. The most visible line. |
| 2 | Steel | Blue and terracotta, half the saturation. For a chart that carries other indicators as well. |
| 3 | Amethyst | Purple and amber. Does not compete in color with green and red candles. |
| 4 | Graphite | An almost grey line, for a chart that already has a lot of markup on it. |
The Custom scheme takes its colors from the variables with the Custom prefix in the GRAPHICS SETTINGS section. The thickness of the line is set by Lines thickness: Thin lines, Medium lines or Bold lines. The color of the target labels follows the panel scheme: yellow with the dark scheme, deep gold with the light one, which reads on a white chart.
2. The panel of the indicator
The panel sits in the upper left corner of the chart and shows the last signal, its targets and the statistics of the chart.
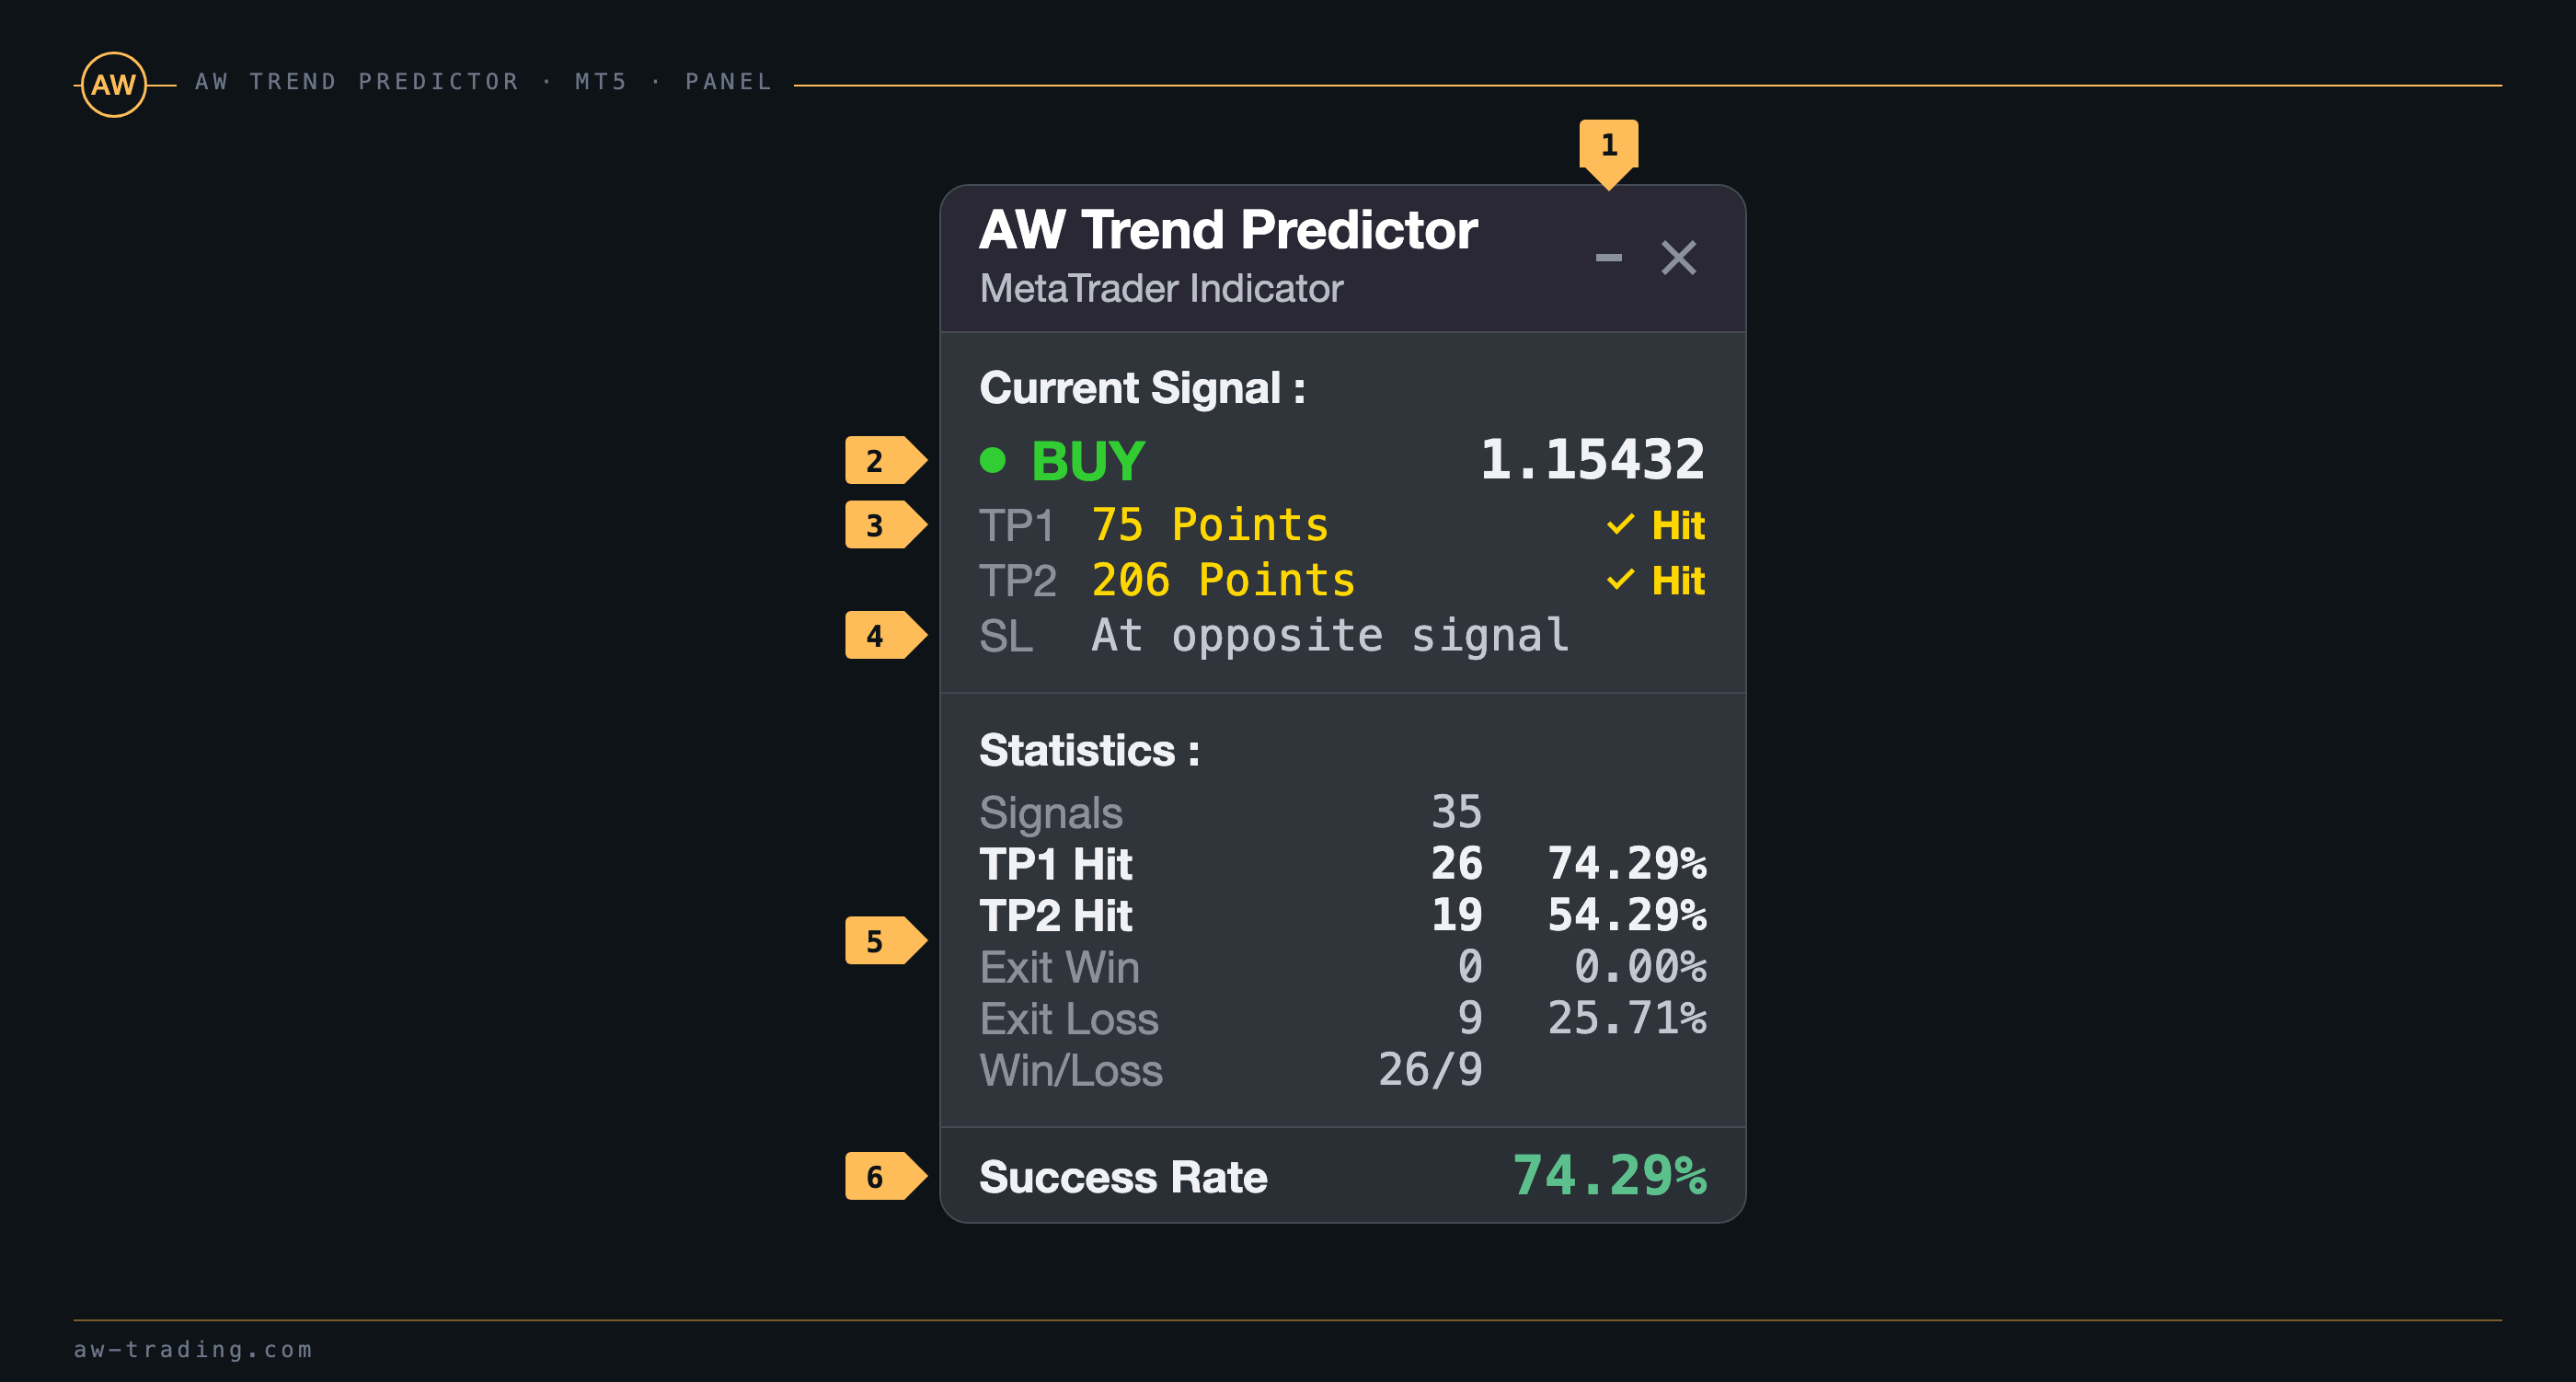
| No. | Panel block |
|---|---|
| 1 | The window buttons. The dash collapses the panel. The cross removes the indicator from the chart on the second click: the first click turns the cross red, and a second click within four seconds confirms it. |
| 2 | Current Signal. The direction of the last signal, BUY or SELL, and its price - the close price of the signal bar. The LED on the left is in the color of the trend: green for a buy, coral for a sell. |
| 3 | TP1 and TP2. The distance to the targets in points from the signal price. When price has reached a target, the value is colored and the Hit mark appears to the right of it. |
| 4 | SL. In the SL at opposite signal mode the line reads At opposite signal, in the Dynamic StopLoss mode - the distance to the stop in points. |
| 5 | Statistics. The counters of the signals in the history, the lines are described in the table below. |
| 6 | The Success Rate of the chart. |
| Line | What it counts |
|---|---|
| Signals | The number of signals in the calculated history. The history depth is set by Maximum bars. All the percentages below are counted from this number. |
| TP1 Hit | The signals that reached the first target: the number and the percentage of Signals. |
| TP2 Hit | The signals that reached the second target. |
| Exit Win | The signals closed by an opposite signal in profit before the first target was reached. |
| Exit Loss | The signals closed by an opposite signal at a loss. In the Dynamic StopLoss mode the signals closed at the stop go here as well. |
| Win/Loss | Profitable signals against losing ones: TP1 Hit + Exit Win against Exit Loss. |
| Success Rate | The share of signals that reached TP1 or were closed by an opposite signal in profit: TP1 Hit % + Exit Win %. |
The statistics are recalculated on every new signal. They differ from symbol to symbol and from timeframe to timeframe, so the Success Rate is read on the chart where the trade will be taken.

| No. | The collapsed panel |
|---|---|
| 1 | The name. The collapsed panel sits in place of the full one and covers almost none of the chart. |
| 2 | The button that expands the panel back. |
| 3 | The LED in the color of the current trend: the direction of the last signal is visible in the collapsed state as well. |
The look of the panel is set by the variables of the GRAPHICS SETTINGS section: Color scheme for panel - the dark or the light scheme, Panel size and Font size - the size of the panel and of the font. Set to Auto, the panel size is picked by the screen DPI, and the font size follows the panel size. Show panel in the DEVELOPERS SETTINGS section hides the panel altogether.
3. How to buy
Step 1 - A buy signal has arrived with a Success Rate of 70% or higher.

| No. | In the frame |
|---|---|
| 1 | A buy signal on a closed bar. EURUSD H1, the bar of 13 August 2026, 15:00. |
| 2 | The TP1 and TP2 levels of this signal. |
| 3 | Current Signal: BUY, the entry price of 1.15432, 75 and 206 points to the targets. |
| 4 | The Success Rate of the chart is 74.29%, the condition of the step is met. |
Step 2 - Choosing the StopLoss mode: on the opposite signal or dynamic.
The "StopLoss Mode" variable is located in the input settings in the "MAIN SIGNAL SETTINGS" section, in the MT4 version - in the "MAIN SETTINGS" section. Both modes are described in section 5.
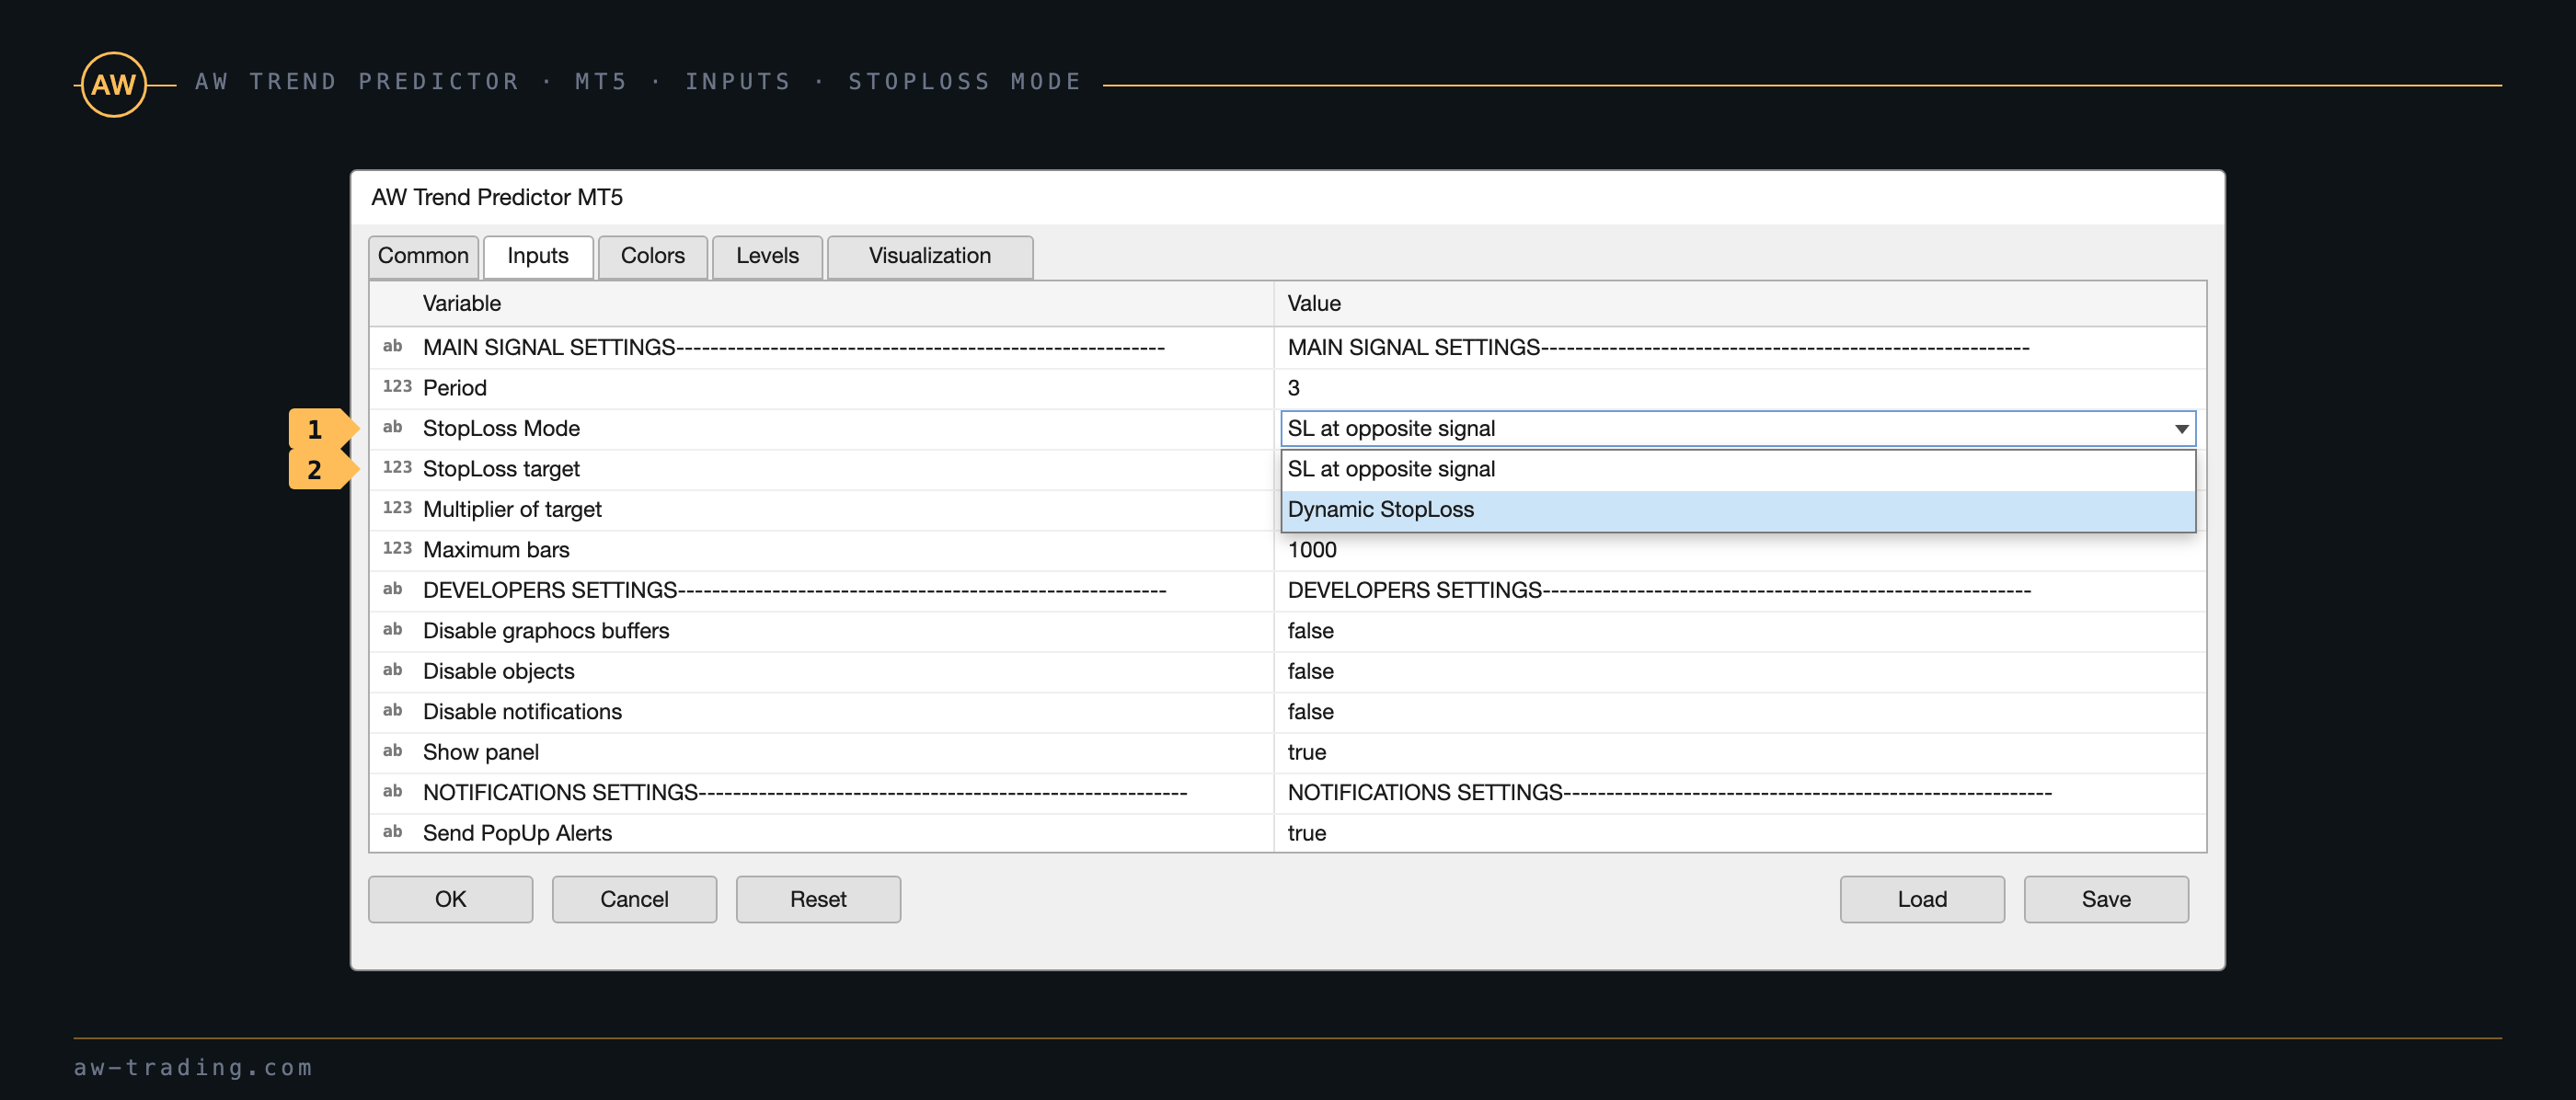
| No. | Variable |
|---|---|
| 1 | StopLoss Mode: SL at opposite signal or Dynamic StopLoss. |
| 2 | StopLoss target: the distance to the stop in the Dynamic StopLoss mode. |
Step 3 - Choosing the TakeProfit strategy. The frames of the three strategies show the same EURUSD H1 buy trade at different moments.
Strategy 1: closing the whole position at TP1.
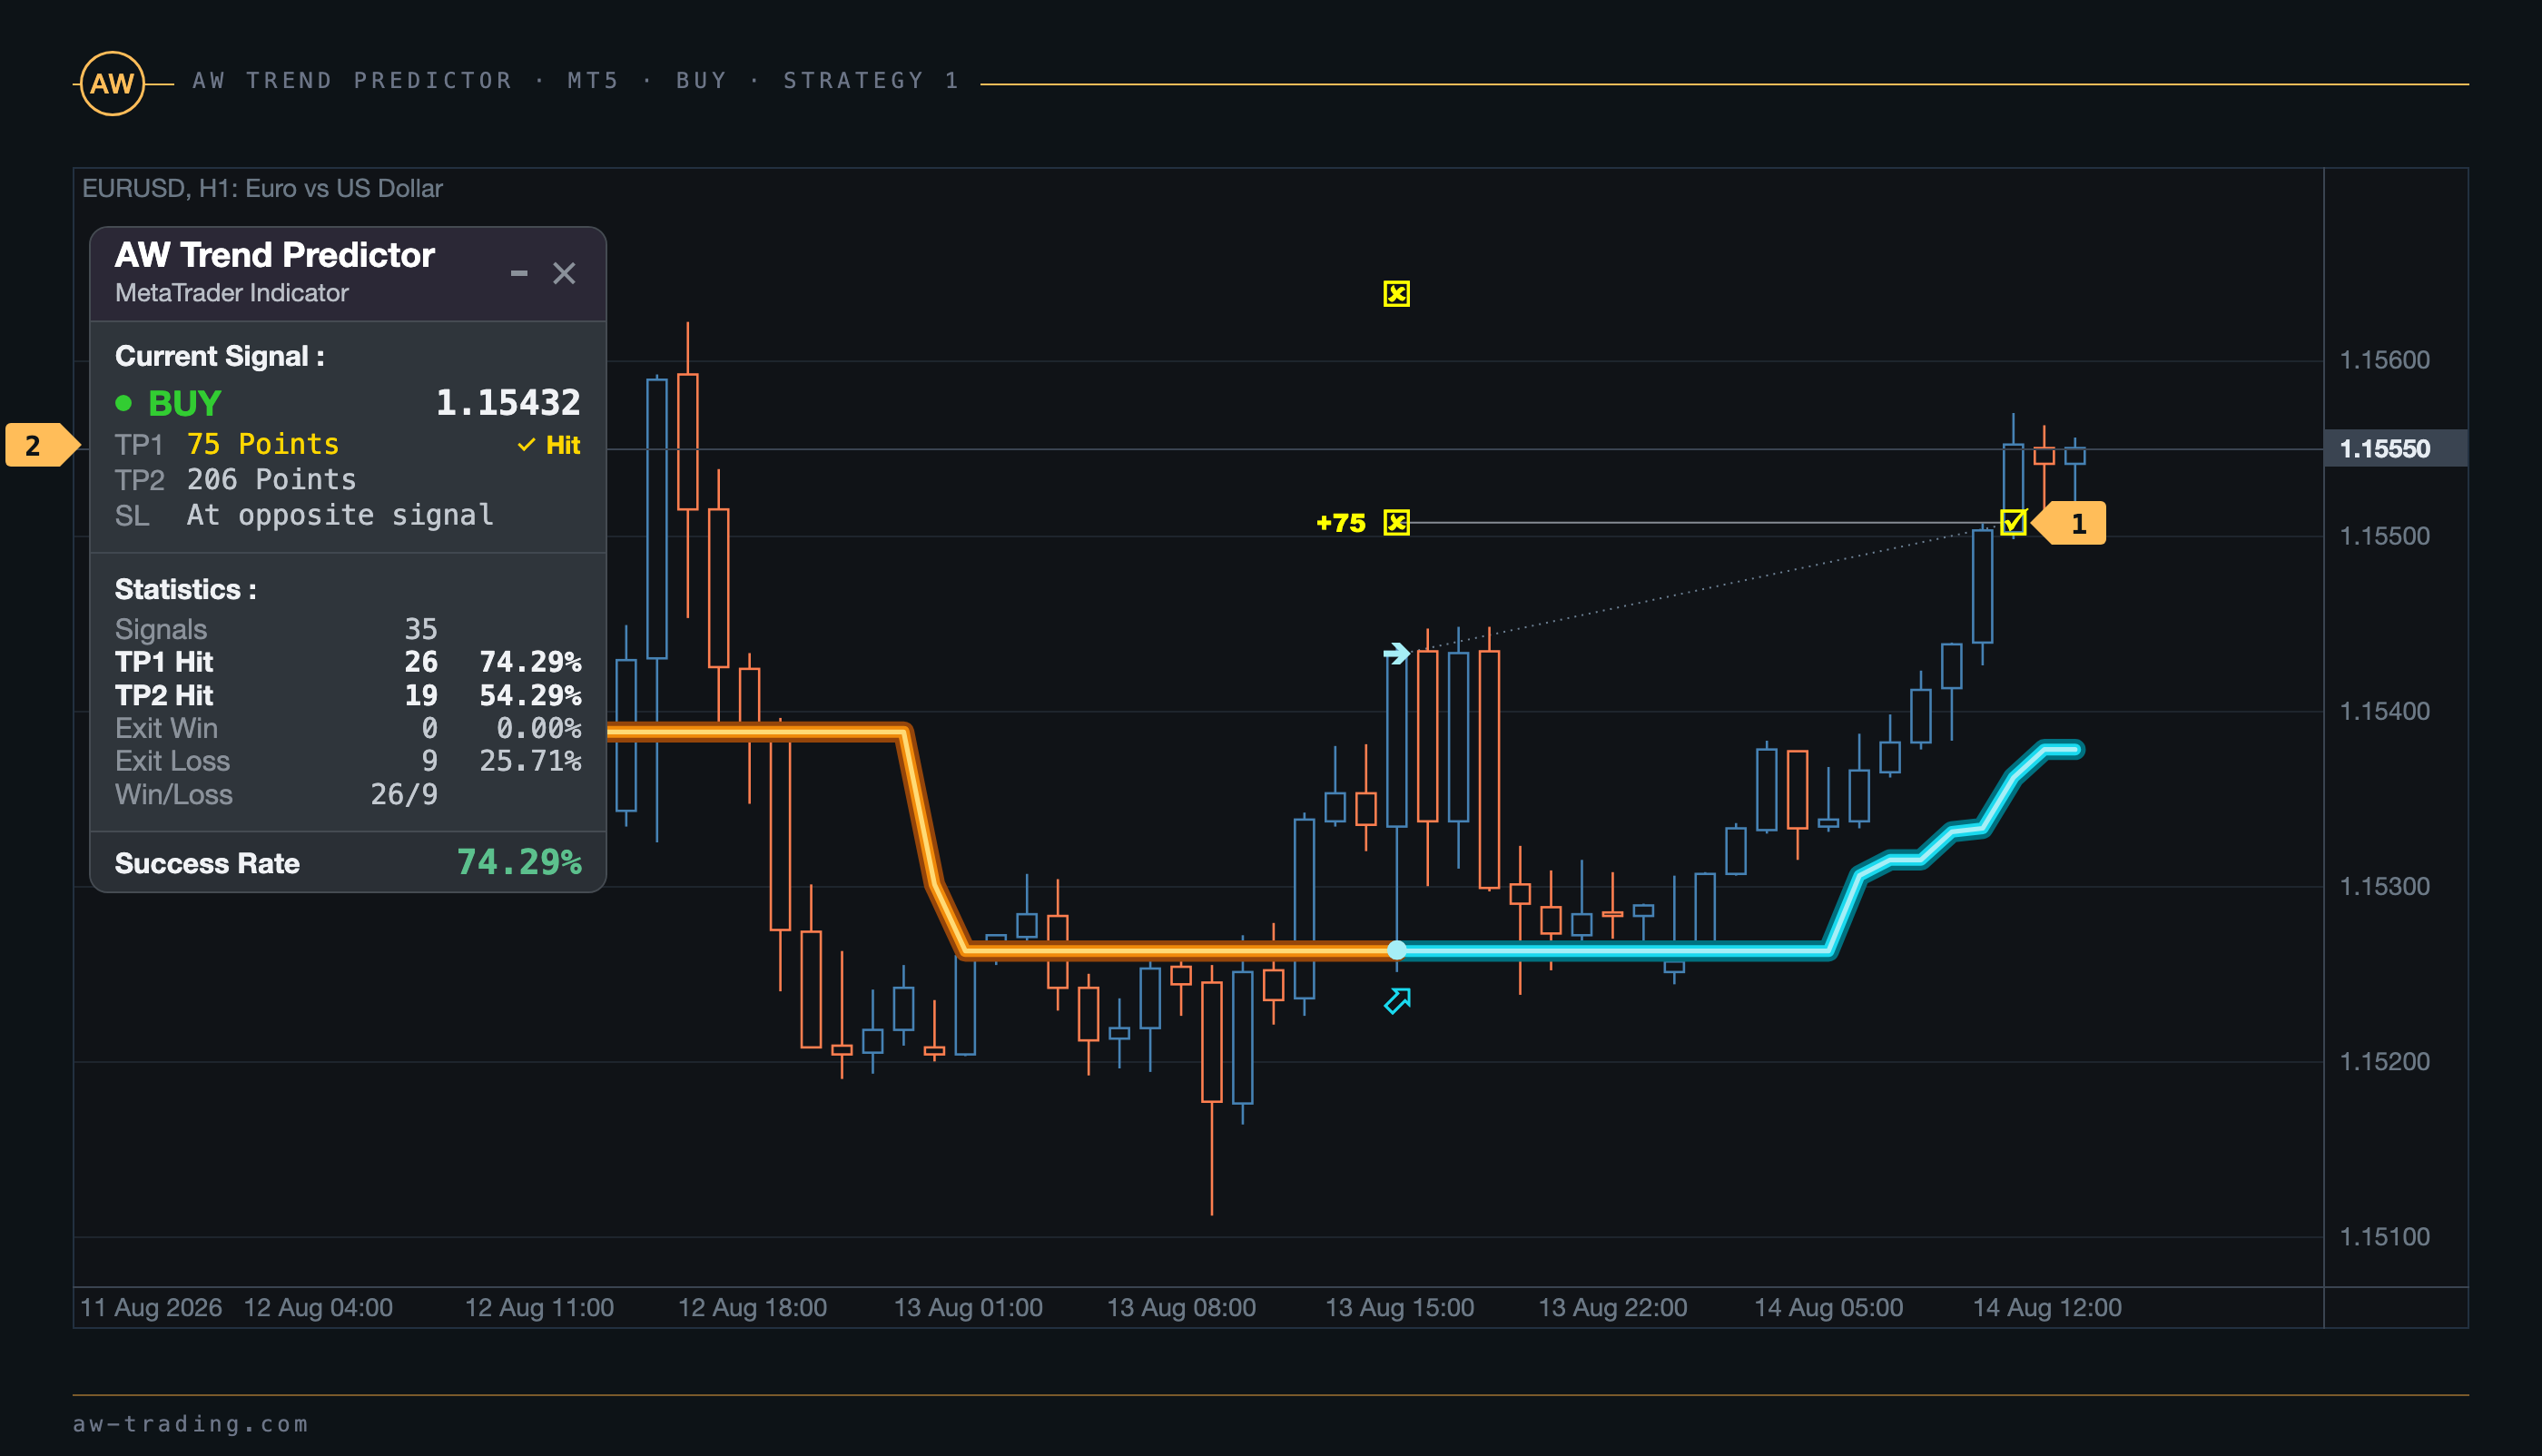
| No. | In the frame |
|---|---|
| 1 | TP1 is reached 20 bars after the signal: +75 points. |
| 2 | The Hit mark has appeared next to TP1 on the panel. |
Strategy 2: closing 50% of the position at TP1 and the remaining 50% at TP2.
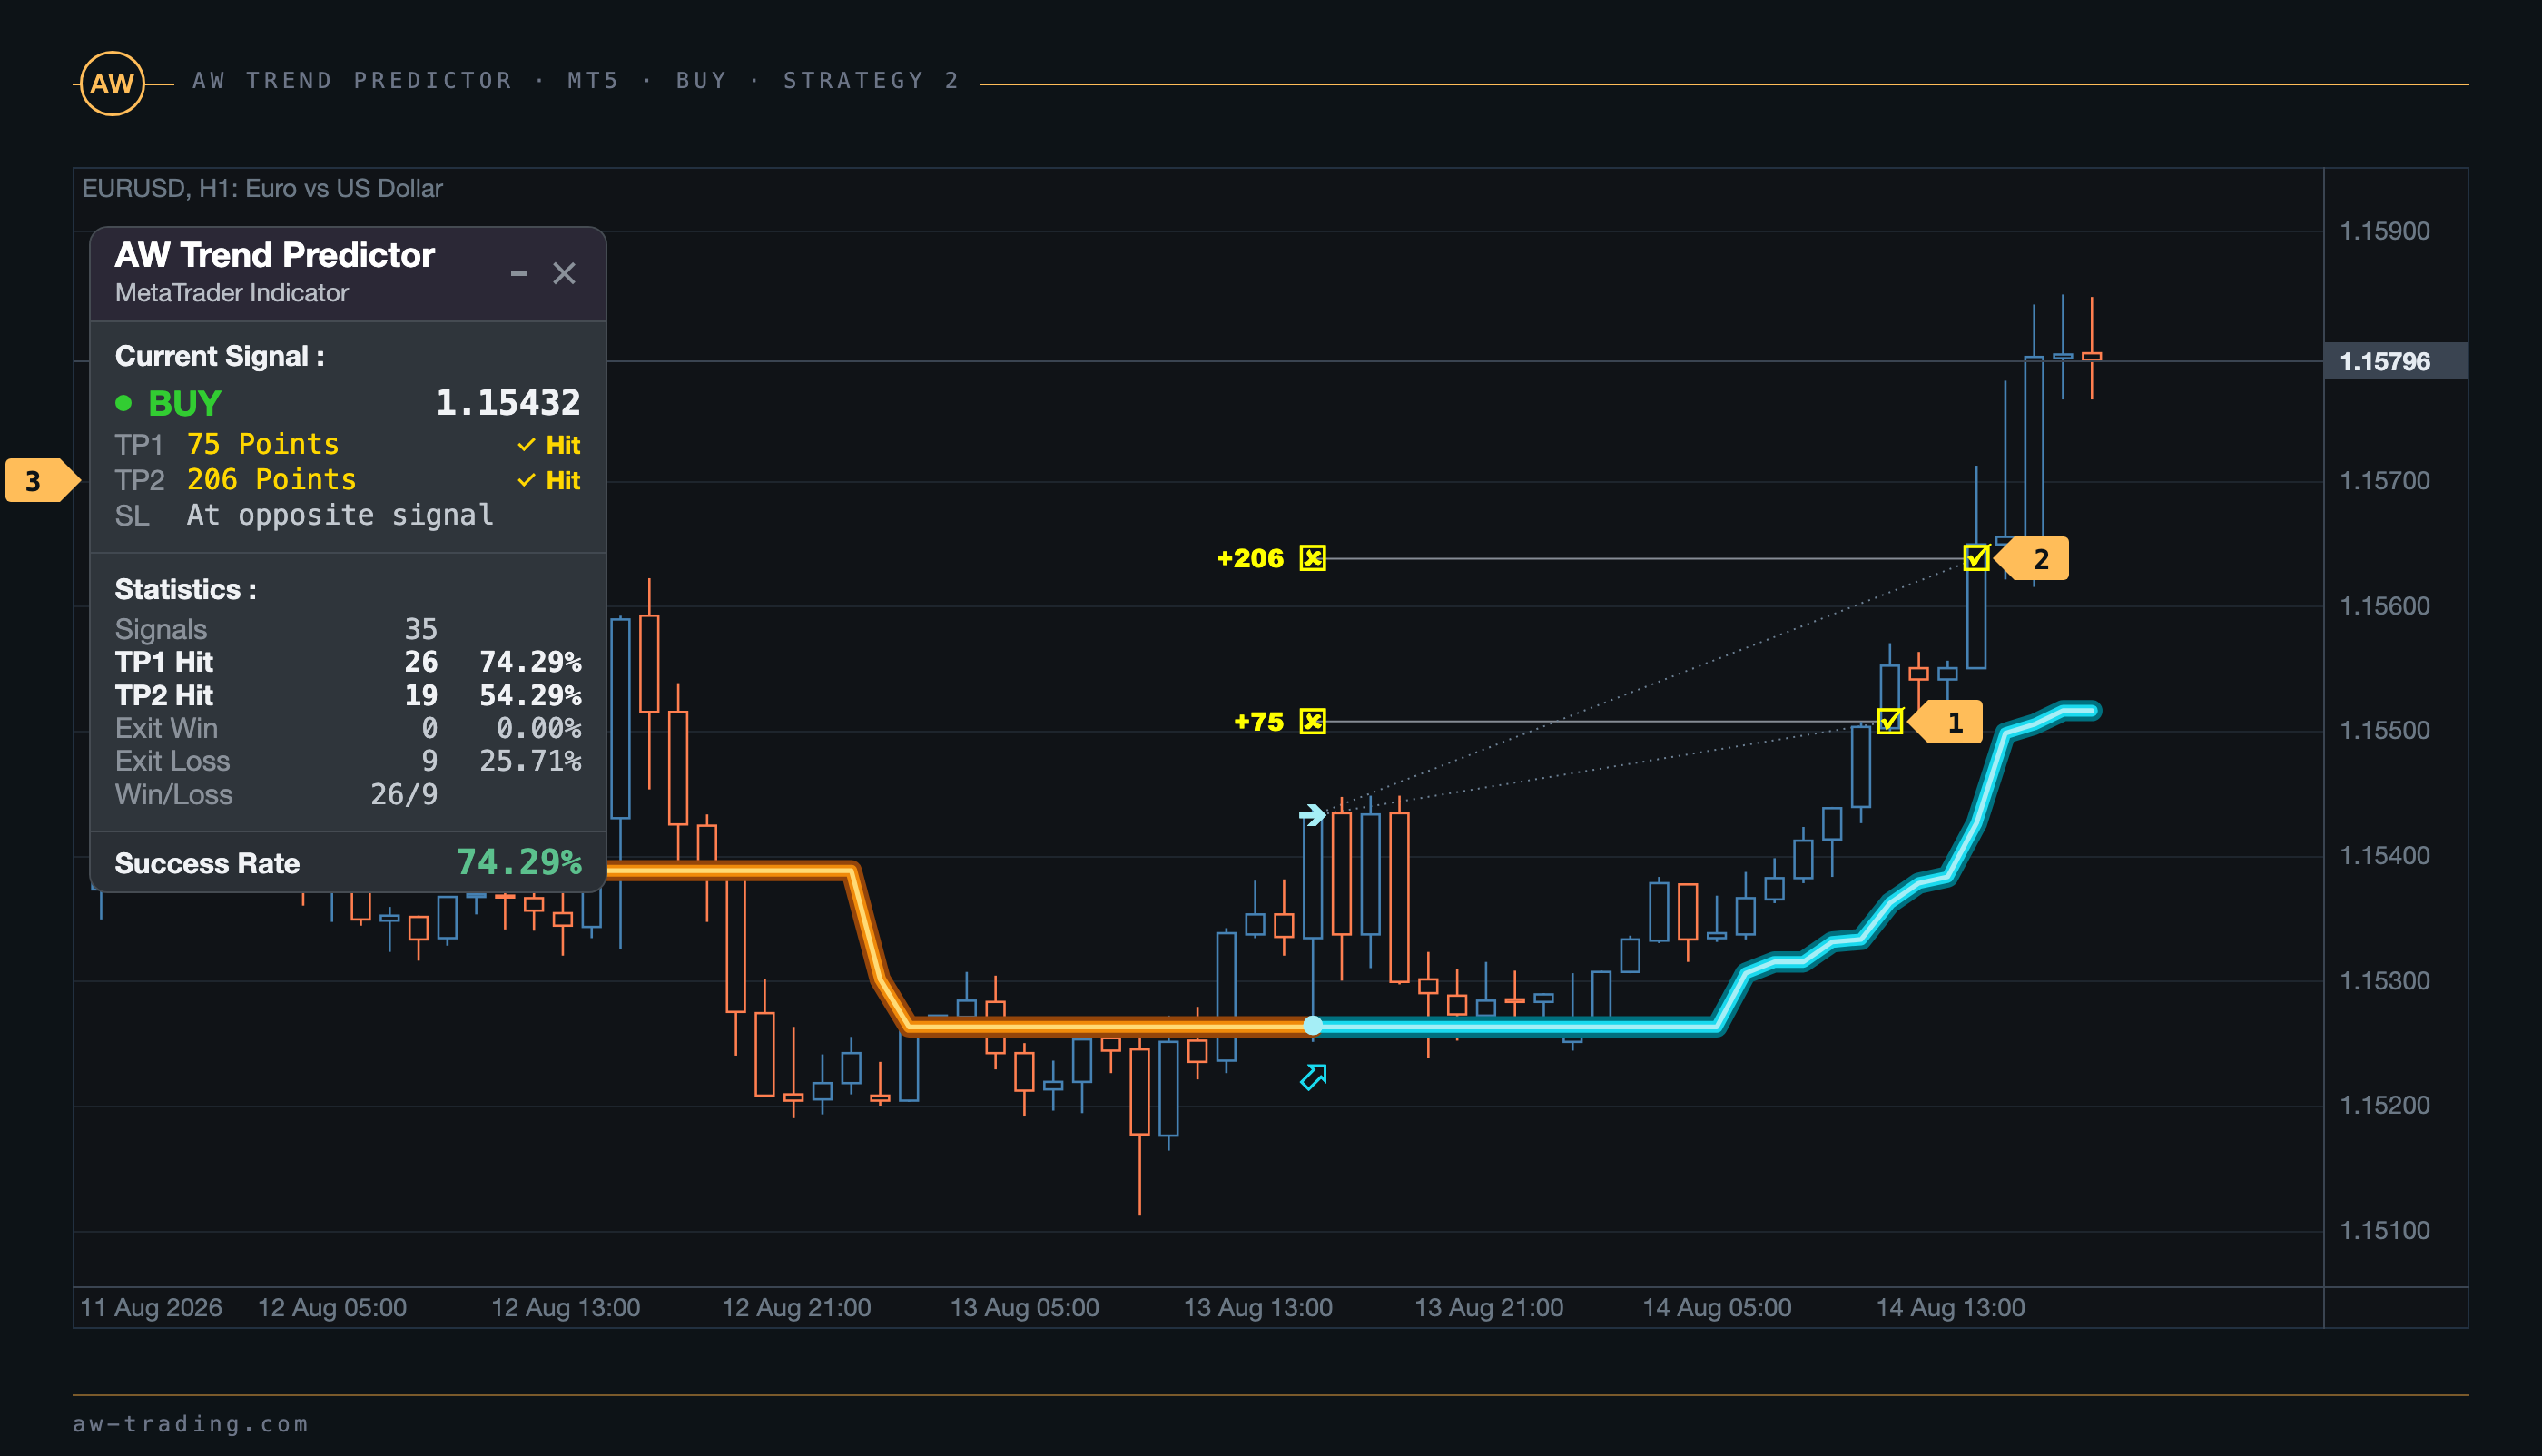
| No. | In the frame |
|---|---|
| 1 | TP1: +75 points, the first half of the position. |
| 2 | TP2 is reached three bars later: +206 points, the second half. |
| 3 | The Hit marks are next to both targets on the panel. |
Strategy 3: closing the whole position at the reversal of the trend, that is, on the opposite signal.

| No. | In the frame |
|---|---|
| 1 | The entry: a buy signal at the price of 1.15432. |
| 2 | The exit: a sell signal on 17 August at 21:00 at the price of 1.15719, 54 bars later. The result is +287 points. |
| 3 | The panel already shows the new SELL signal and its targets. |
Strategy 3 holds the position until the trend changes, so part of the move is given back at the reversal, and on a short trend the result can be smaller than TP1. Strategies 1 and 2 take the result at targets that are known in advance.
4. How to sell
Step 1 - A sell signal has arrived with a Success Rate of 70% or higher.

| No. | In the frame |
|---|---|
| 1 | A sell signal on a closed bar. EURUSD H1, the bar of 17 June 2026, 13:00. |
| 2 | The TP1 and TP2 levels of this signal. |
| 3 | Current Signal: SELL, the entry price of 1.15965, 73 and 178 points to the targets. |
| 4 | The Success Rate of the chart is 73.53%. |
Step 2 - Choosing the StopLoss mode, the same way as for a buy. The frame shows the same sell in the Dynamic StopLoss mode.
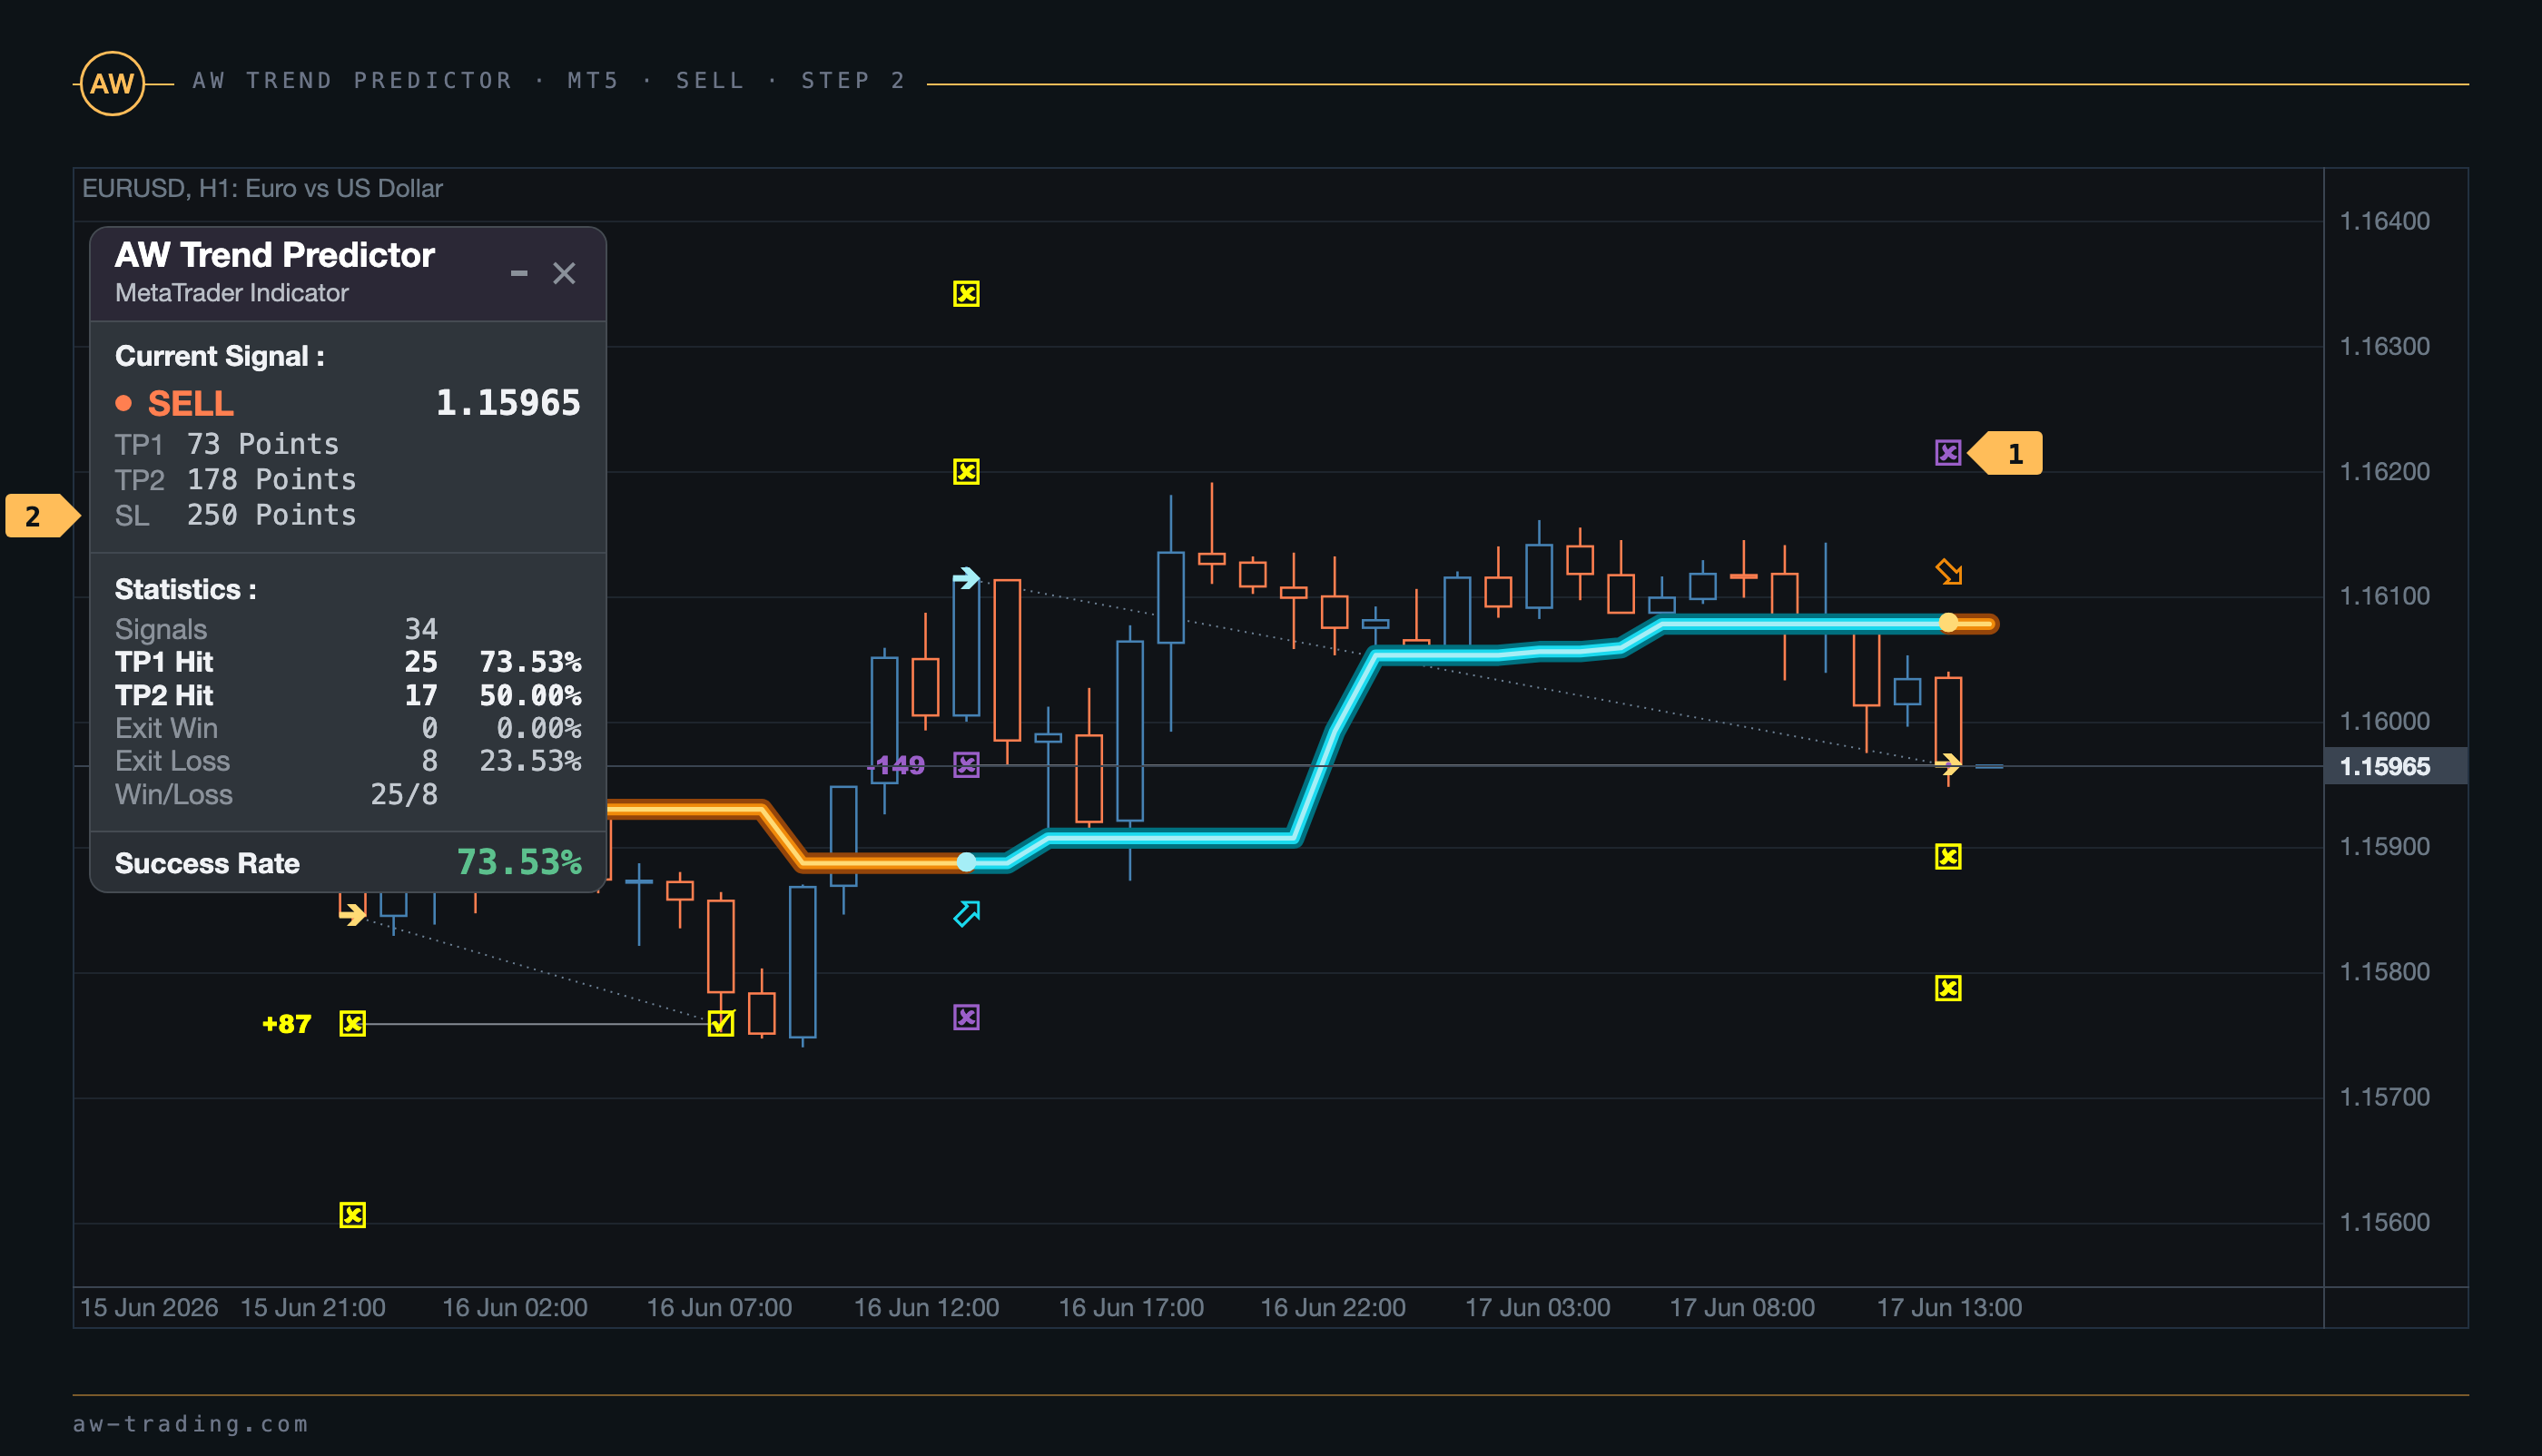
| No. | In the frame |
|---|---|
| 1 | The stop level above the signal bar, the purple square. |
| 2 | The SL line of the panel holds the distance to the stop: 250 points. |
Step 3 - Choosing the TakeProfit strategy. The frames again show one and the same trade.
Strategy 1: closing the whole position at TP1.
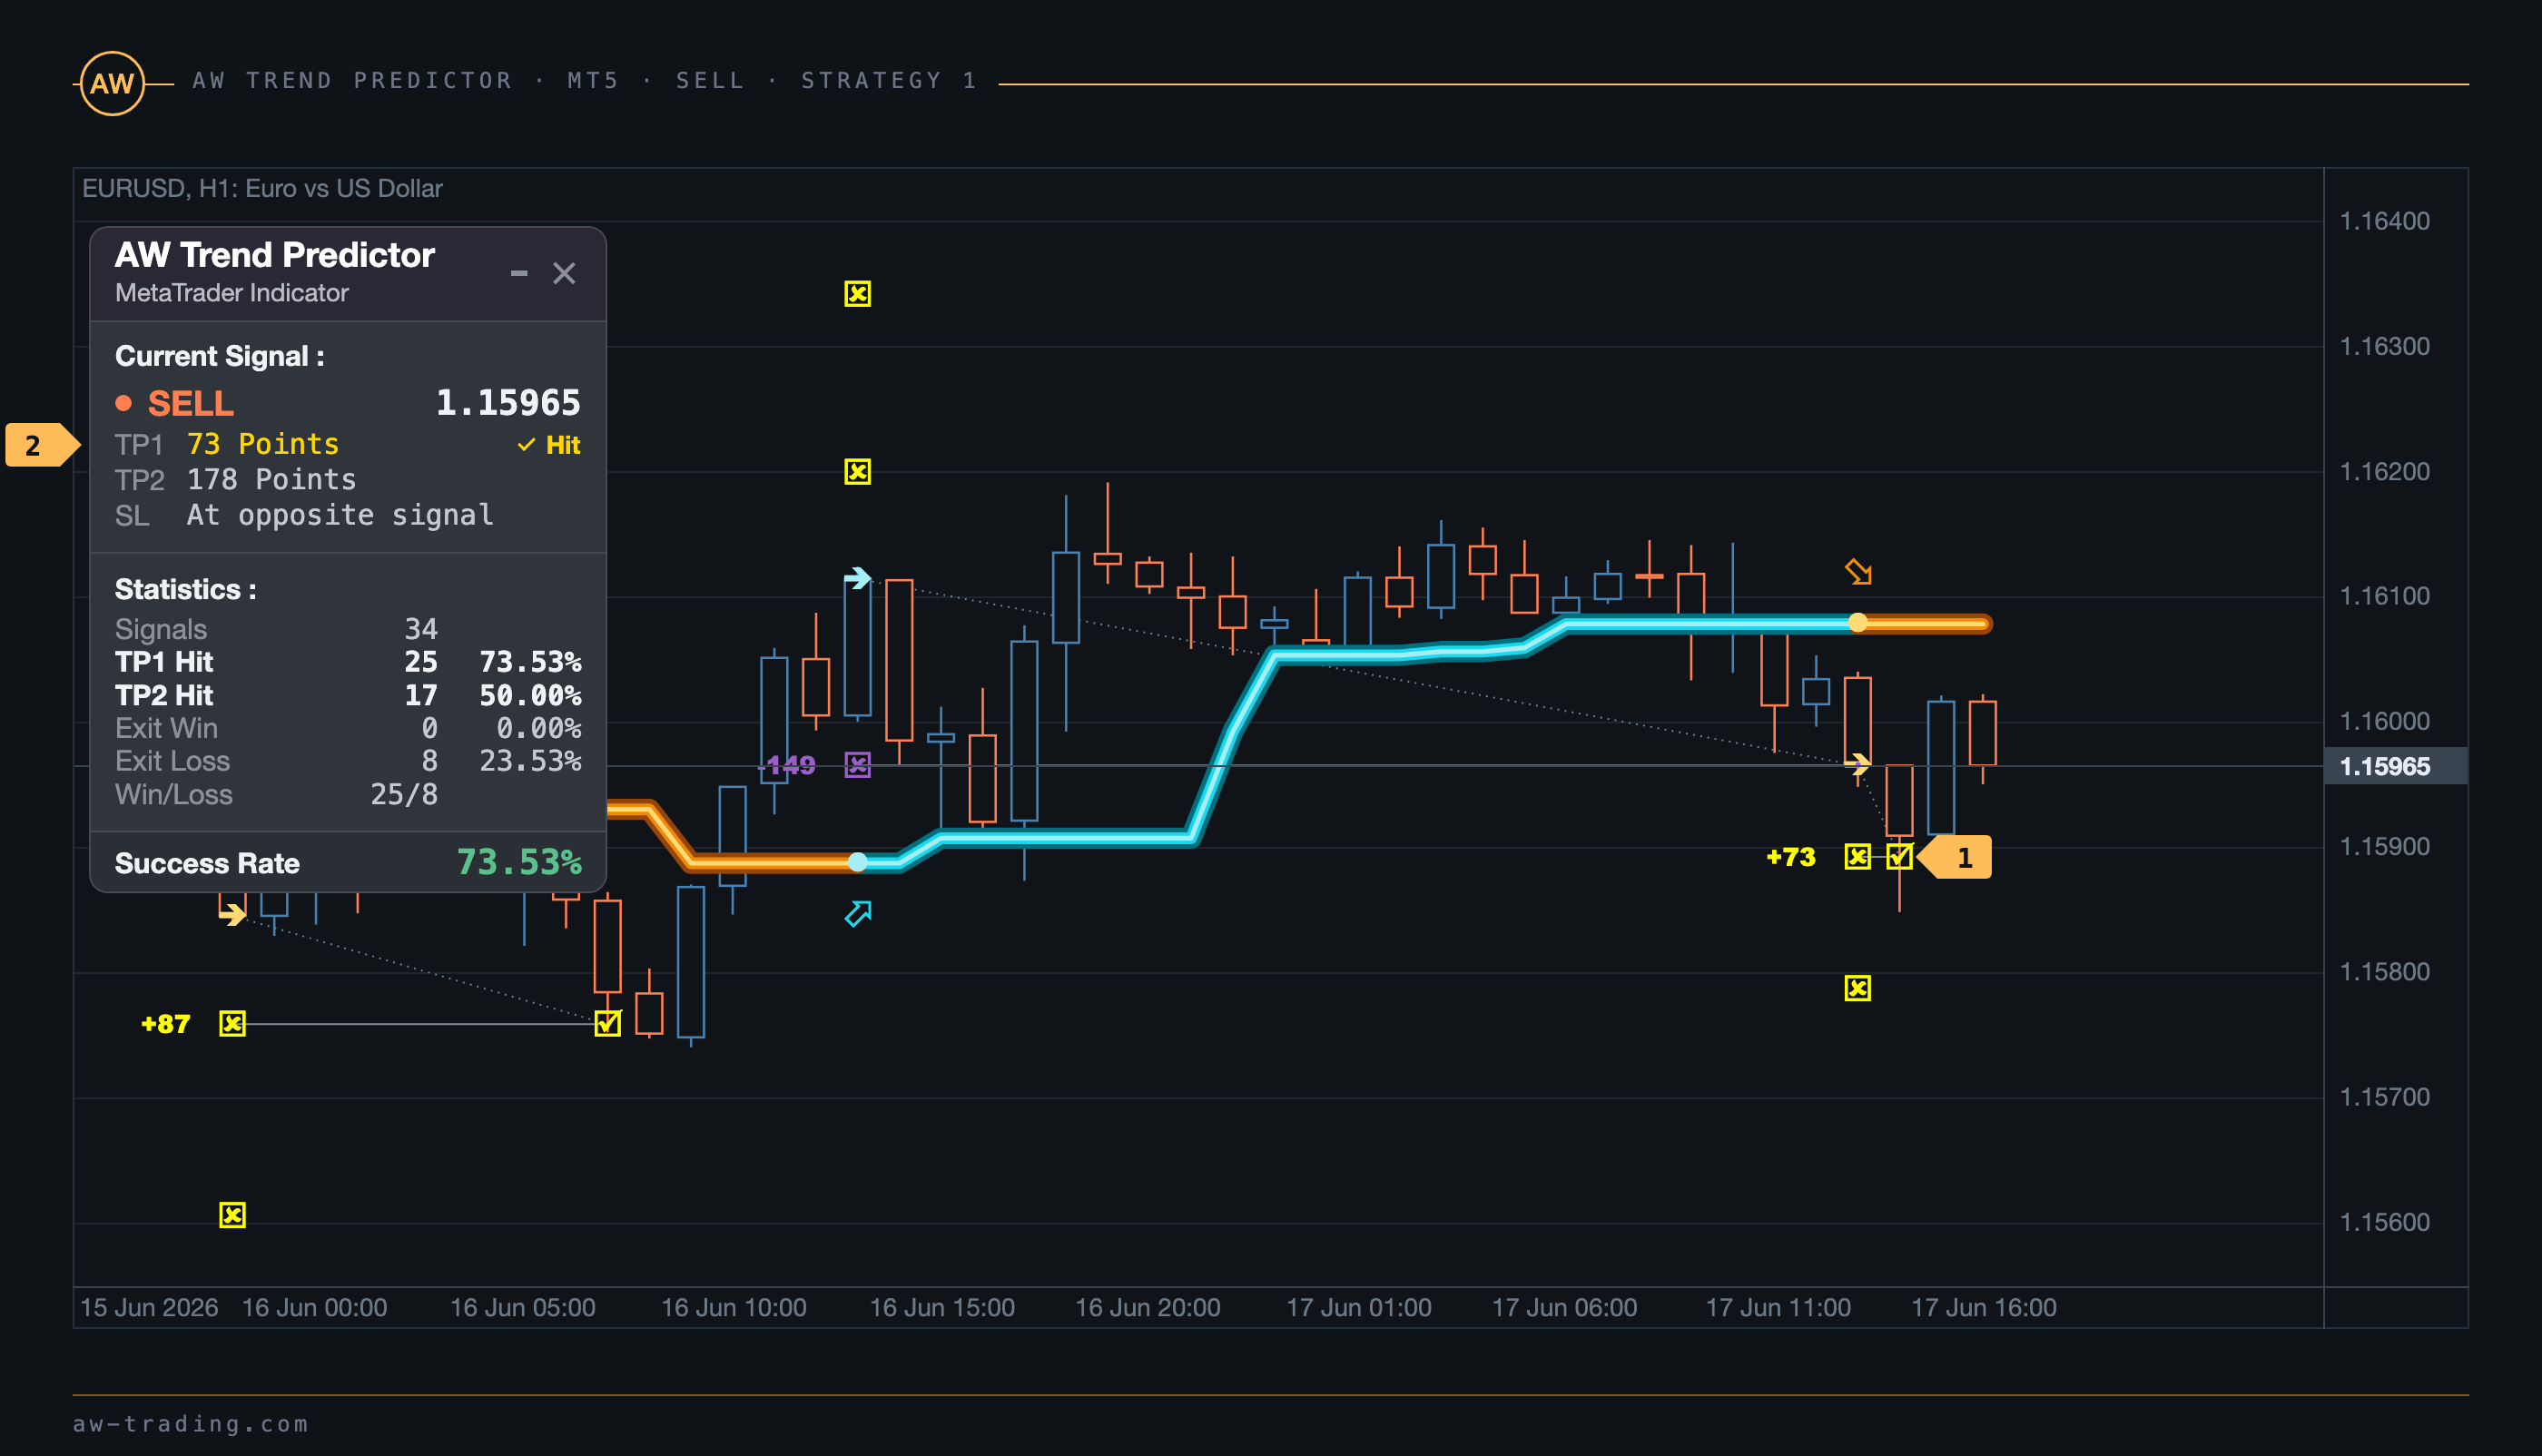
| No. | In the frame |
|---|---|
| 1 | TP1 is reached on the bar after the signal: +73 points. |
| 2 | The Hit mark next to TP1 on the panel. |
Strategy 2: closing 50% of the position at TP1 and the remaining 50% at TP2.
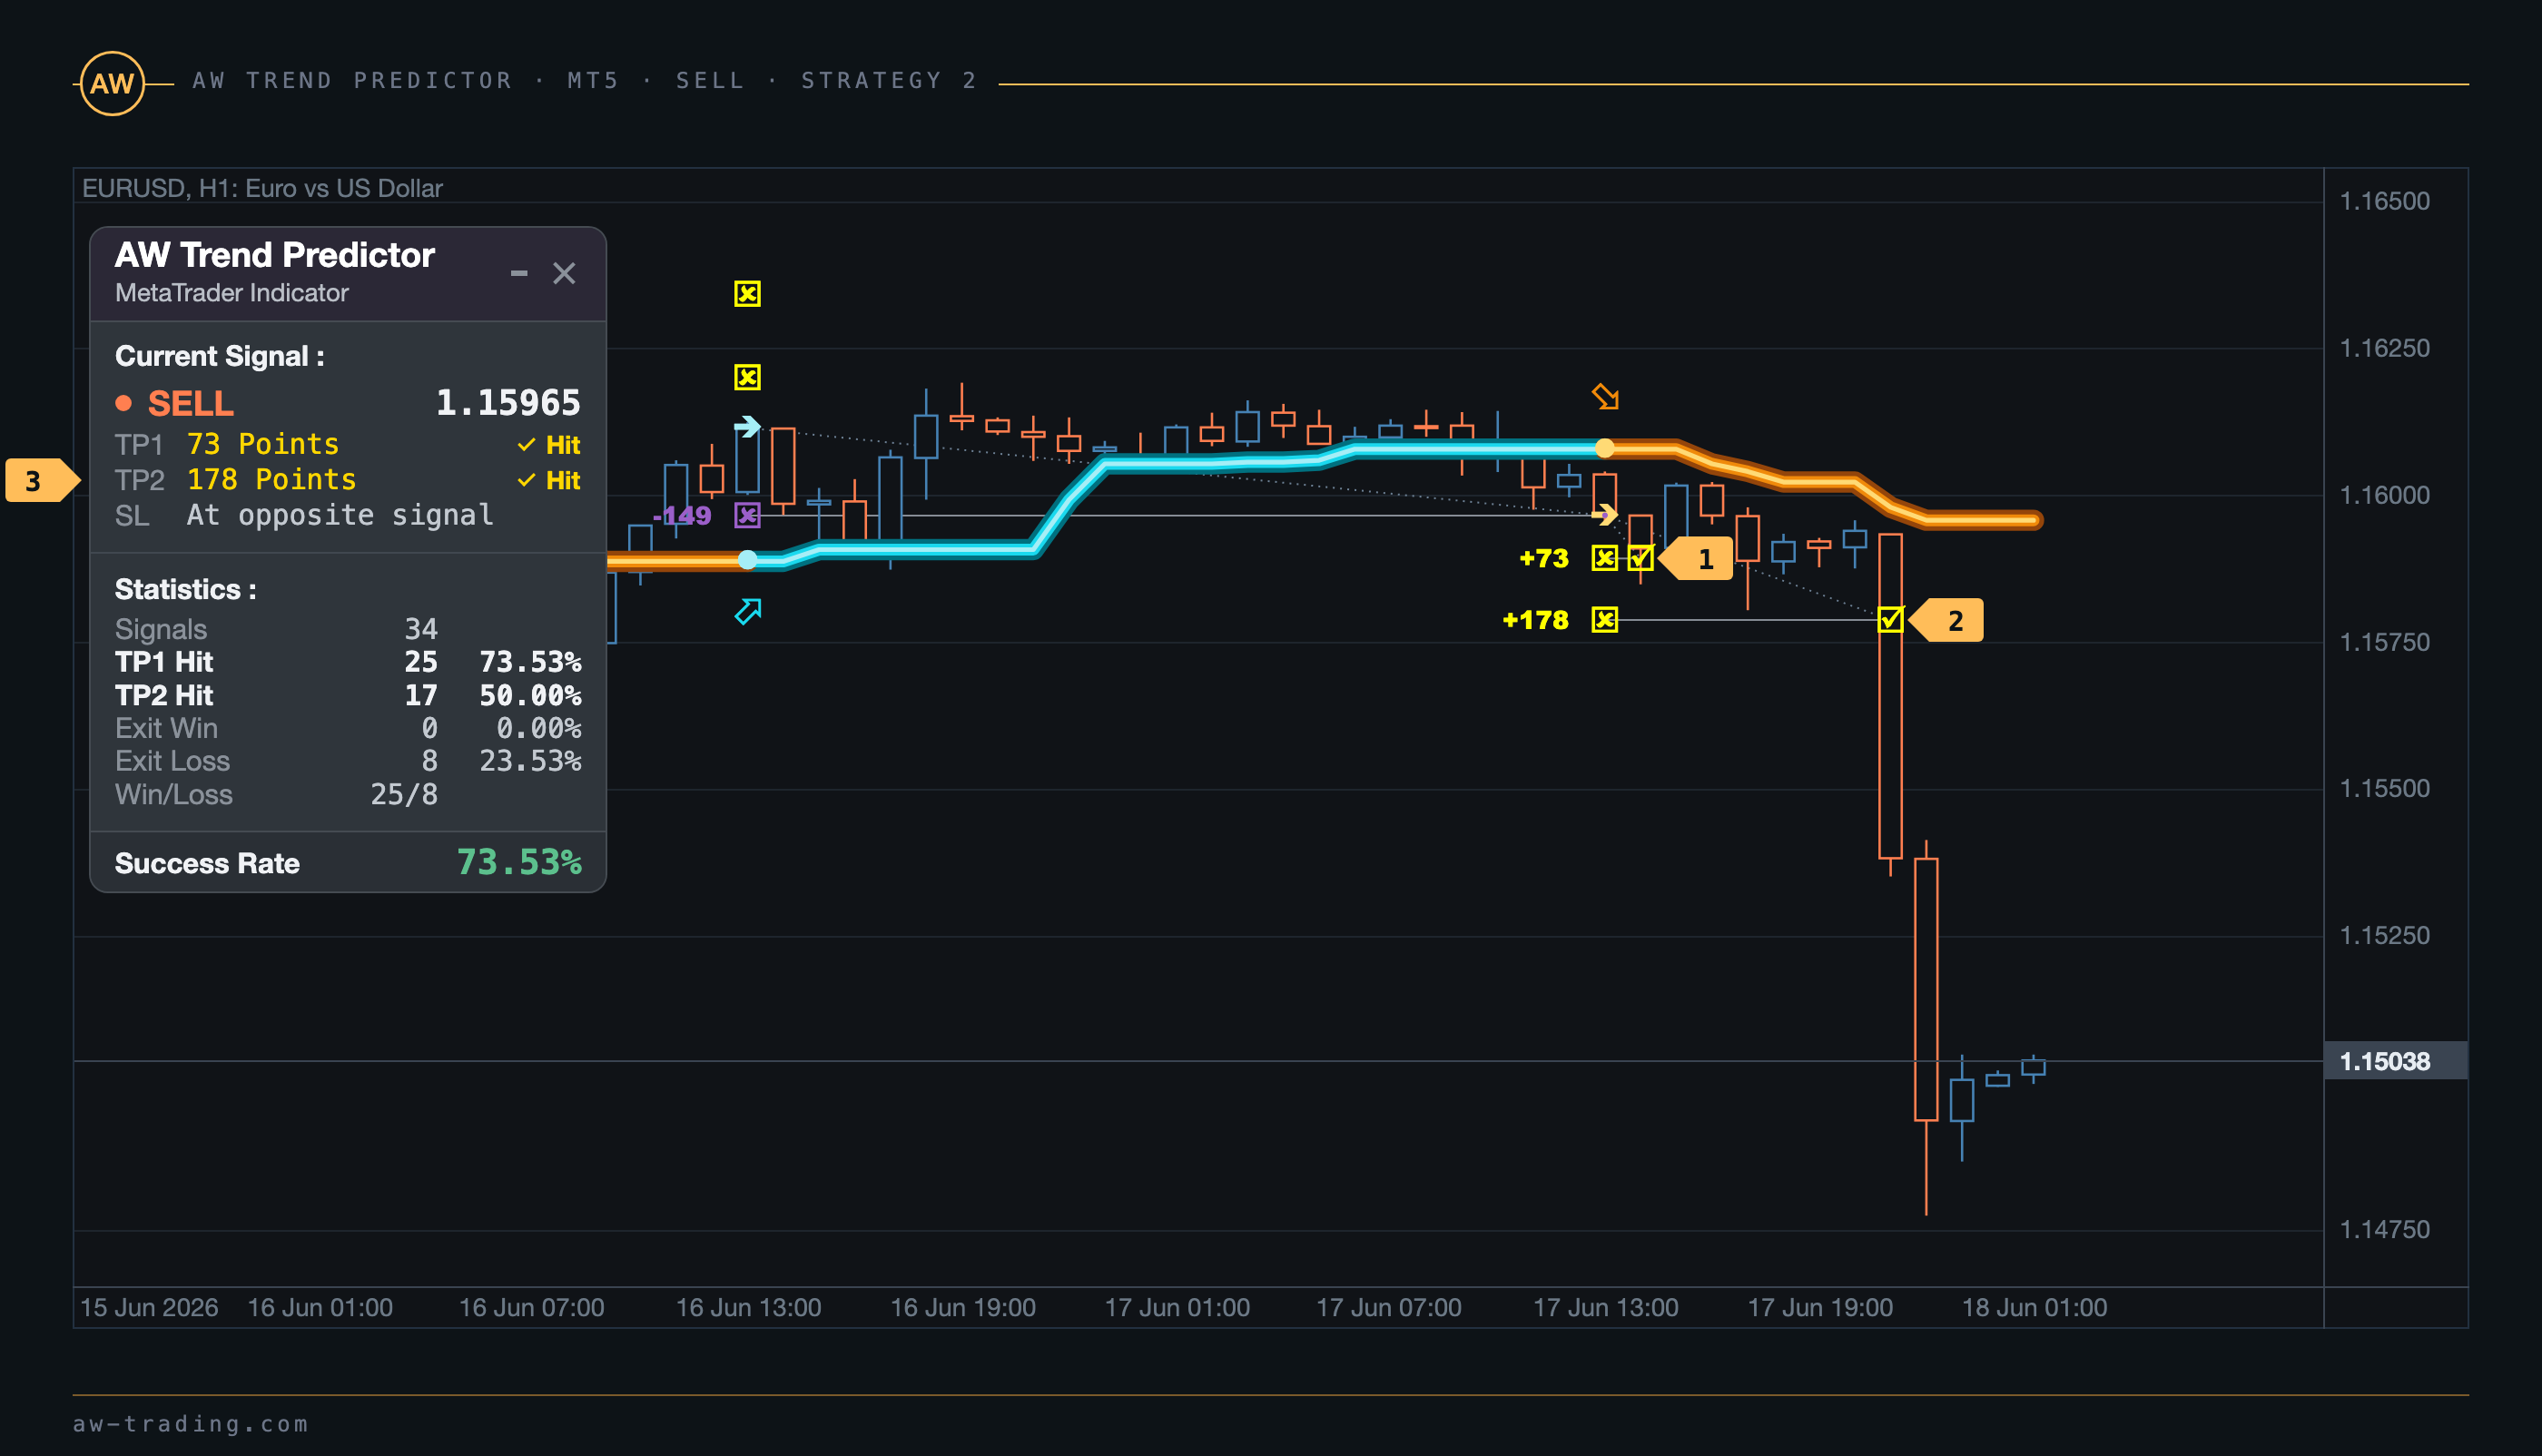
| No. | In the frame |
|---|---|
| 1 | TP1: +73 points. |
| 2 | TP2 is reached eight bars after the signal: +178 points. |
| 3 | The Hit marks next to both targets. |
Strategy 3: closing the whole position at the reversal of the trend.

| No. | In the frame |
|---|---|
| 1 | The entry: a sell signal at the price of 1.15965. |
| 2 | The exit: a buy signal on 19 June at 15:00 at the price of 1.14705, 50 bars later. The result is +1260 points. |
| 3 | The panel shows the new BUY signal. |
5. StopLoss: two modes
The mode is selected by the StopLoss Mode variable. The mode affects both the trades on the chart and the statistics on the panel.
| Mode | How the trade is closed | What is visible on the chart and on the panel |
|---|---|---|
| SL at opposite signal | At the close of the bar of the opposite signal, if the first target has not been reached before that. | The close result in points as a purple number to the left of the signal bar, with a minus sign for a loss. In the SL line of the panel - At opposite signal. |
| Dynamic StopLoss | At the stop, if price reached it before TP1. If neither the stop nor TP1 was triggered, the trade is closed by the opposite signal. | The stop level on the signal bar, the mark on the bar where it was touched and the stop distance in points. In the SL line of the panel - the distance to the stop. |
SL at opposite signal. The position stays open until the trend changes. The example below is a trade that did not reach the target.
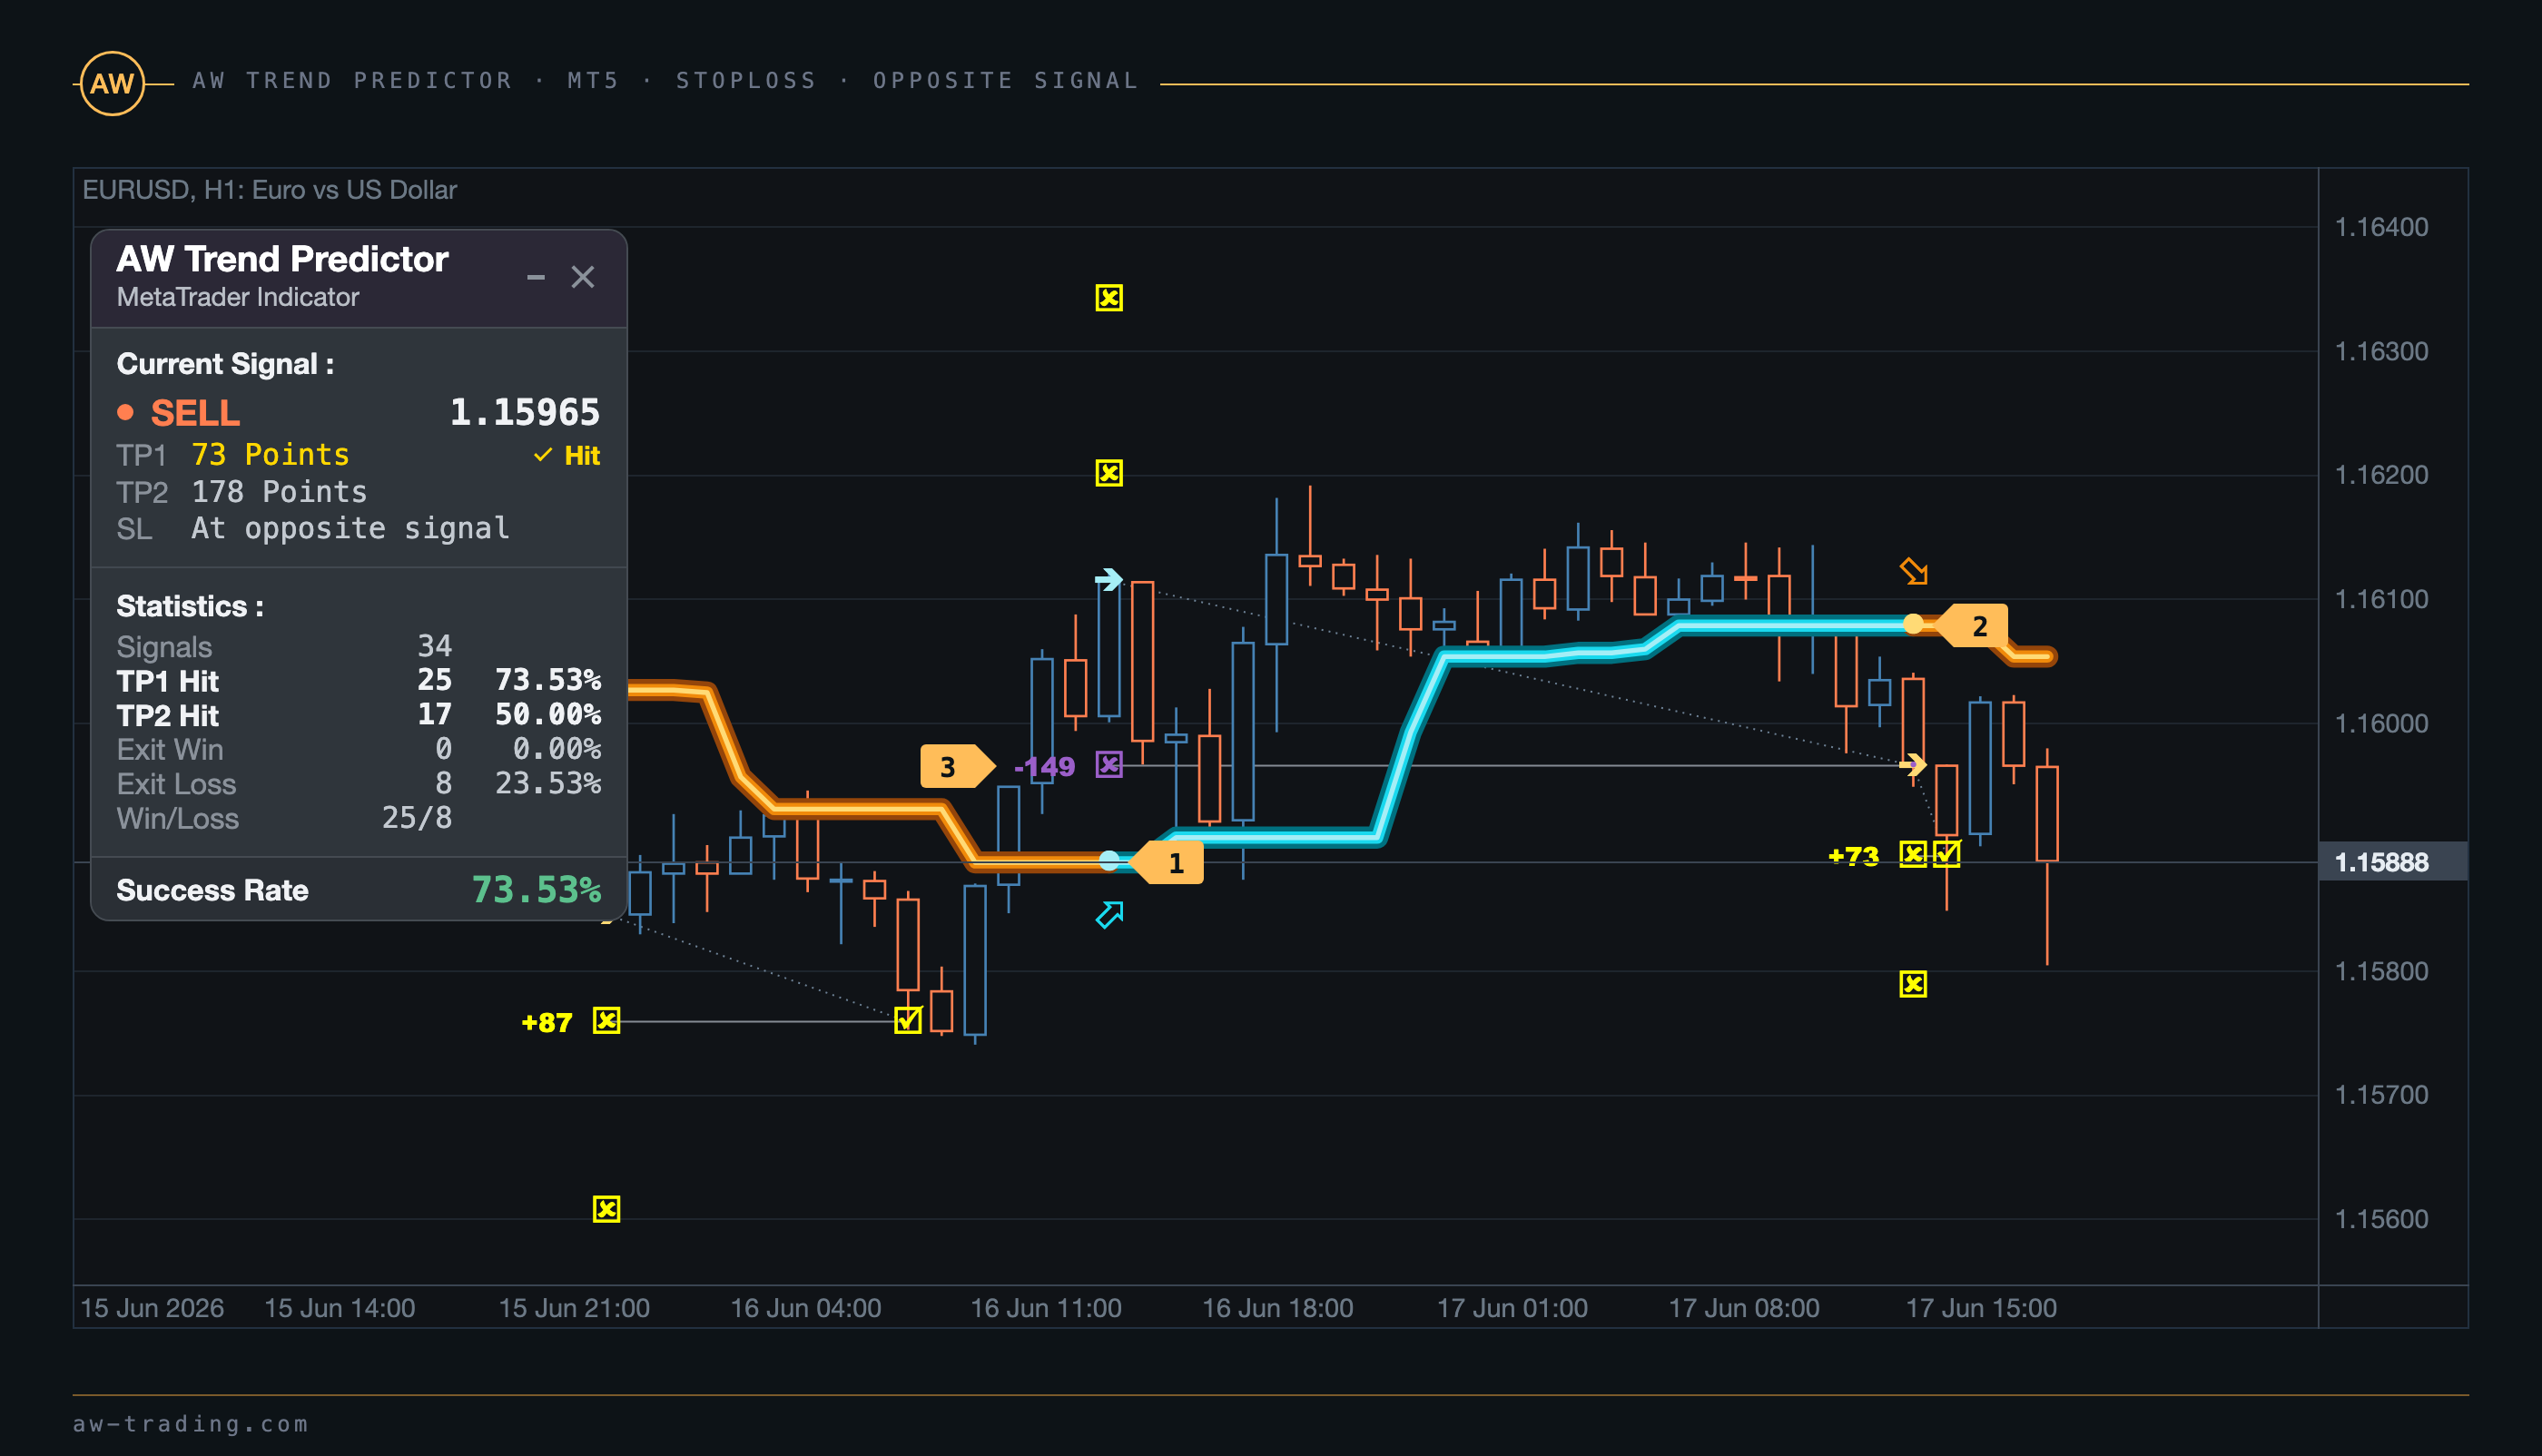
| No. | In the frame |
|---|---|
| 1 | A buy signal on EURUSD H1, 16 June 2026, 13:00, at the price of 1.16114. TP1 was not reached. |
| 2 | The sell signal on 17 June at 13:00 closed the buy. It is the same signal that the sell example in section 4 starts with. |
| 3 | The close result: -149 points. The line runs from the entry to the close price. |
Dynamic StopLoss. The stop level is placed together with the signal beyond the extremum of the signal bar: below its Low for a buy, above its High for a sell. The distance depends on the volatility of the recent bars and on the StopLoss target variable: the smaller the value, the closer the stop to the entry price, the larger the value, the farther the stop. The stop is tracked until TP1 is reached, after which the trade already counts as successful.
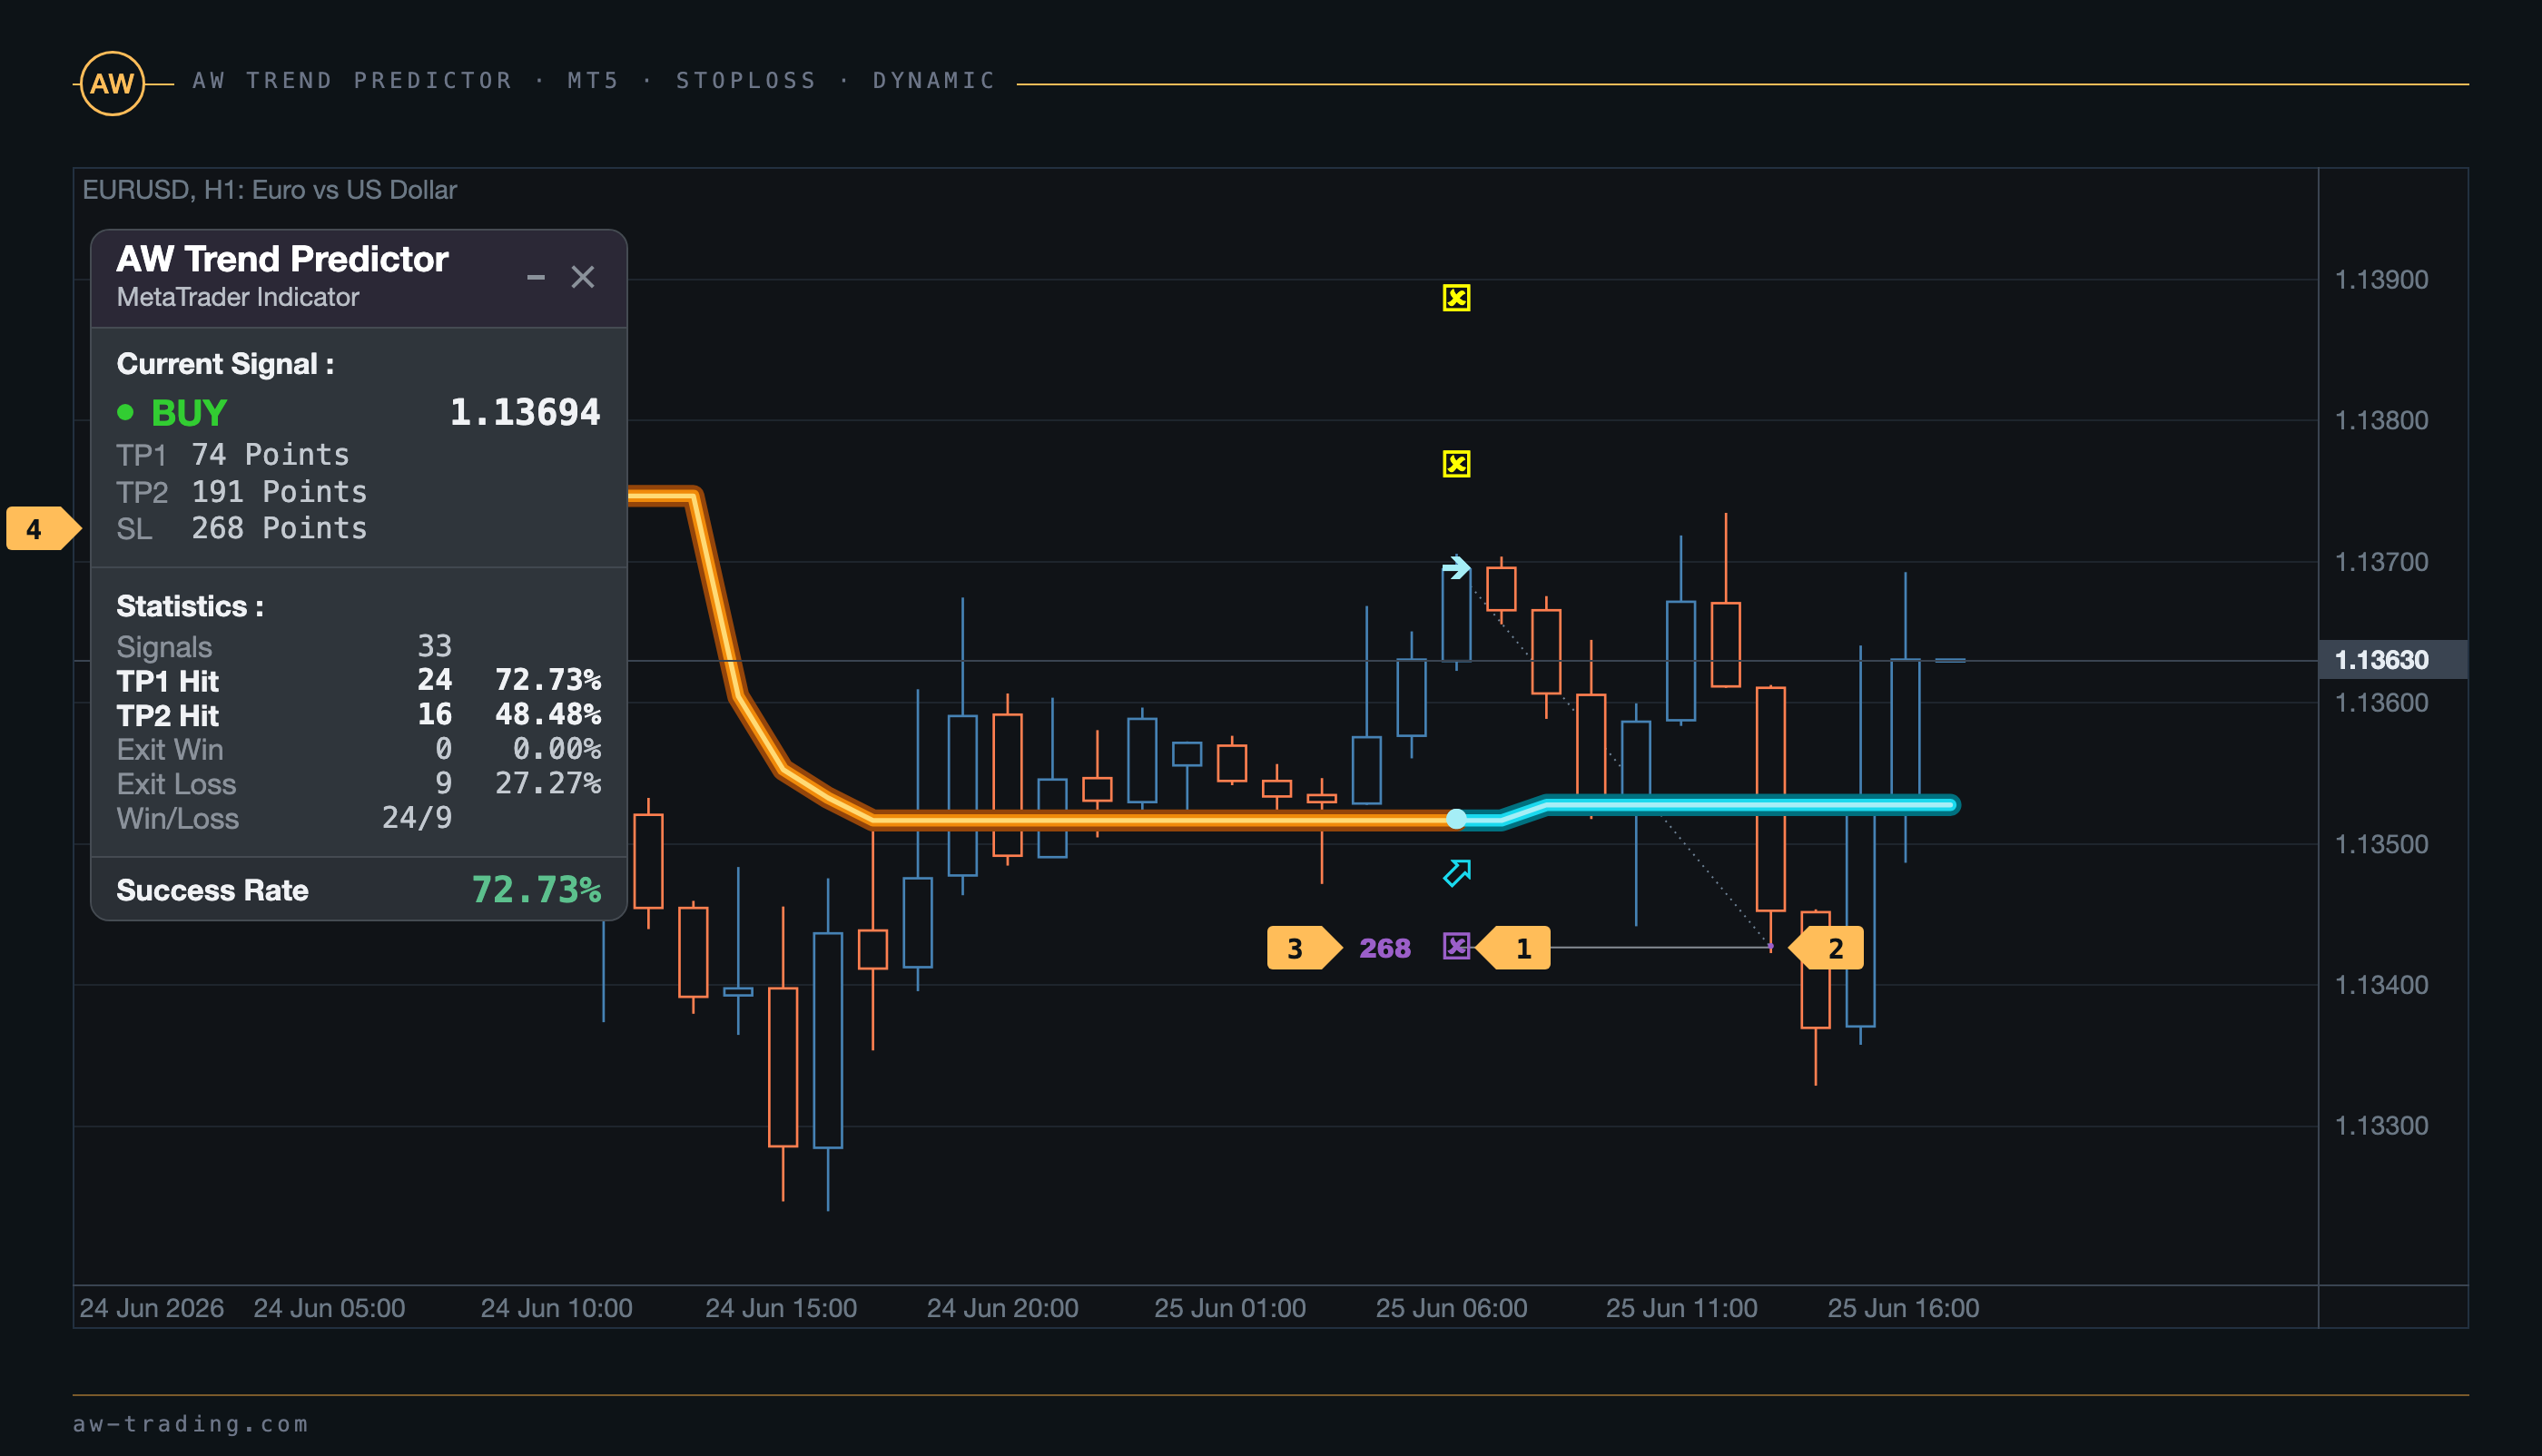
| No. | In the frame |
|---|---|
| 1 | The stop level on the signal bar: a buy on EURUSD H1, 25 June 2026, 06:00, at the price of 1.13694. |
| 2 | Price reached the stop seven bars later. |
| 3 | The distance of the stop from the entry price: 268 points. |
| 4 | The SL line of the panel holds the same distance. |
When "Dynamic StopLoss" is selected, a value has to be set in the "StopLoss target" variable. Trades closed at the stop go into the Exit Loss line of the panel.
6. Multi-timeframe use
The higher timeframe sets the direction, the lower one gives the entry. The example uses USDJPY: H4 and M15 at one and the same moment, 20 August 2026.
Step 1 - The H4 timeframe is in a downtrend. That means only sells in this trend. With an uptrend on H4, only buys.
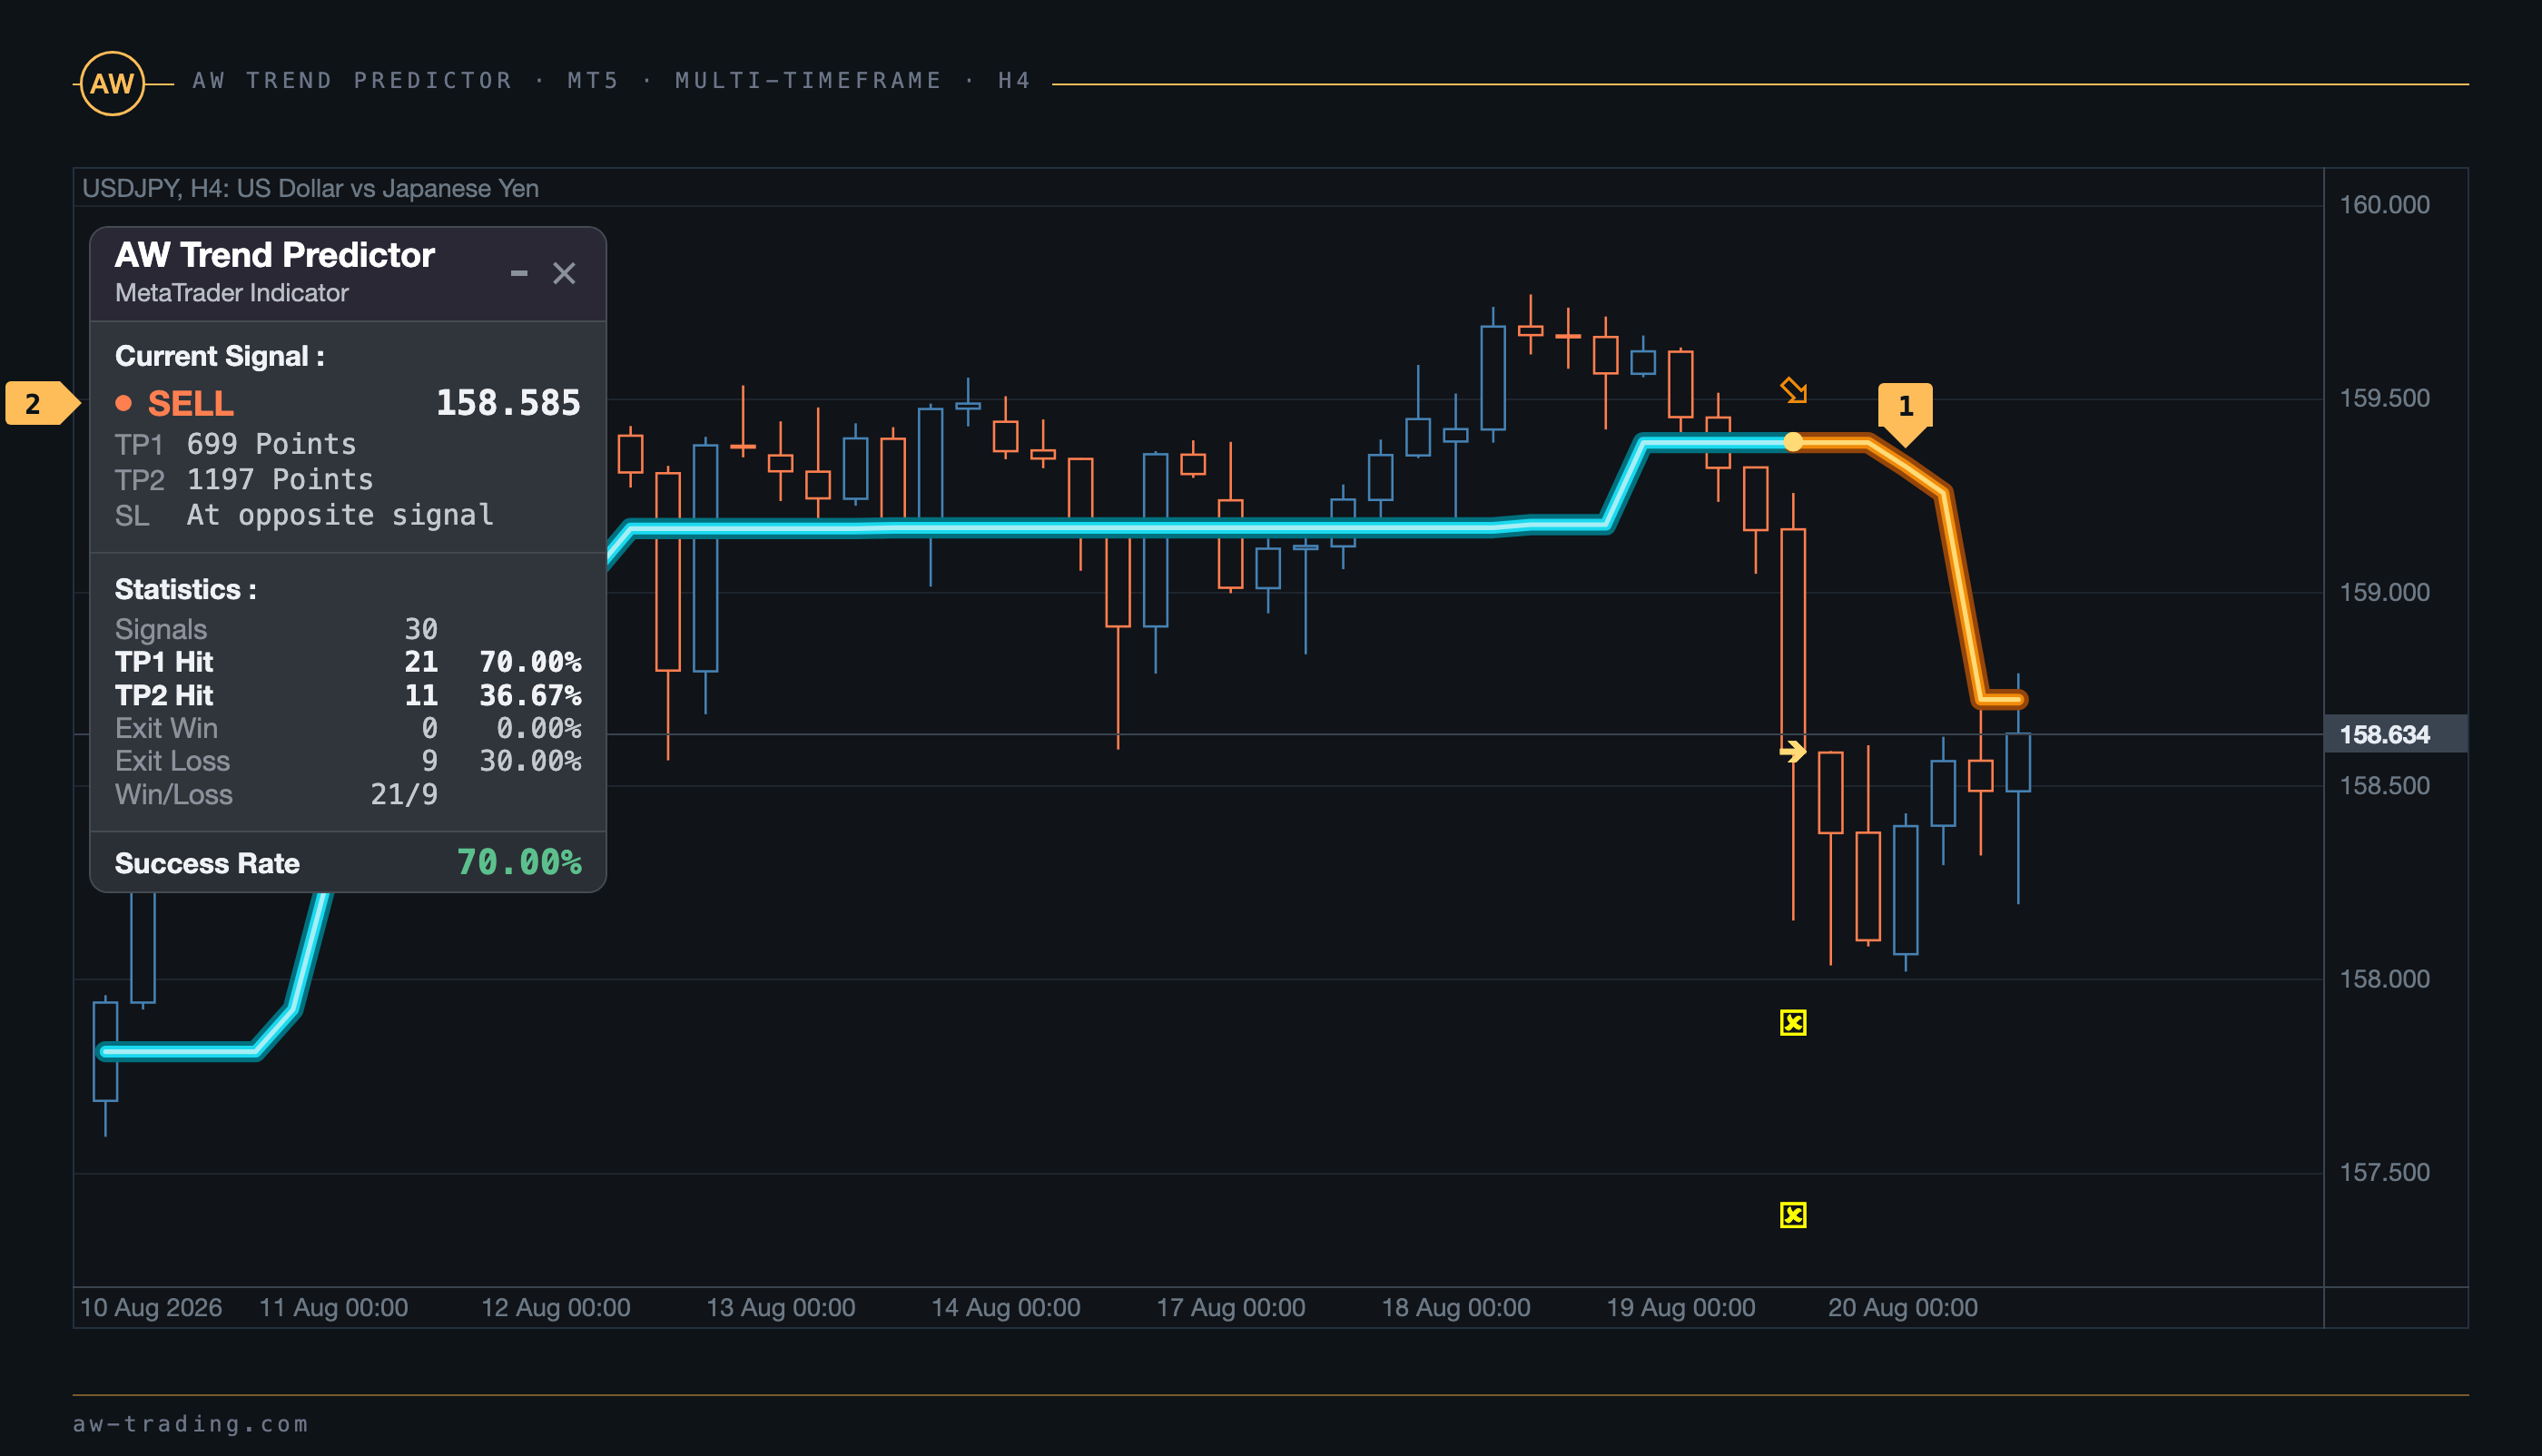
| No. | In the frame |
|---|---|
| 1 | The H4 downtrend line after the sell signal on 19 August at 12:00. |
| 2 | Current Signal: SELL, the H4 Success Rate - 70.00%. |
Step 2 - The Success Rate on the lower timeframe is 70% or higher.
Step 3 - A signal on the lower timeframe in the direction of the higher timeframe trend. Signals against the trend of the higher timeframe are skipped.
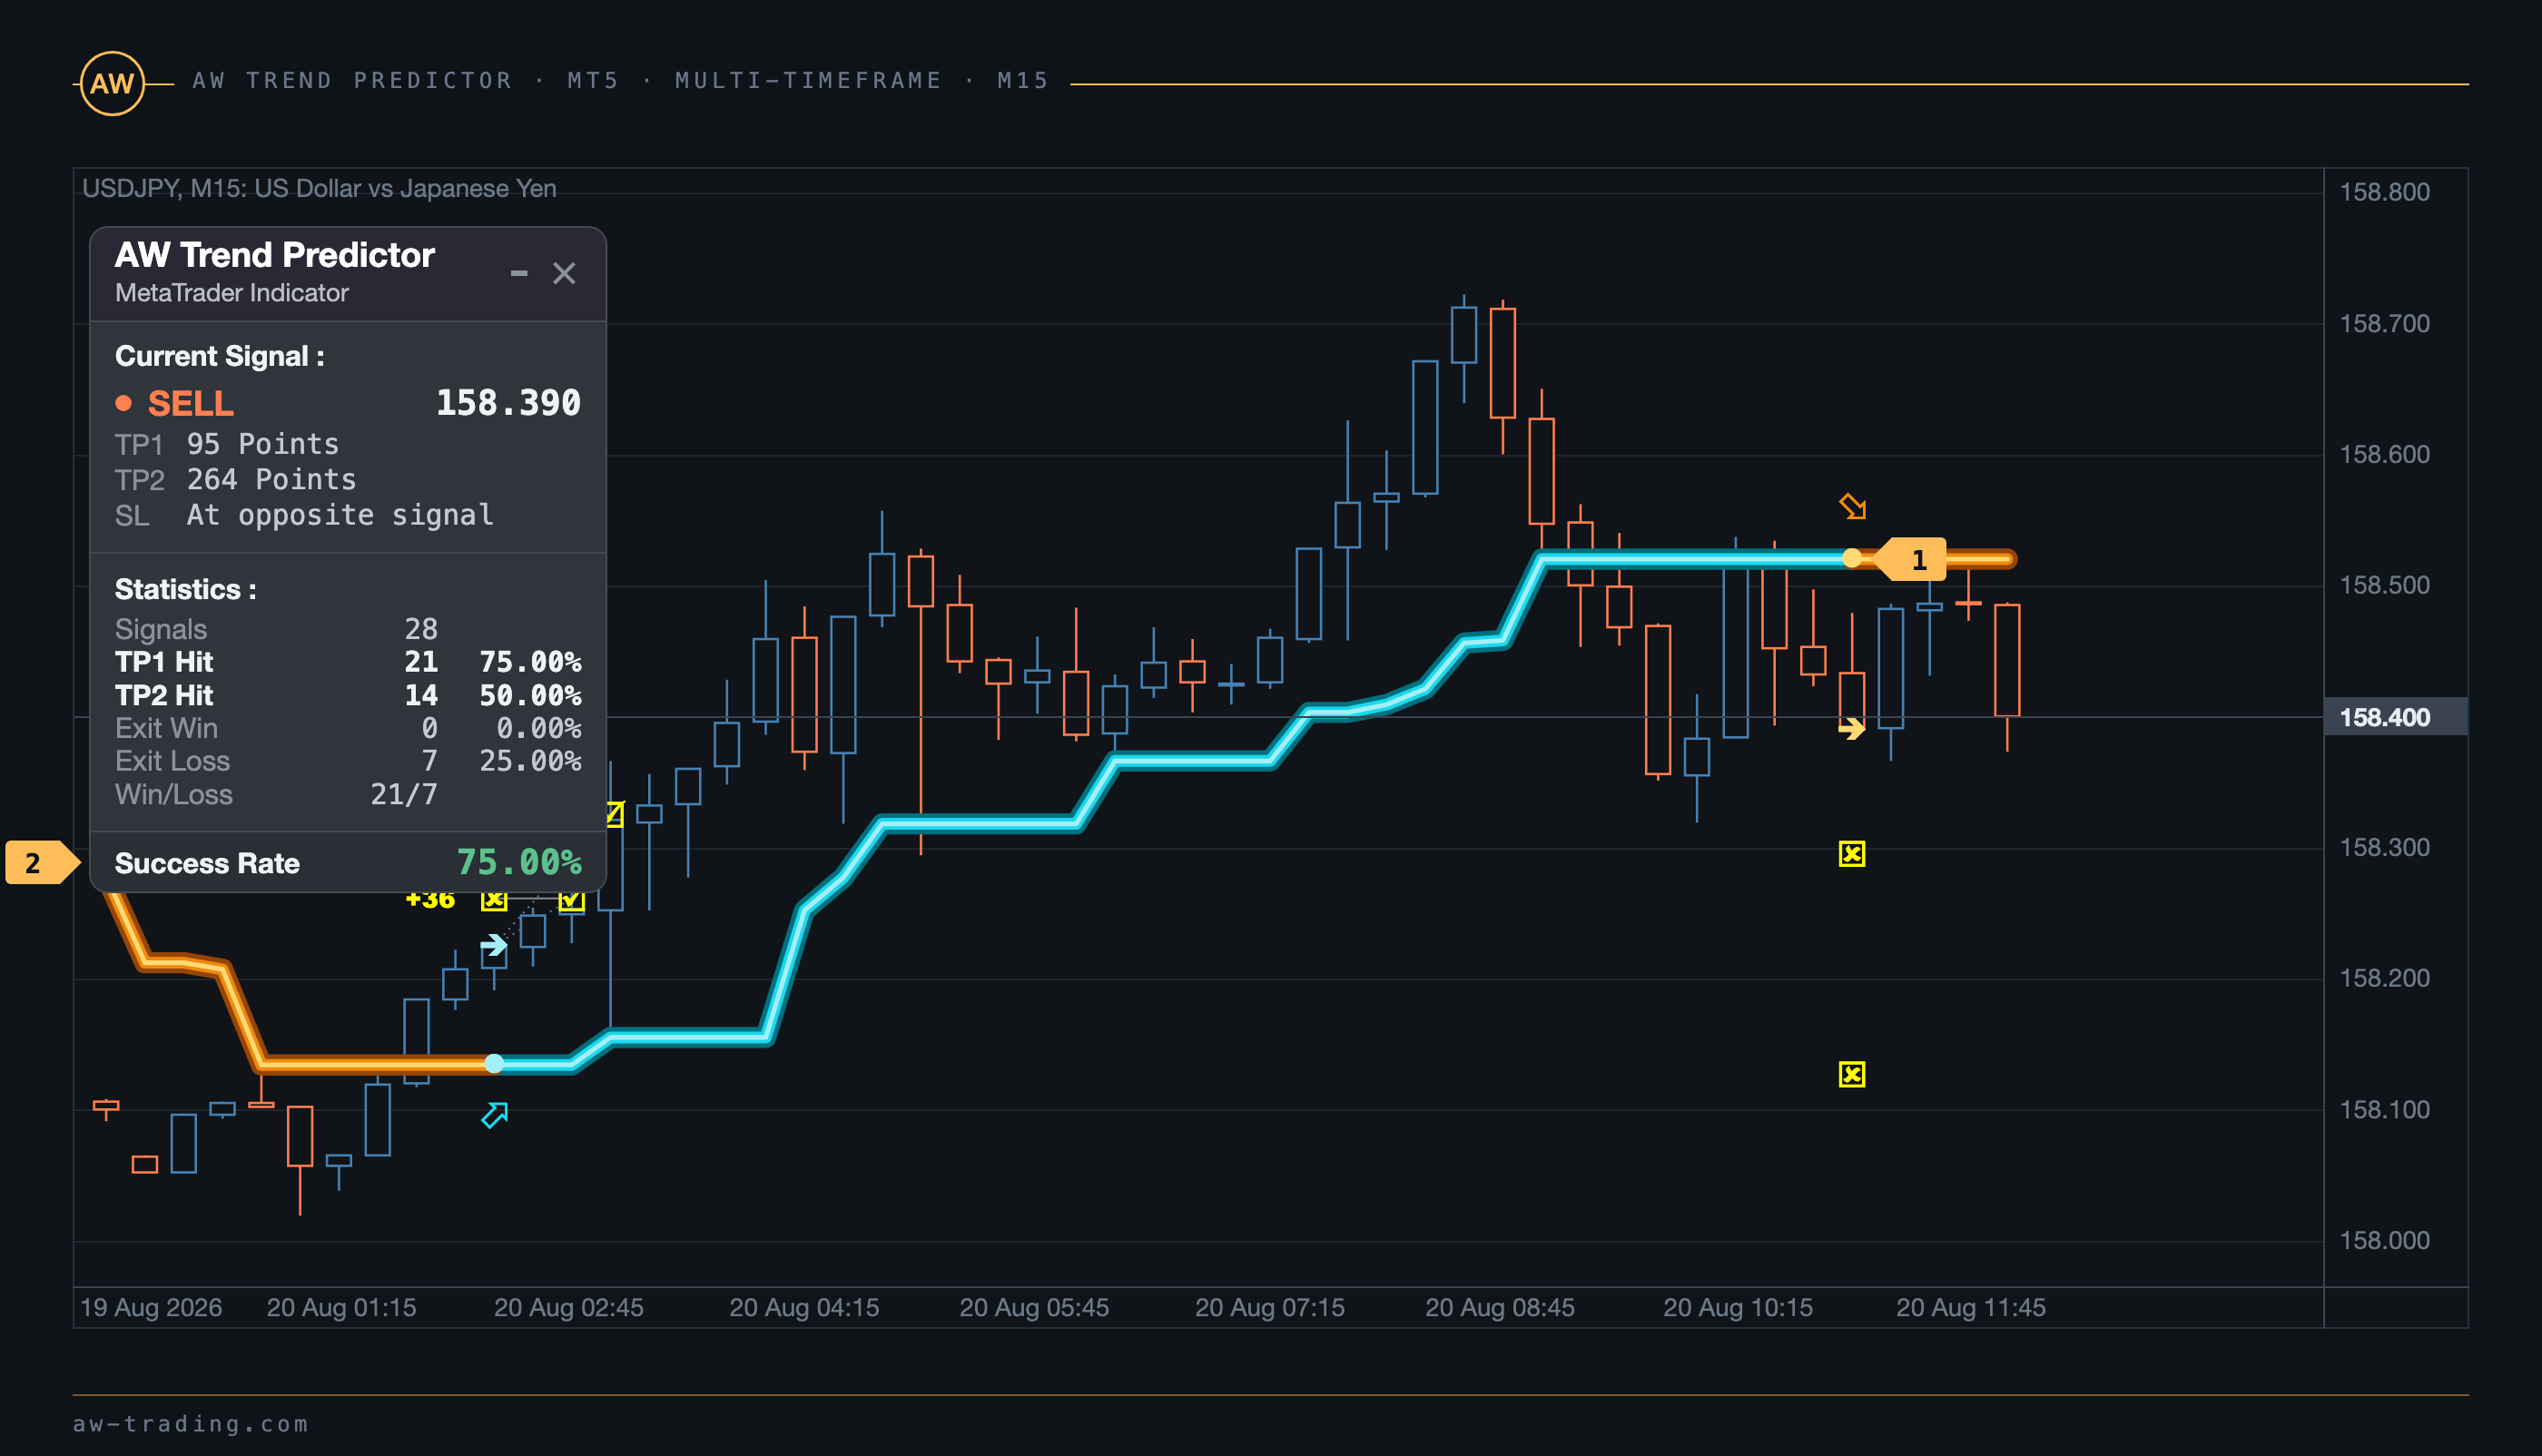
| No. | In the frame |
|---|---|
| 1 | A sell signal on M15, 20 August at 11:00, at the price of 158.390: at the top of the upward pullback, in the direction of the H4 trend. |
| 2 | The M15 Success Rate - 75.00%. |
Step 4 - Setting the StopLoss by one of the two modes, section 5.
Step 5 - Choosing the TakeProfit strategy, section 3.
7. Notifications
The indicator reports a new signal at the close of the bar on which the signal appeared. The channels are enabled in the NOTIFICATIONS SETTINGS section: the pop-up window Send PopUp Alerts with the sound Play sound alerts and the sound file Sound name, the e-mail Send mails and the push notification to the phone Send push notifications. Push requires a MetaQuotes ID in the terminal settings, e-mail requires a mail server.
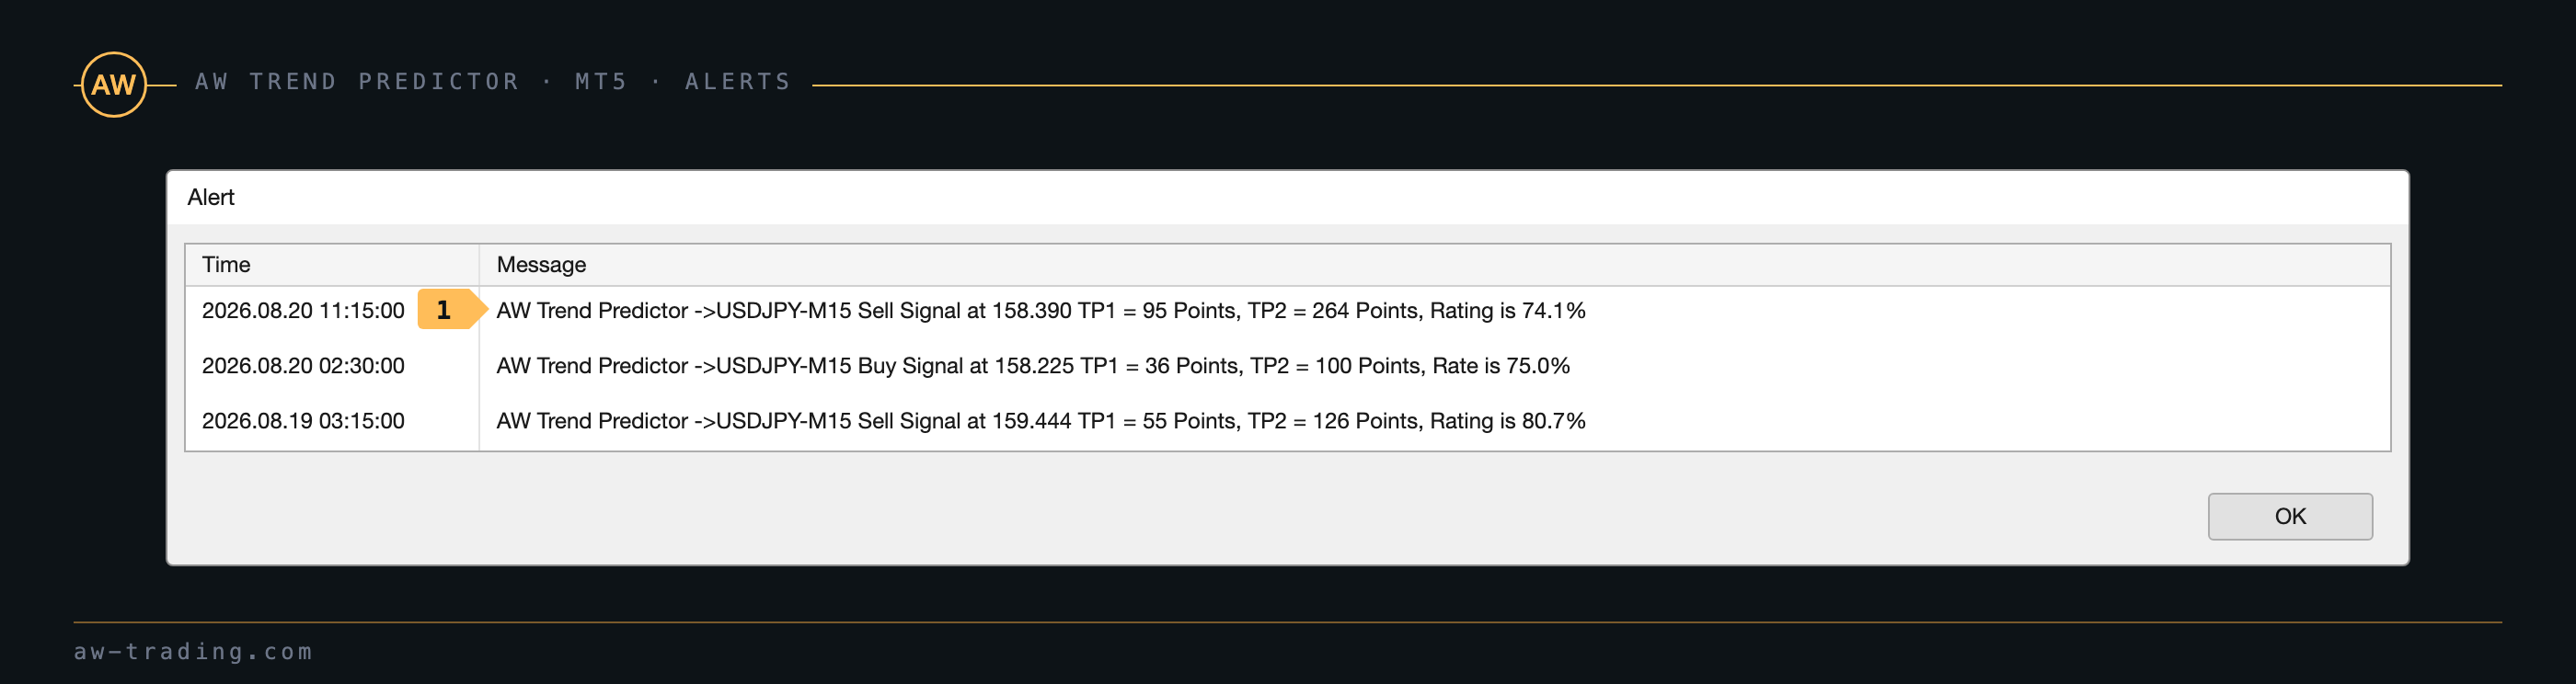
| No. | In the message |
|---|---|
| 1 | The symbol and the timeframe, the direction of the signal, the entry price, the distance to TP1 and TP2 in points and the Success Rate of the chart at the moment of the signal. |
Disable notifications in the DEVELOPERS SETTINGS section turns off all the notifications at once, without touching the other variables of the section.
Buy AW Trend Predictor:
MT5 version
👉 https://www.mql5.com/en/market/product/28260
MT4 version
👉 https://www.mql5.com/en/market/product/43299
8. AW Trend Pad
AW Trend Pad - a multi-currency panel for AW Trend Predictor. In one window it shows the trend and the Success Rate of the signals over a list of symbols and timeframes: up to 15 symbols and up to 9 timeframes, that is up to 135 charts at once. Trend Pad requires AW Trend Predictor to be installed in the terminal.
Buyers of AW Trend Predictor get AW Trend Pad for free. After the purchase of the indicator a message has to be sent to the page https://www.mql5.com/en/users/nechaevrealle/news.
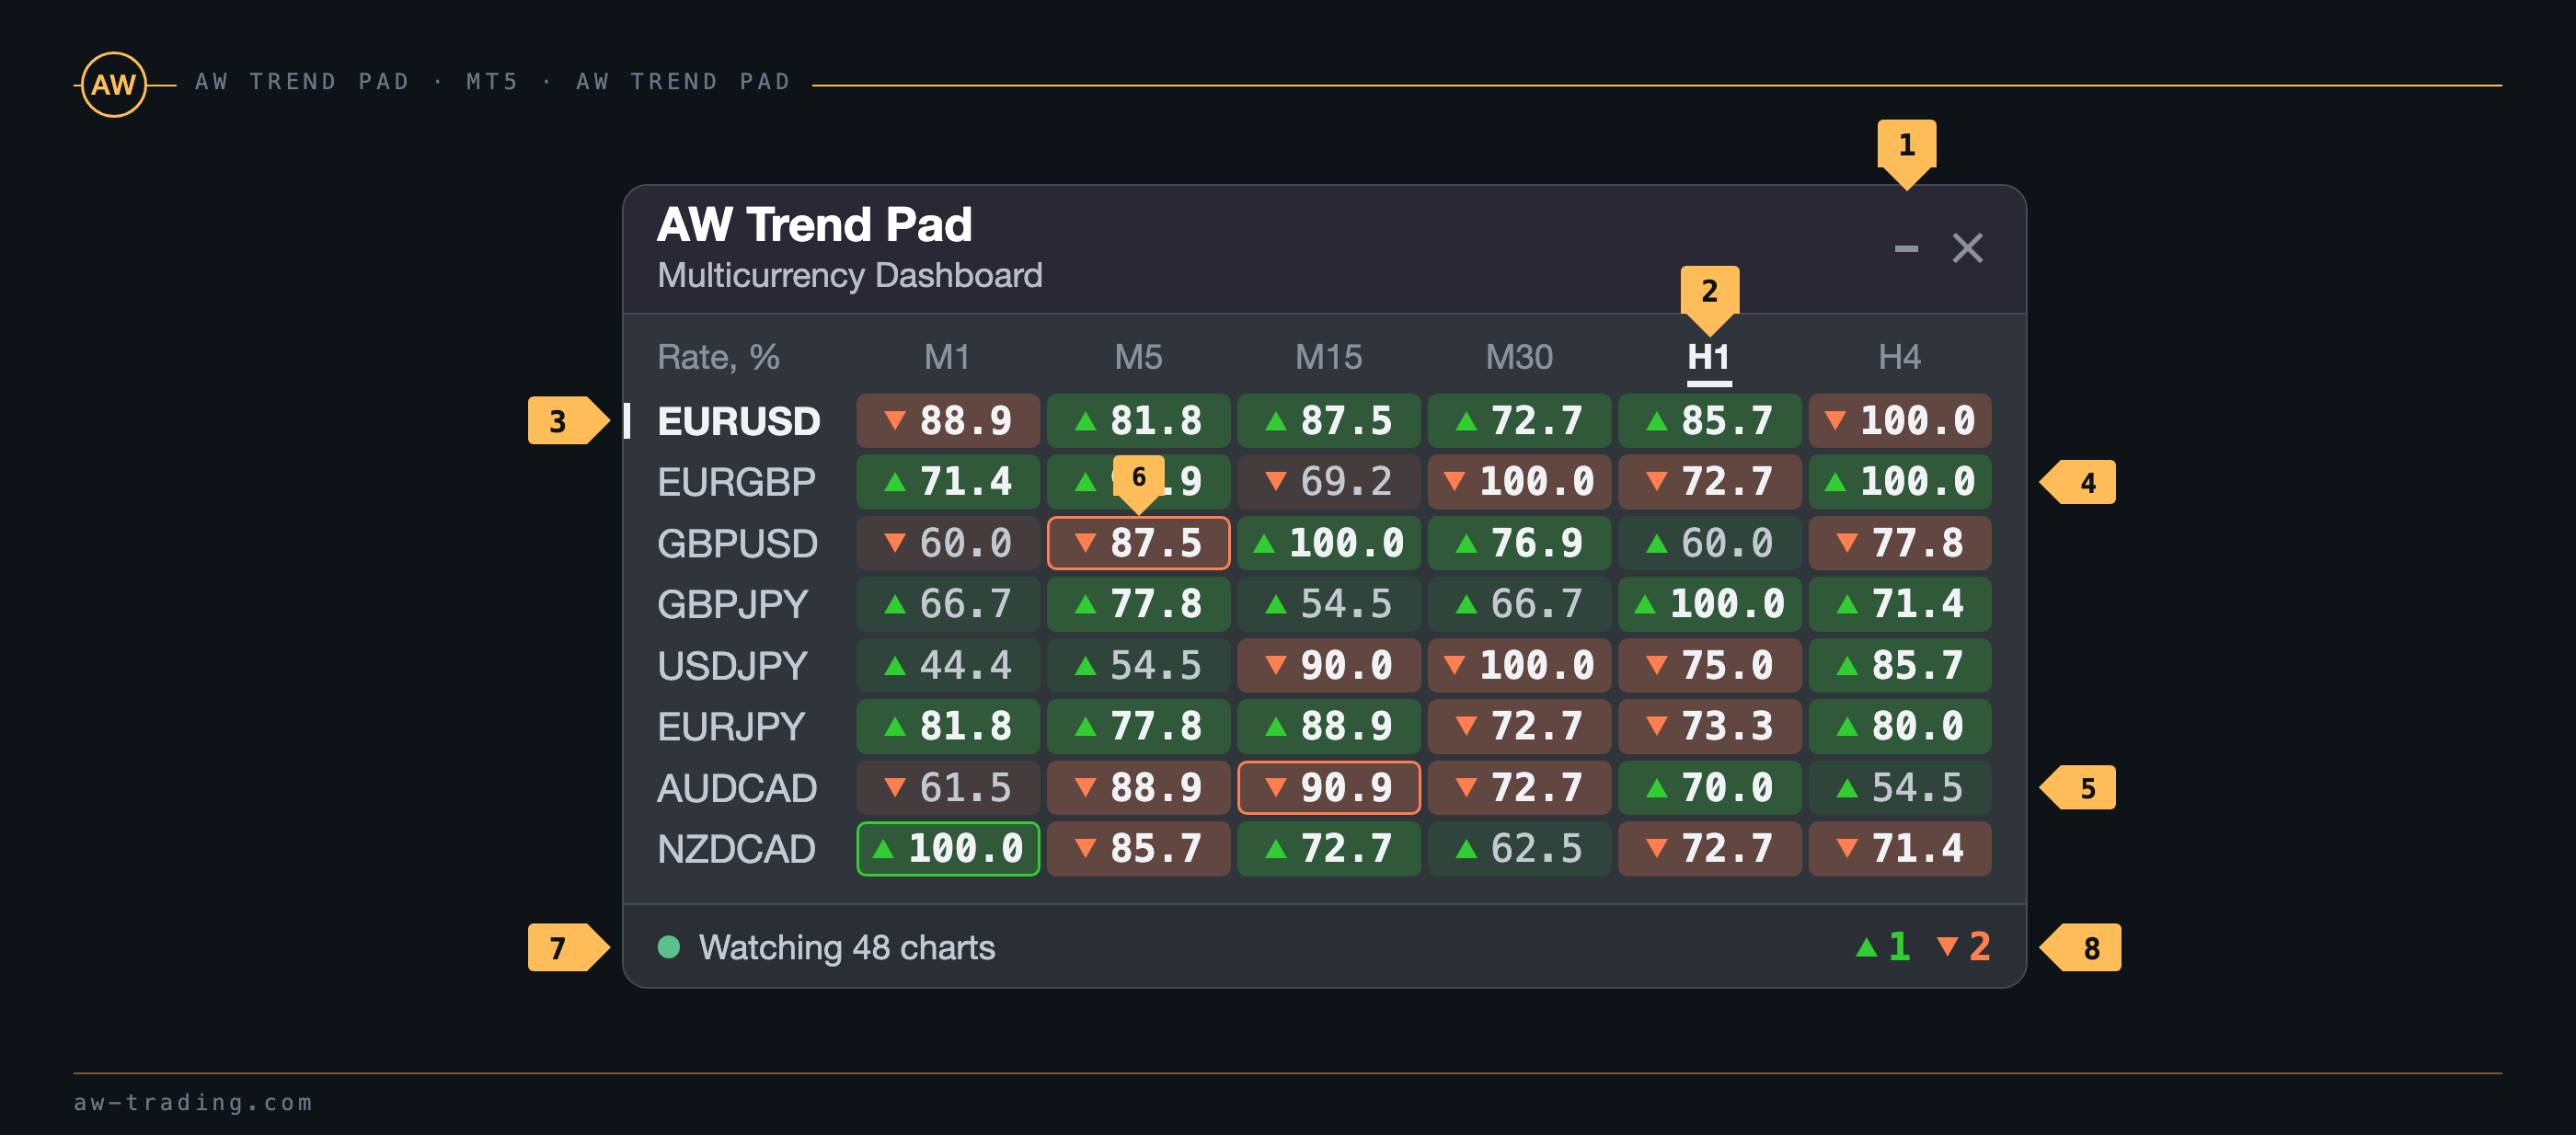
| No. | On the panel |
|---|---|
| 1 | The window buttons. The dash collapses the panel, the cross removes Trend Pad from the chart on the second click. |
| 2 | The timeframe columns. The timeframe of the current chart is highlighted and underlined. |
| 3 | The symbol rows. The symbol of the current chart is highlighted and marked with a stripe at the left edge. |
| 4 | A cell with a Success Rate of 70% or higher: a bright fill and a bold number. The triangle and the color of the cell show the trend: green up, coral down. |
| 5 | A cell with a Success Rate below 70%: a muted fill. |
| 6 | A border in the color of the trend: a new signal appeared on the bar that has just closed on that chart. |
| 7 | The status: Watching N charts - all the charts are calculated, Loading history - the terminal is still loading the history, Symbol not found - a symbol from the list is not present in the terminal. The LED is green, yellow or red respectively. |
| 8 | The counter of new signals: how many cells with a border there are for buys and for sells. |
A click on a cell switches the chart to its symbol and timeframe. A cell with a dash has not received data yet, and such a cell has the No data yet tooltip. On hover the tooltip of a cell shows the symbol, the timeframe, the trend and the Success Rate.
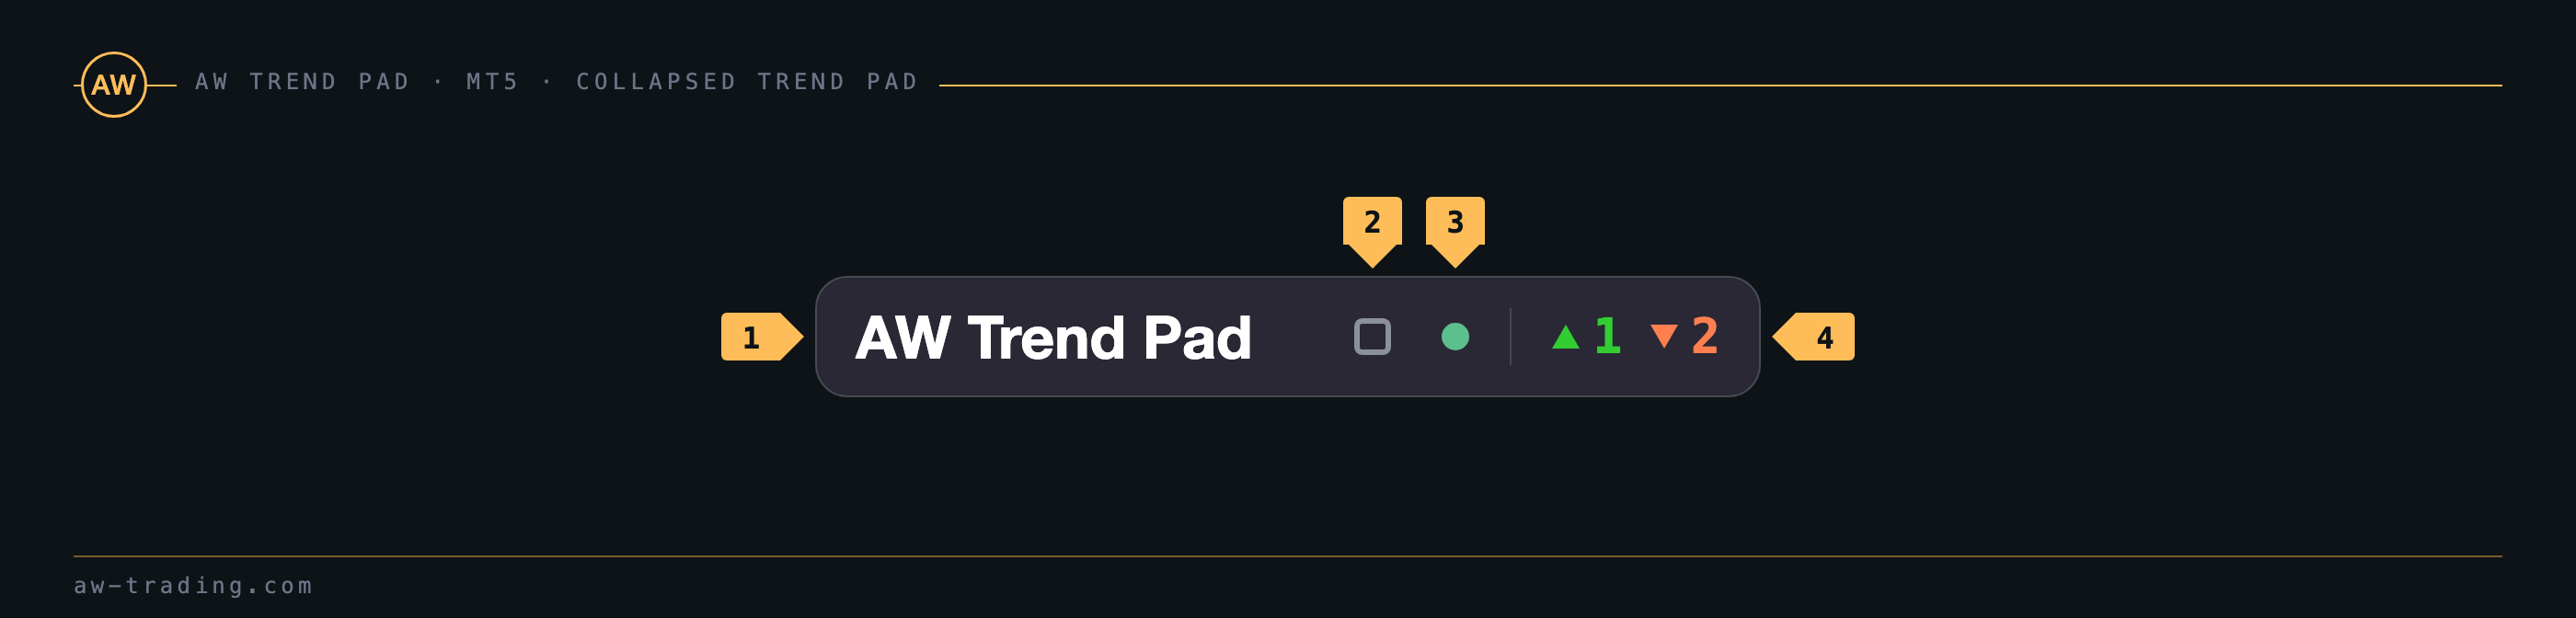
| No. | The collapsed panel |
|---|---|
| 1 | The name. |
| 2 | The button that expands the panel. |
| 3 | The status LED, the same colors as in the footer of the full panel. |
| 4 | The counter of new signals. While there are no new signals, it is not shown. |
Trend Pad sends the same kinds of notifications as the indicator when a new signal appears in any cell. The channels are enabled in the NOTIFICATIONS SETTINGS section of the panel, the text of the message is: AW TrendPad ->EURJPY Buy signal at M15, Rate is 88.9%.
How to trade with AW Trend Pad
Step 1 - The H4 timeframe is in an uptrend: only buys in this trend. In a downtrend, only sells. A lower timeframe, M15 for example, is used for the entry.
Step 2 - A Success Rate of 70% or higher and a new signal on the lower timeframe in the direction of the higher timeframe trend. Signals against the trend of the higher timeframe are skipped. A click on the cell opens that chart.
Step 3 - The StopLoss on the opposite signal or at support and resistance levels.
Step 4 - The TakeProfit strategy: the whole position at TP1, half at TP1 and half at TP2, or the whole position at the reversal of the trend.
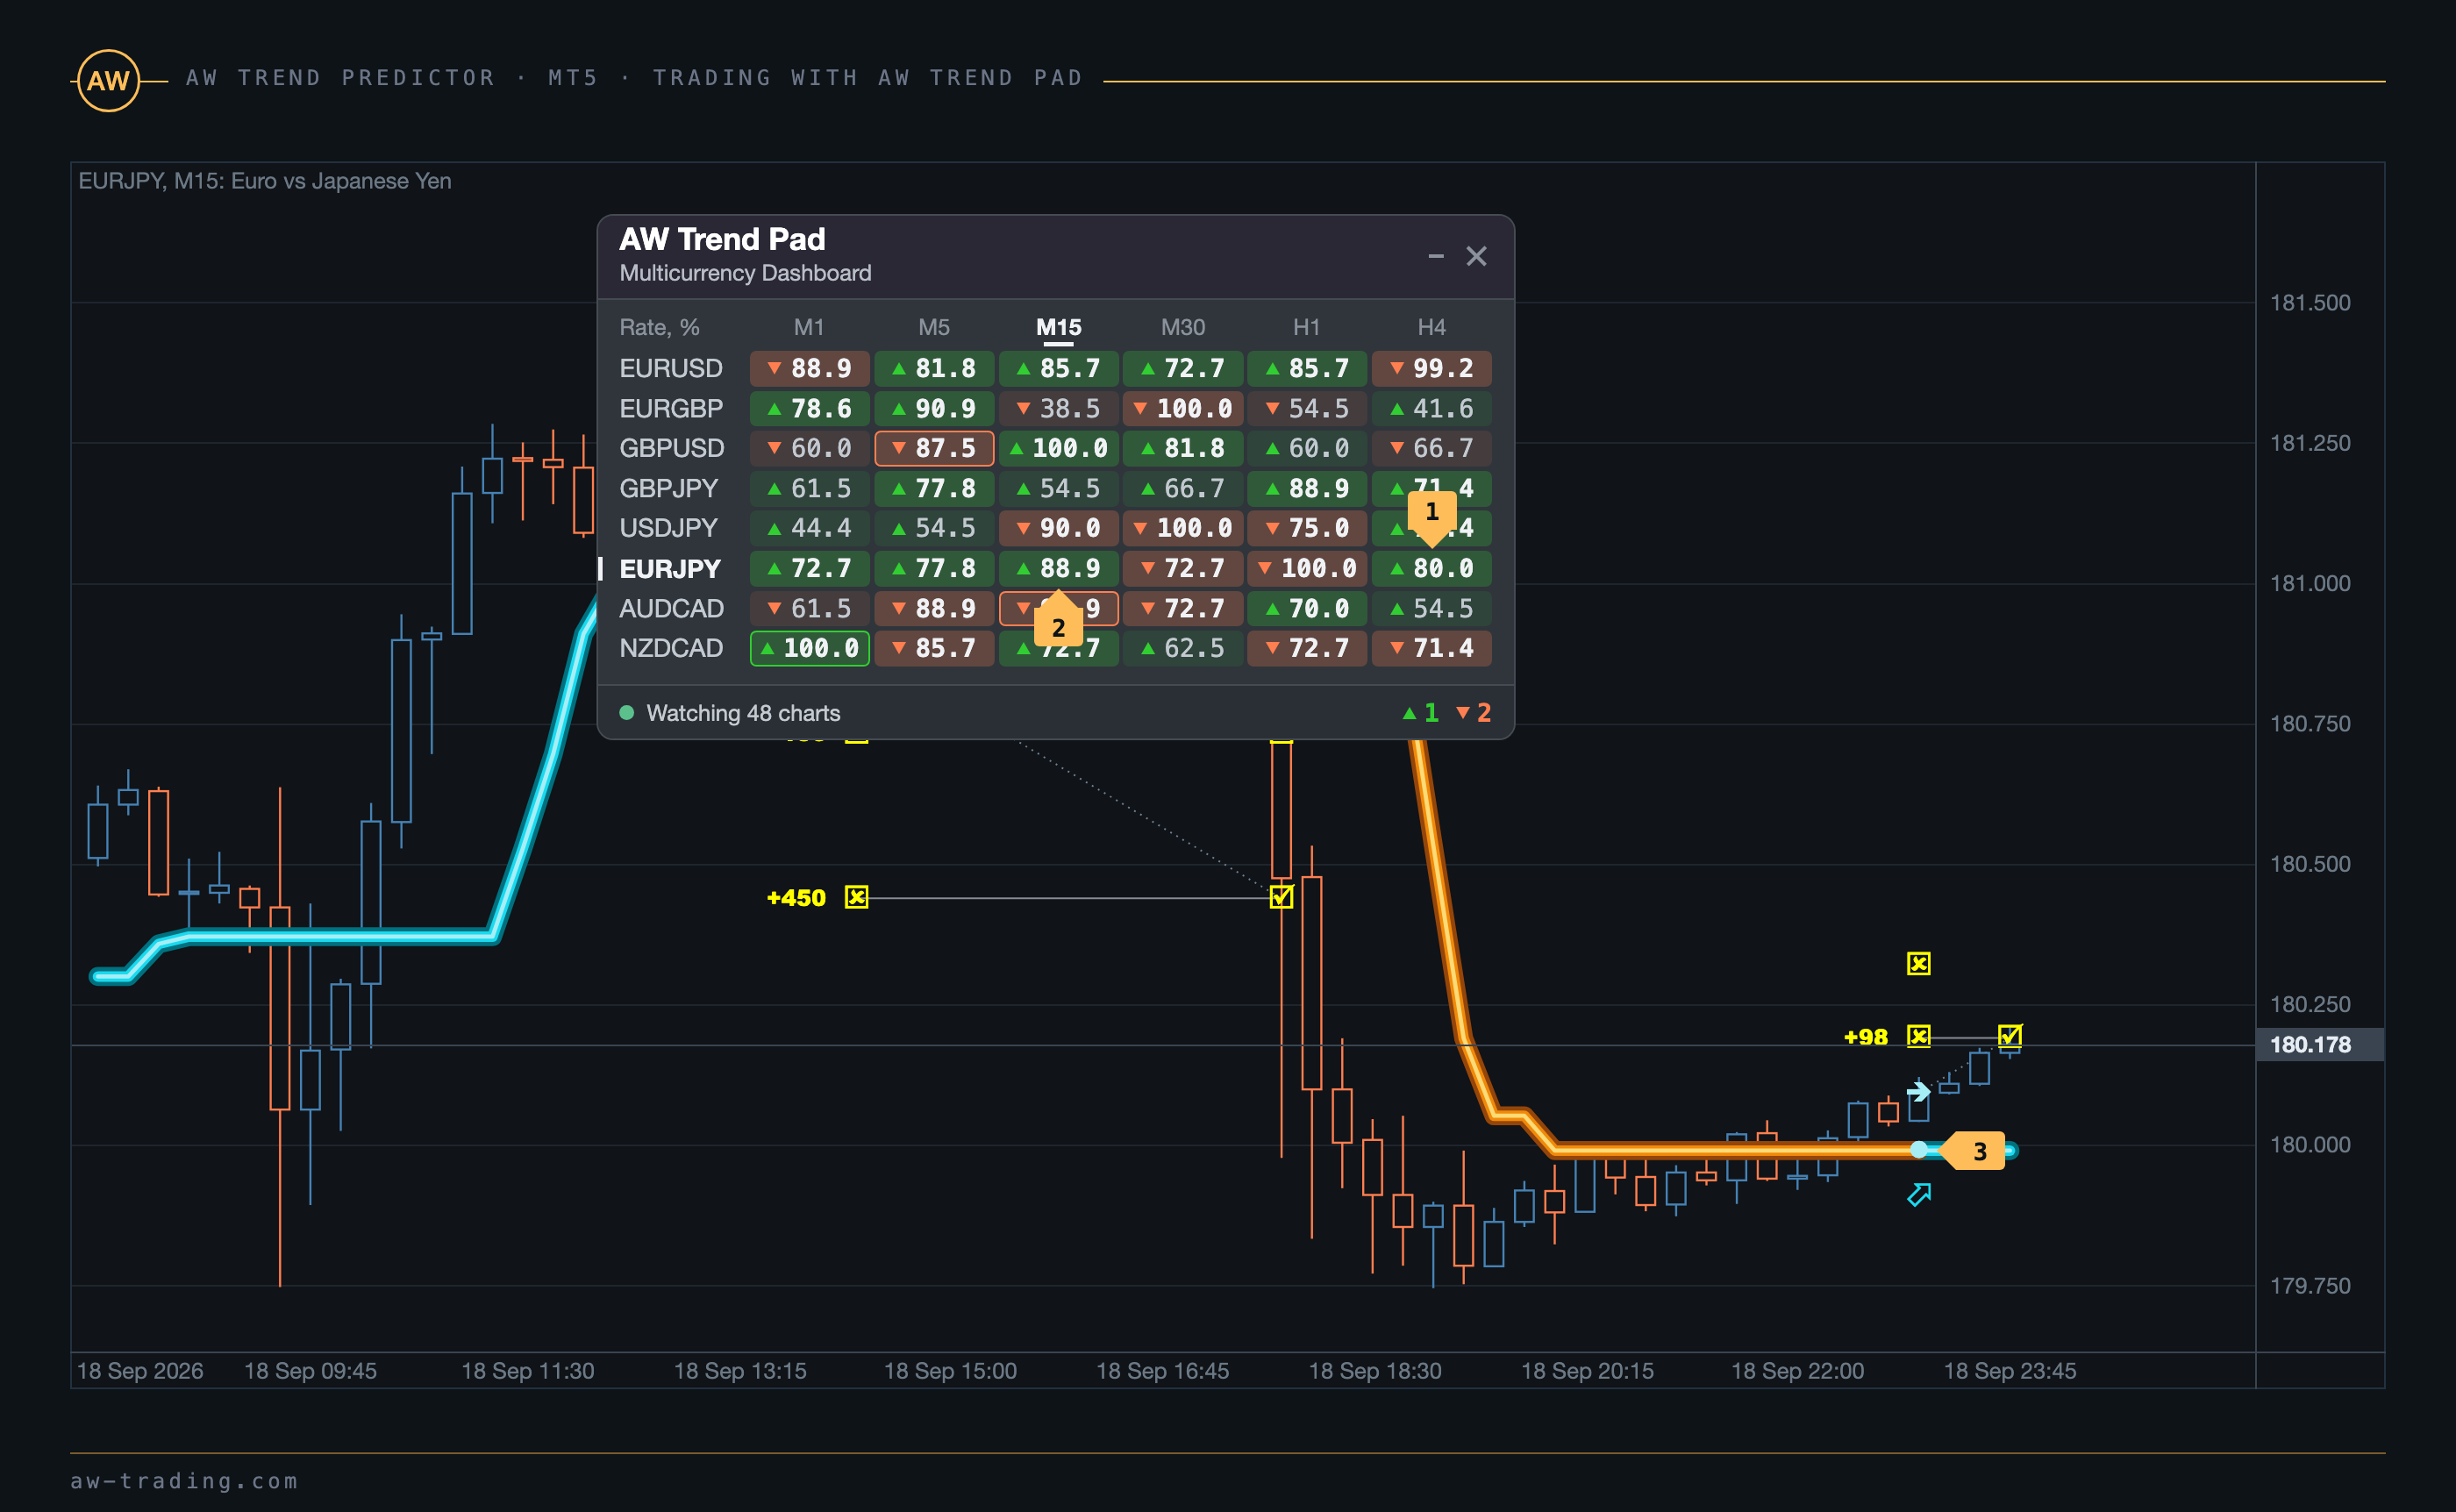
| No. | In the frame |
|---|---|
| 1 | EURJPY H4: an uptrend, a Success Rate of 80.0%. |
| 2 | EURJPY M15, the chart that is open at the moment: an uptrend, a Success Rate of 88.9%. |
| 3 | A buy signal on M15, 18 September 2026, 23:00, in the direction of the H4 trend. |
9. Input settings of AW Trend Predictor
The names of the sections and variables below are as in the MT5 version. In the MT4 version the MAIN SIGNAL SETTINGS section is called MAIN SETTINGS, DEVELOPERS SETTINGS - MISC SETTINGS, and the Multiplier of target variable - TakeProfits target, which stands second in the section, right after Period.
MAIN SIGNAL SETTINGS - the main signal settings
- Period - the period of the indicator
- the larger it is, the lower the sensitivity of the signals
- the smaller it is, the higher the sensitivity of the signals
- values up to 5 give signals for entries, values from 5 to 14 suit trend filtering
- StopLoss Mode - the stop mode: SL at opposite signal or Dynamic StopLoss, section 5
- StopLoss target - the multiplier of the distance to the stop in the Dynamic StopLoss mode: the higher the value, the farther the stop from the entry price
- Multiplier of target - the multiplier of the distance to TP1 and TP2
- the larger the value, the farther the targets and the larger the result of the trade, but the less often the targets are reached and the lower the Success Rate
- the smaller the value, the closer the targets and the higher the Success Rate, but the smaller the result of the trade
- Maximum bars - the history depth in bars on which the indicator draws the signals and counts the statistics. The larger the value, the more signals in the statistics and the longer the calculation at startup
DEVELOPERS SETTINGS - settings for running the indicator inside other algorithms
- Disable graphics buffers - turns off the graphics buffers that take no part in the calculation of the signals and the trend
- Disable objects - turns off the creation and updating of the graphical objects: the labels, the target lines and the panel
- Disable notifications - turns off all the notifications of the indicator
- Show panel - shows or hides the panel
NOTIFICATIONS SETTINGS - notifications about new signals
- Send PopUp Alerts - the pop-up Alert window in the terminal
- Play sound alerts - the sound together with the pop-up window
- Sound name - the sound file from the Sounds folder of the terminal
- Send mails - an e-mail to the address set in the terminal settings
- Send push notifications - a push notification to the mobile terminal
GRAPHICS SETTINGS - the look of the line, the markers and the panel
- Indicator at foreground - the indicator lines above the candles or below them
- Lines thickness - the thickness of the trend line: Thin lines, Medium lines, Bold lines
- Color scheme for lines - the color scheme of the line, the arrows and the markers: Neon, Steel, Amethyst, Graphite or Custom, section 1
- Custom: fat / medium / skinny downtrend color, Custom: fat / medium / skinny uptrend color - the three layers of the downtrend and the uptrend line, for the Custom scheme only
- Custom: up arrow color, Custom: down arrow color - the color of the signal arrows, for the Custom scheme only
- Arrow size - the size of the signal arrows
- Custom: color TP - the color of the target markers and labels, for the Custom scheme only
- Font size TP - the size of the target labels
- Custom: color TP line, Custom: color TP trendline - the color of the target level line and of the dotted line from the entry to the target, for the Custom scheme only
- Custom: color SL label, Custom: color SL trendline - the color of the label and the line of the close at the stop, for the Custom scheme only
- Color scheme for panel - the dark or the light scheme of the panel
- Panel size - the size of the panel: Auto by screen DPI, Small (100%), Medium (125%), Large (150%)
- Font size - the size of the panel font, the same steps, Auto follows the panel size
10. Input settings of AW Trend Pad
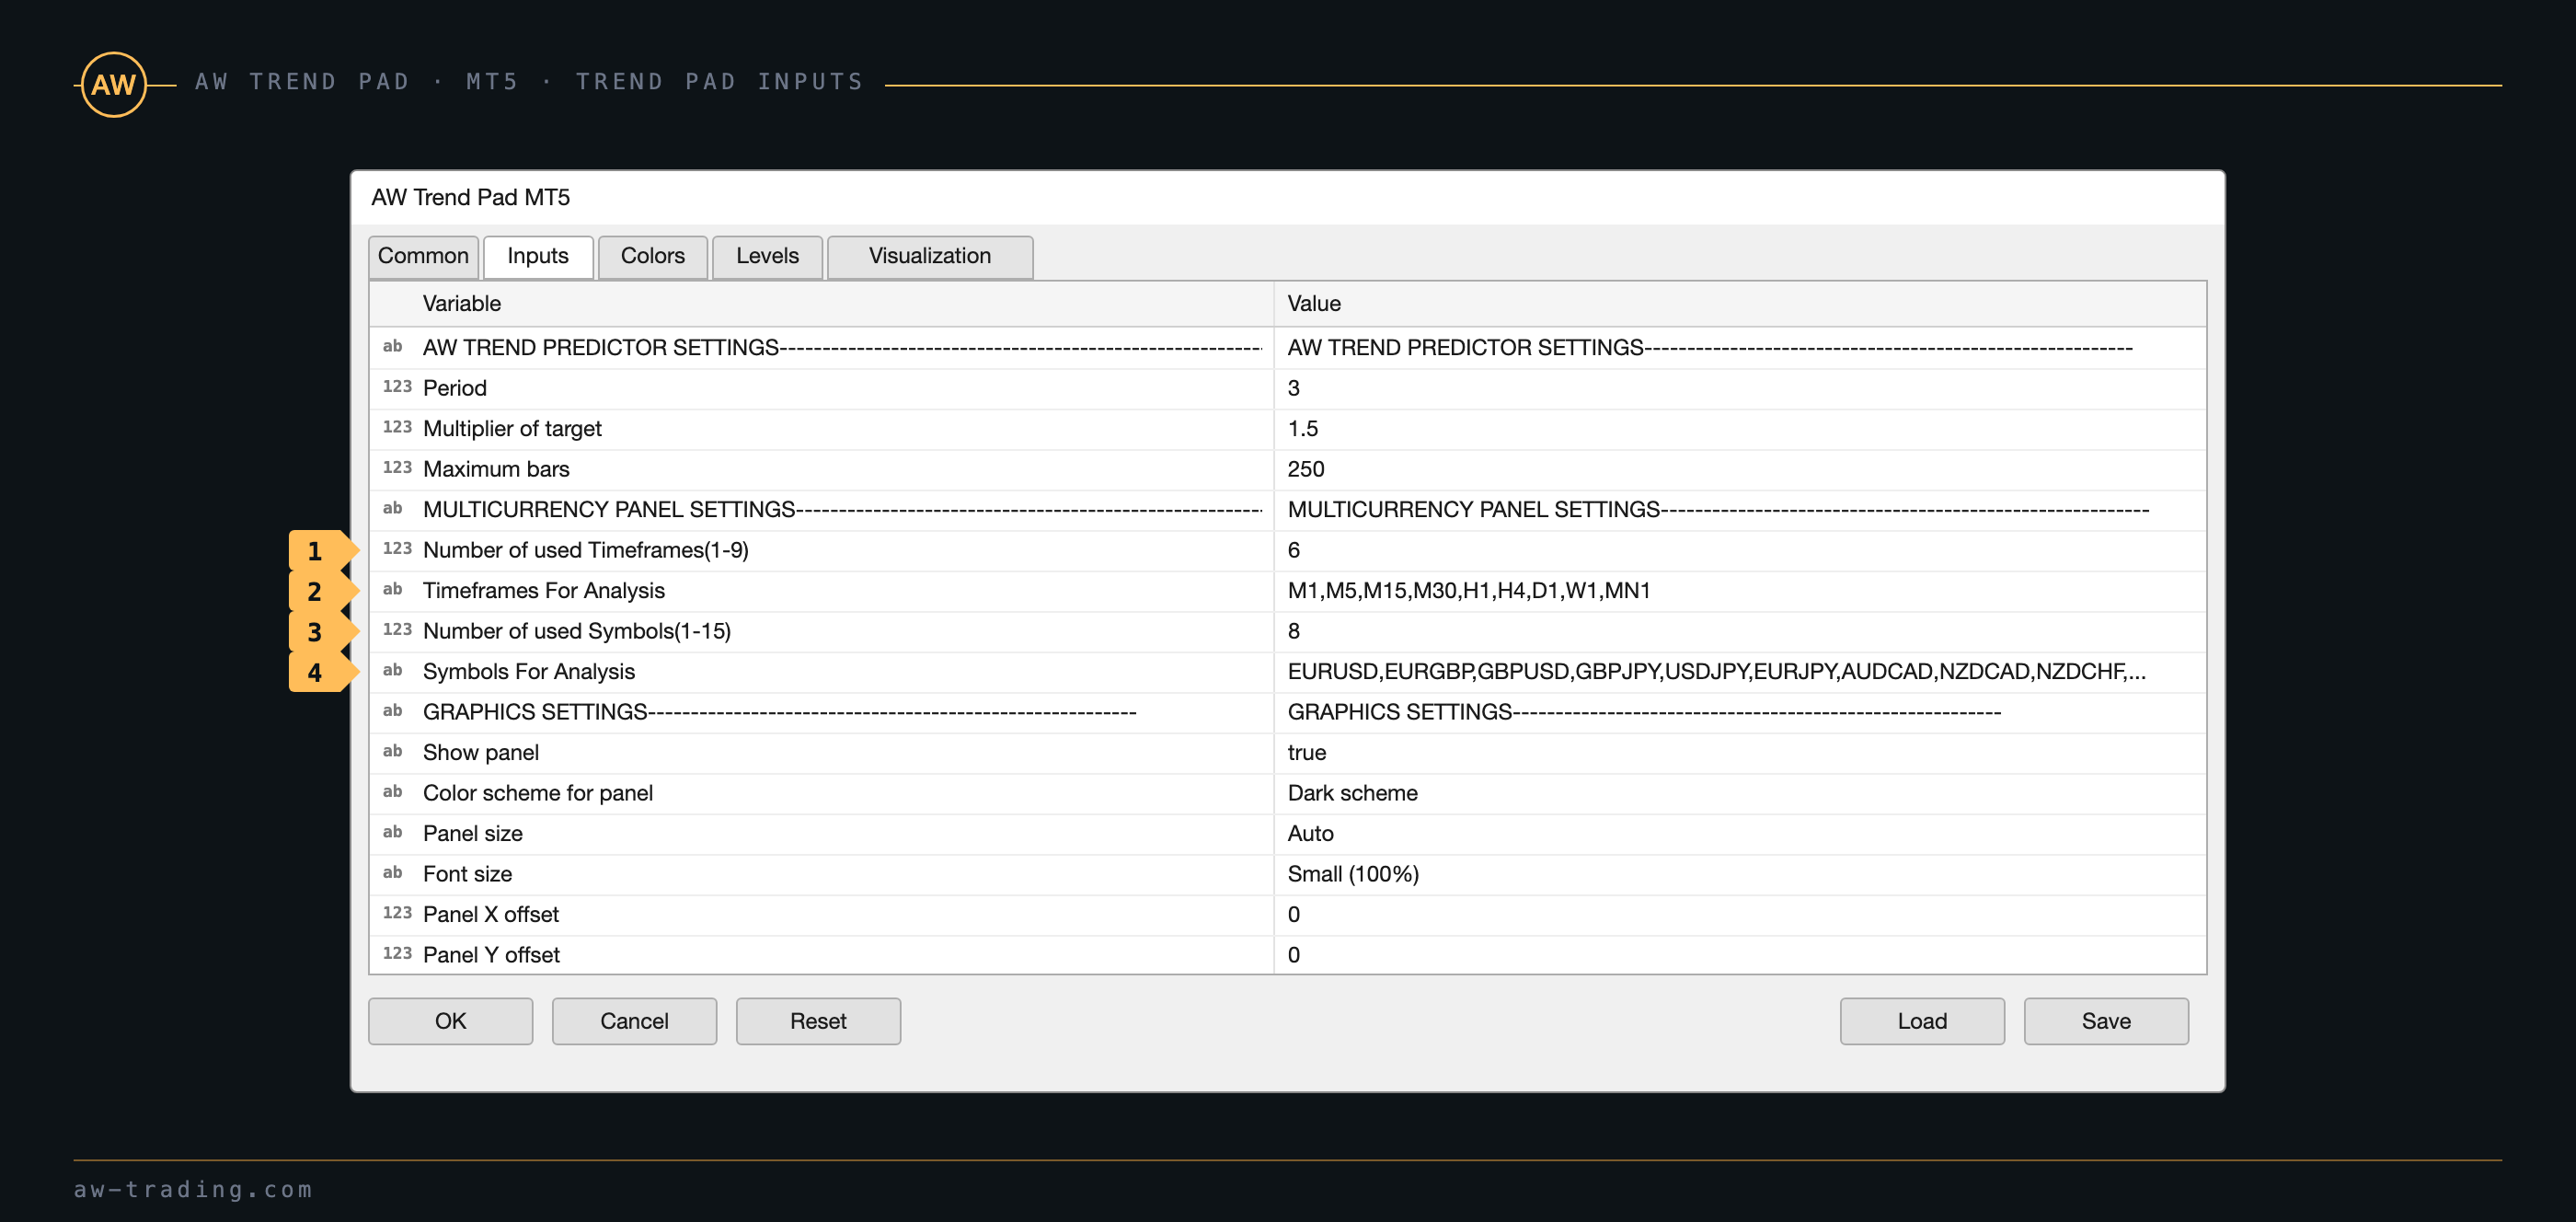
| No. | Variable |
|---|---|
| 1 | Number of used Timeframes(1-9): how many timeframes from the list are shown. |
| 2 | Timeframes For Analysis: the list of timeframes separated by commas, in the required order. |
| 3 | Number of used Symbols(1-15): how many symbols from the list are shown. |
| 4 | Symbols For Analysis: the list of symbols separated by commas. |
AW TREND PREDICTOR SETTINGS - the calculation of the signals in the cells
- Period - the calculation period, with the same meaning as in the indicator: the larger it is, the lower the sensitivity of the signals
- Multiplier of target - the multiplier of the distance to the targets by which the Success Rate is counted: the larger it is, the farther the targets and the lower the Success Rate
- Maximum bars - the history depth in bars for the statistics of each cell
MULTICURRENCY PANEL SETTINGS - symbols and timeframes
- Number of used Timeframes(1-9) - the number of columns, from 1 to 9. The first timeframes of the list are taken
- Timeframes For Analysis - the timeframes separated by commas, without spaces, for example M15,H1,H4,D1
- Number of used Symbols(1-15) - the number of rows, from 1 to 15. The first symbols of the list are taken
- Symbols For Analysis - the symbols separated by commas, without spaces, spelled as in the Market Watch window: a symbol with a broker suffix is written together with the suffix
GRAPHICS SETTINGS
- Show panel - shows or hides the panel
- Color scheme for panel - the dark or the light scheme
- Panel size and Font size - the size of the panel and of the font, as in the indicator
- Panel X offset, Panel Y offset - the horizontal and the vertical offset of the panel in pixels
NOTIFICATIONS SETTINGS - Send PopUp Alerts, Play sound alerts, Sound name, Send mails, Send push notifications, as in the indicator
11. For developers
The indicator finds the signals at the close of a bar, so in an EA the values are read from the bar with index 1. A call through iCustom needs only the first ten input parameters in the order in which they follow.
| No. | MT5 | MT4 |
|---|---|---|
| 1 | MAIN SIGNAL SETTINGS (header string) | MAIN SETTINGS (header string) |
| 2 | Period | Period |
| 3 | StopLoss Mode (1 - SL at opposite signal, 2 - Dynamic StopLoss) | TakeProfits target |
| 4 | StopLoss target | StopLoss Mode |
| 5 | Multiplier of target | StopLoss target |
| 6 | Maximum bars | Maximum bars |
| 7 | DEVELOPERS SETTINGS (header string) | MISC SETTINGS (header string) |
| 8 | Disable graphics buffers | Disable graphics buffers |
| 9 | Disable objects | Disable objects |
| 10 | Disable notifications | Disable notifications |
For work inside an EA, Disable objects and Disable notifications are set to true. The buffers numbered 37-44 exist only in the MT5 version, buffers 0-36 are the same on both platforms.
| Data | Buffer | Values |
|---|---|---|
| Uptrend | 0 | >0 - an uptrend, the value of the line |
| Downtrend | 1 | >0 - a downtrend, the value of the line. On the signal bar both buffers 0 and 1 are filled, and the direction on that bar is set by buffers 9 and 10 |
| Buy Signal | 9 | >0 - a buy signal |
| Sell Signal | 10 | >0 - a sell signal |
| Entry Price Buy / Sell | 14 / 15 | the entry price, the close of the signal bar, on the signal bar only |
| Take Profit 1 / 2 Price | 16 / 17 | the price of the target, on the signal bar only |
| Take Profit 1 / 2 Points | 18 / 19 | the distance to the target in points from the entry price, held until the next signal |
| Take Profit 1 / 2 Hit | 22 / 23 | the price of the target on the bar where the target was reached |
| Take Profit 1 / 2 Hit Percent | 24 / 25 | from 0.00 to 100.00 |
| Exit Loss / Exit Win | 26 / 27 | 1 on the bar of the opposite signal that closed the trade at a loss / in profit |
| Exit Loss / Exit Win Percent | 28 / 29 | from 0.00 to 100.00 |
| StopLoss Price | 31 | the price of the stop on the signal bar, Dynamic StopLoss only |
| StopLoss Points | 33 | the distance to the stop in points, Dynamic StopLoss only |
| Signals | 34 | an integer, the signals in the statistics |
| Success Rate | 35 | from 0.00 to 100.00 |
| Take Profit 1 / 2 Price, the current signal | 37 / 38 | the price of the target, held until the next signal, MT5 only |
| StopLoss Price, the current signal | 39 | the price of the stop, Dynamic StopLoss only and MT5 only |
| Entry Price, the current signal | 40 | the entry price, MT5 only |
| Take Profit 1 / 2 Hit Number | 41 / 42 | an integer, MT5 only |
| Exit Win / Exit Loss Number | 43 / 44 | an integer, MT5 only |
The statistical buffers 24, 25, 28, 29, 34, 35 and 41-44 are recalculated on every new signal and hold their value until the next one. An example for MT5:
int h = iCustom(_Symbol, _Period, "Market\\AW Trend Predictor MT5", "", 3, 1, 1.0, 2.0, 1000, "", false, true, true); double buy[1], sell[1], rate[1]; CopyBuffer(h, 9, 1, 1, buy); // the closed bar CopyBuffer(h, 10, 1, 1, sell); CopyBuffer(h, 35, 1, 1, rate); bool newBuy = buy[0] > 0 && rate[0] >= 70.0; bool newSell = sell[0] > 0 && rate[0] >= 70.0;
Buy AW Trend Predictor:
MT5 version
👉 https://www.mql5.com/en/market/product/28260
MT4 version
👉 https://www.mql5.com/en/market/product/43299

AW Trading Software


