")

Optimizing True Direction Oscillator (Part One)
When Larry Connor asked himself if the best parameter to use RSI with is 14 he ended up his researches by developing the RSI2 or Relative Strength Index with just 2 period of data. This opened my mind to build an instrument to find the best parameter for TDO, which is my simple expert "Bermaui Average EA".
You can know more about True Direction Oscillator (TDO) from here:
1- Link for User's Manual: https://www.mql5.com/en/blogs/post/717970
2- Product Link: https://www.mql5.com/en/market/product/12914
3- True Direction Oscillator F.A.Q: https://www.mql5.com/en/blogs/post/722015
4- Buy/Rent True Direction Oscillator (TDO) from here: https://www.mql5.com/en/market/product/12914
As you know, TDO Panel depends in its calculation of the first candle. If the first candle is one, then the fifth or last one in the panel series will be 16 (1-2-4-8-16). If the first candle is 10 then the last will be 160.
Defining the most suitable parameter of the current symbol might not be an easy step, because each symbol or a chart we trade change. So, what is volatile today might have been dead few months ago, and what trend today might had moved in a narrow range in the past. That is why defining the most suitable parameter should be a continuous process that the trader goes through on regular intervals.
In this article I want to show you how to use Bermaui Average EA to find the most suitable parameters to trade. This blog will be important for serious traders who want to find a way to enhance their use of TDO and make it better.
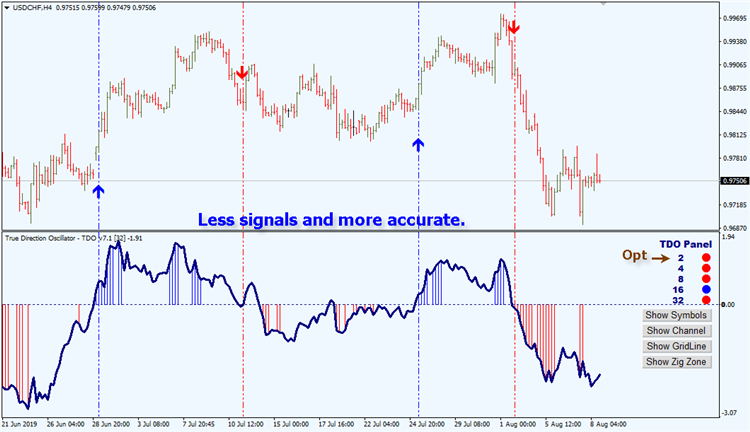
As an example in the next two charts I want to show you how that optimization gives better signals which lead to more accurate trading decisions. 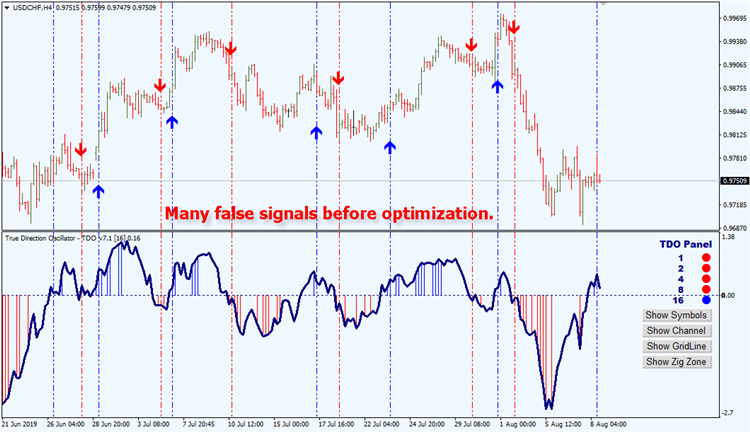
.
.
As you can see the un optimized chart used one as the value of the first candle which lead to a lot of whipsaws and false signals. After optimization the first candle was set to two as you can see in the second chart which lead to more accurate signals.
The principal of commonality in FOREX trading
When we optimize any indicator in forex we will find that optimization results will look similar for the same group of currencies. As an example, if you run optimization for US Dollar group (currencies traded against the US dollar. like AUDUSD, NZDUSD, USDCHF…etc.) you will find that the best parameters are similar for different pairs.
That is normal because those pairs carry a similar factor between them, which is the US dollar in this example.
Before we complete I assume that you understand how to use MT4 System tester. And that you have some knowledge about optimization. Also, that you know what is " True Direction Oscillator" and that you read my previous articles about the concept of pure momentum.
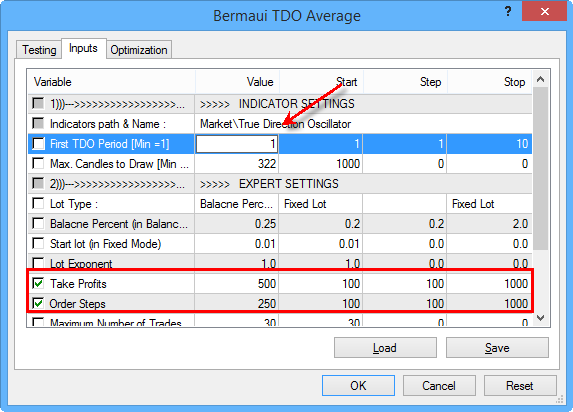
Parameters to Optimize
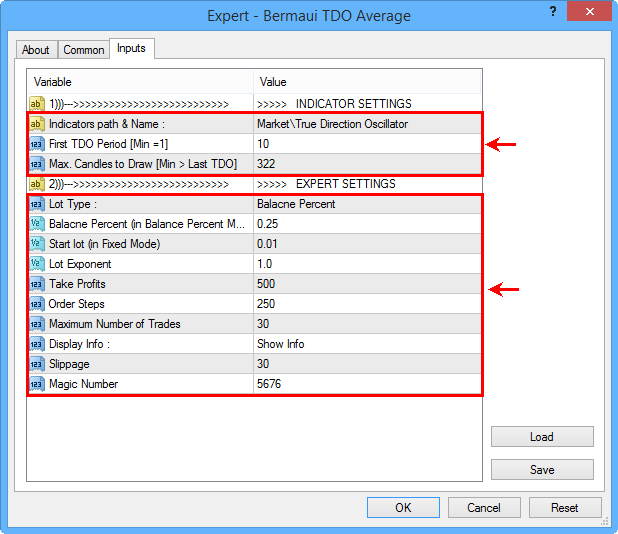
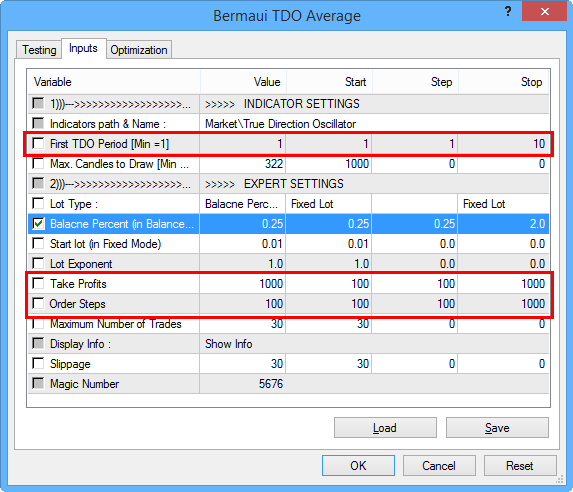
Bermaui TDO Average EA have two set of parameters.- TDO Parameters
- Money Management Parameters.
Like in next pic:
.
To make an optimization test with good results then we should not mix both of them. We should cut our optimization test to two or three steps. In each of them we work on optimizing one set of parameters before we go to the next. This will be done for every currency pair we trade.
We begin with identifying the time period of the test. As an example, we might make the test on 1hour or 4 hour or even daily time-frame, because as a general rule the higher the time-frame the better the results you will get from technical analysis tools.
Second, we begin our test with the TDO parameter set, then we move to optimize the money management section.
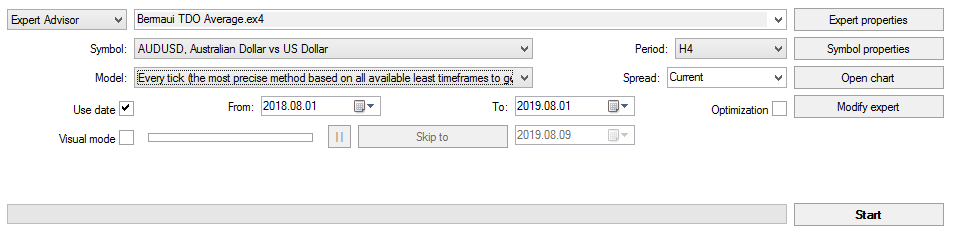
The next example will be on AUDUSD H4, for a complete year. I will begin by optimizing the TDO parameter then I will move to money management setups.
Indicator Parameters Optimization Example
- Currency Pair: AUDUSD
- Time-Frame: 4 hours.
- Test Period: 1 year (August 2018 to August 2019)
- Balance: 1000$
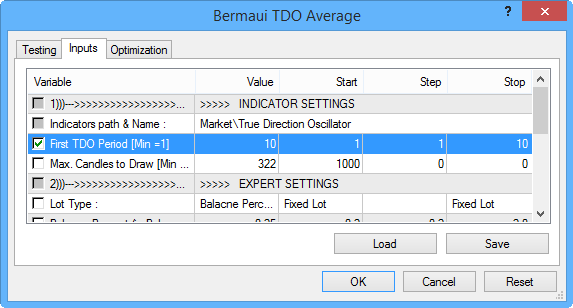
- Parameter to test: First TDO Period
- Test Mode: Every Tick
.
This will be an easy test, because it is done on one parameter only. It will start with the value of one and end with 10. Steps will be one at each time. All money management setups will be left as default.
.
After the test we get the results from the 'Optimization Results" section in the system tester. Also, it is good to have a look at "Optimization Graph", especially if our test is done on several parameters at the same time (which is not our case now).
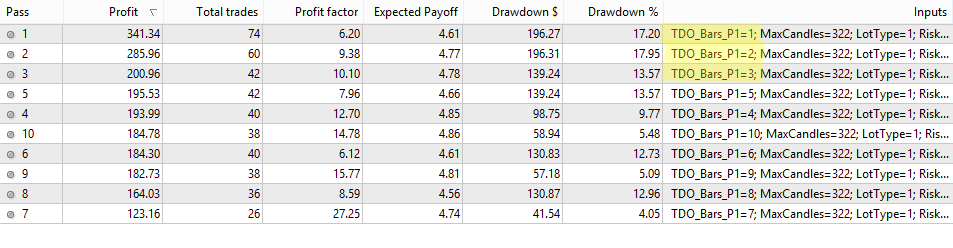
.
As you can see, all tests here ended in profits and that is impressive. It will not always be the case for every test you will do, but that is it! Also, the most profitable setups were using short term parameters. The best results went to making the " First TDO Period" equal to one, then two and three. So, short term parameters did a good job for this period of time on AUDUSD, but if we repeat the test for another period we will get different results and this confirm that we should repeat test from time to time to absorb market changes.
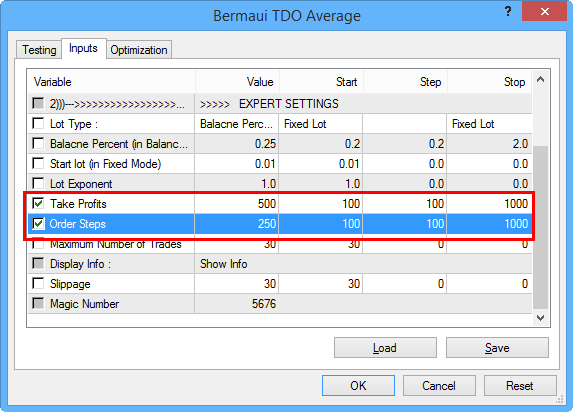
Now we will optimize the money management parameters, to find the best take profit to stop loss ratio.
Money Management Parameters Optimization Example
- Currency Pair: AUDUSD
- Time-Frame: 4 hours.
- Test Period: 1 year (August 2018 to August 2019)
- Balance: 1000$
- Parameter one to test: Take Profits
- Parameter two to test: Order Steps
- Test Mode: Every Tick
The most important thing to do here is to optimize the risk return ration (RRR). The "Take Profit" parameter represent the return part, while the "Order Steps" represent the risk.
.
This test will answer the question about the best RRR to trade with. Is it better to take profits quickly and leave losses to run or the opposite?
Number of test here will be one hundred, because we will test each parameter ten times (10 x 10 = 100 test). We will begin with 100 point for each then we will increase the number of points with another 100 point on the next test until we finish.
It is important to say that we will use the best value for the indicator parameter "First TDO Period" that we got from the previous test. This is very important to make sure that those series of tests complement each other.
.
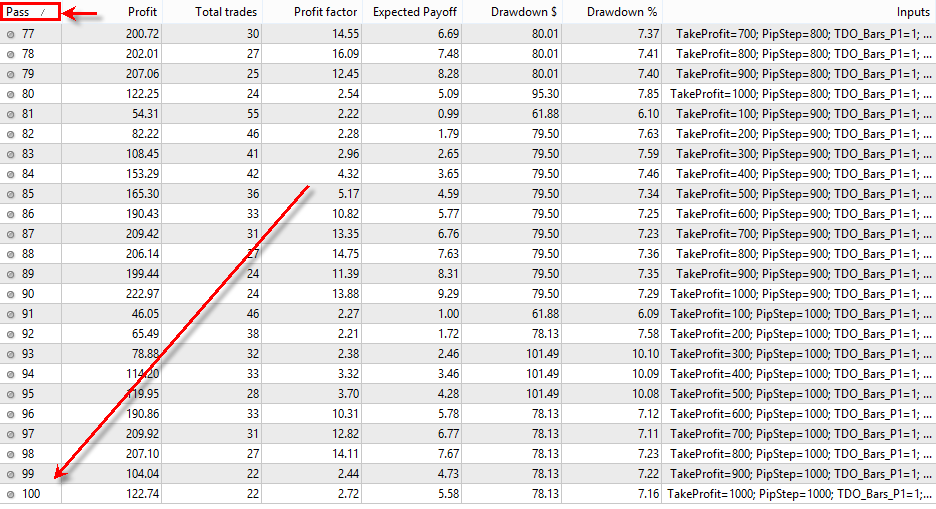
Next table shows that; all the one hundred tests lead to profits. This mean that TDO worked very well with AUDUSD on 4H time-frame. Of course this will not be the same case for each pair or time-frame that you test. But when you will end testing all pairs you will have a very good idea about where to use TDO in your trading.
.
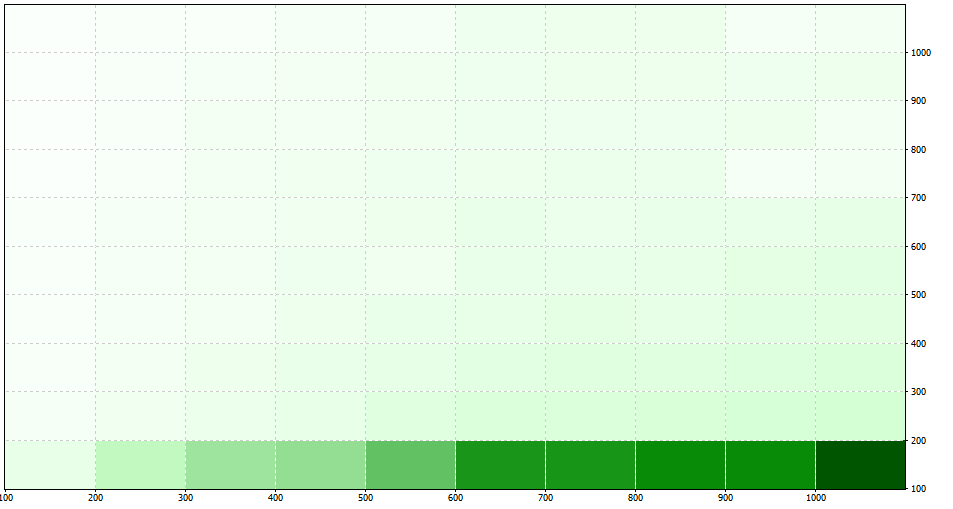
Let us now see the 2 Dimension Optimization Graph.
.
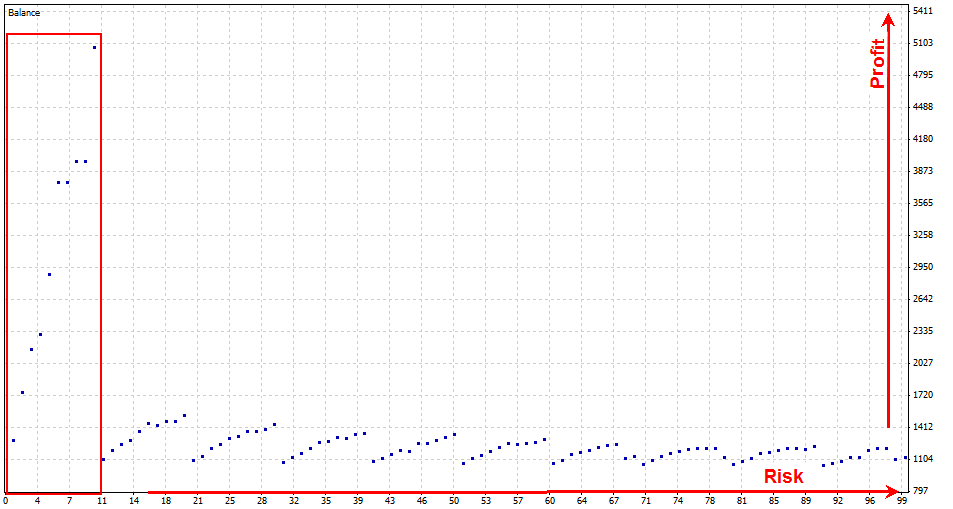
The first thing that you will notice here is the green tape at the bottom. It tells us about the most profitable money management setups. Let us look at the dot graph to explain the results more:
.
What this graph tells us is an old new story. We should increase our take profits as much as possible and reduce risk. The best results came when return was 1000 points and order steps was just 100 points, which is a RRR equal to 10:1. Of course this might be aggressive in reality but it does work here.
So, we should increase our take profits and reduce risk to make our money management rules work toword our favor. Now, let us take all these good results and do our last test to determine the best Lot Size.
Optimizing Lot Size or Balance Percent
- Currency Pair: AUDUSD
- Time-Frame: 4 hours.
- Test Period: 1 year (August 2018 to August 2019)
- Balance: 1000$
- Parameter one to test: Balance Percent
- Test Mode: Every Tick
.
Before I begin I want to show you how this parameter works in determining your lot size. The lot size equation in Bermaui TDO Average EA can be explained in next steps:
Lot = (Account Balance x (Risk Percent / 100)) / (Order Steps)
Example:
If [Account Balance = 1,000$] - [Risk = 0.25% ] - [Order Steps = 250 point]
Then Lot Size = 10,000 * (0.25/100) / 250
= 0.01 lot
If the Lot Size < or > what allowed by the broker, then we use the broker limit.
I know that this might not be the best lot sizing equation that you have ever seen but it works fine. And again we will use the best from our previous tests for this optimization process.
In this test I will begin with 0.25% and then I will add 0.25% for the next test until I finish with 2%. So let us see the results:
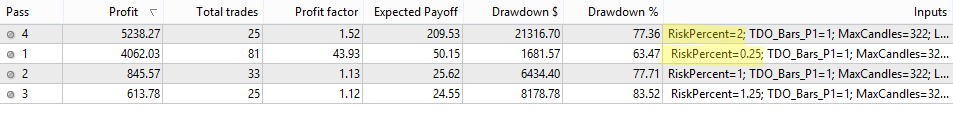
.
The test didn't say too much. The best result come from the 2%, the next was to the 0.25%! this made me want to check both results separately. So, let us look at the equity curve for both setups.
Here is the equity curve of the 2%
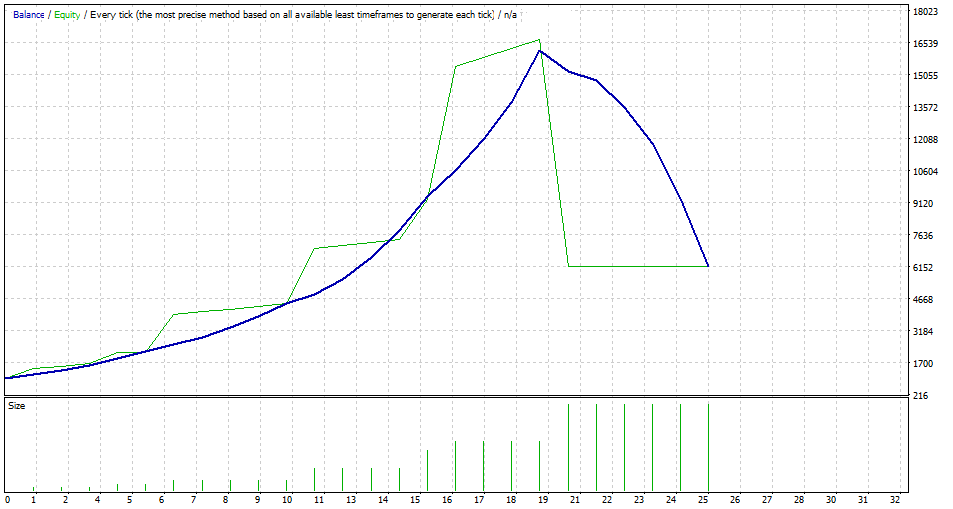
.
As you can see, if a trader uses this aggressive percent then he will be lucky to survive. This 2% made more than 15,000$ of profits beginning with 1000$ of balance, before it drops back to 6,000. This show instability in results which might lead to curve fitting problem in the future if it is used in real trading.
Here is the equity curve of the 0.25%
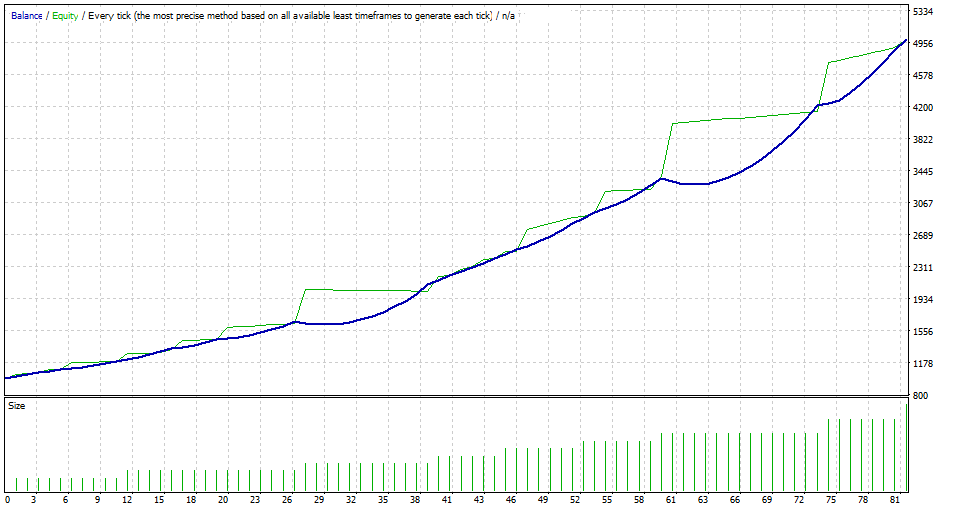
.
I think this is more stable with less draw-down, which is very important in real trading.
Conclusion
- Use Bermaui Average EA to optimize your TDO indicator on the time-frame / Pair you want to trade.
- Run separate optimization tests for indicator parameters and money management.
- Begin with testing TDO indicator parameter first.
- The higher the time-frame that you test the better the results that you will get in real trading.
- Increase your RRR to make sure that you limit losses and keep profits run.
I hope you like the blog and all trick. I think you will get the ideas. Good luck for everyone and have a nice profit with Bermaui TDO.
Muhammad Al Bermaui, CMT


")
![[XAUUSD]: Weekly Liquidity Activation Points (timings), June 22-26, 2026](https://c.mql5.com/6/1013/splash-preview-771790.png "[XAUUSD]: Weekly Liquidity Activation Points (timings), June 22-26, 2026")
")