

Principles of construction of the indicator.
The Absolute Bands (AB) indicator is reminiscent of the Bollinger Bands indicator with its appearance and functions, but only more effective for trading due to the significantly smaller number of false signals issued to them. This effectiveness of the Absolute Bands indicator is due to its robust nature.
In the Bollinger Bands indicator, on both sides of the moving average - Ma, there are lines spaced from Ma by the standard deviations Std=Sqrt(<(X- Ma)^2>) (where X is the price history, <...> is the averaging procedure for a given number of bars) multiplied by the number (2.0 by default). In mathematics, it is proved that an estimate that provides a minimum of the standard deviation is a mathematical expectation, i.e. the moving average on which the Bollinger Bands indicator is based. Therefore, the Bollinger Bands contain all points of the price history in a concentrated manner.
The Absolute Bands indicator is based on the Median = (Max + Min) / 2 moving median line. On both sides of the Median, there are lines spaced from it by moving averages absolute deviations <| X- Median |> multiplied by a number (1.5 by default). At the same time, it is the median that minimizes mean absolute deviations, which is used by the Absolute Bands indicator. Mean absolute deviations are less sensitive to the often purely random price spikes that occur on the market, which makes the Absolute Bands indicator more robust or less responsive to such emissions. While random price surges lead to the classic Bollinger Bands indicator giving false signals.
Absolute Bands indicator readings and trading with it.
-
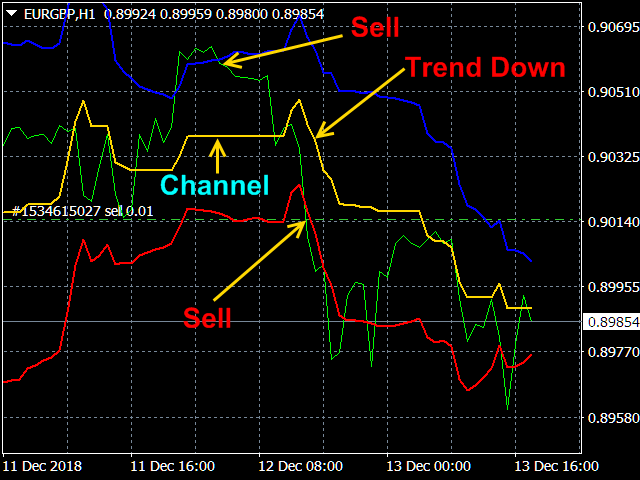
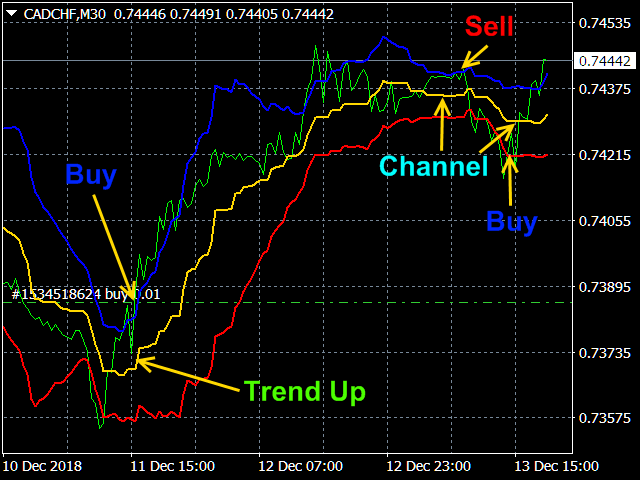
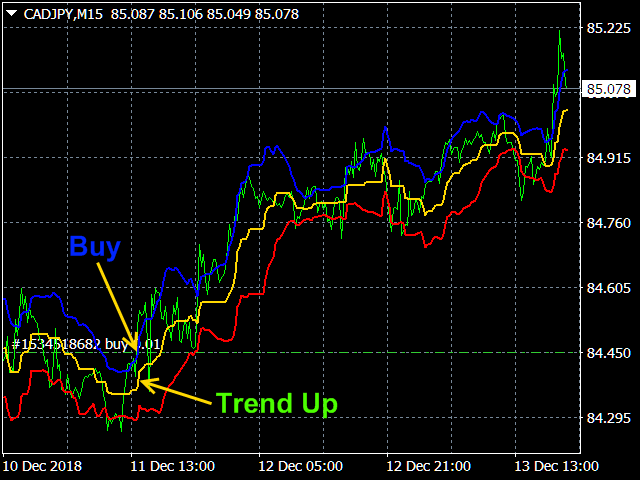
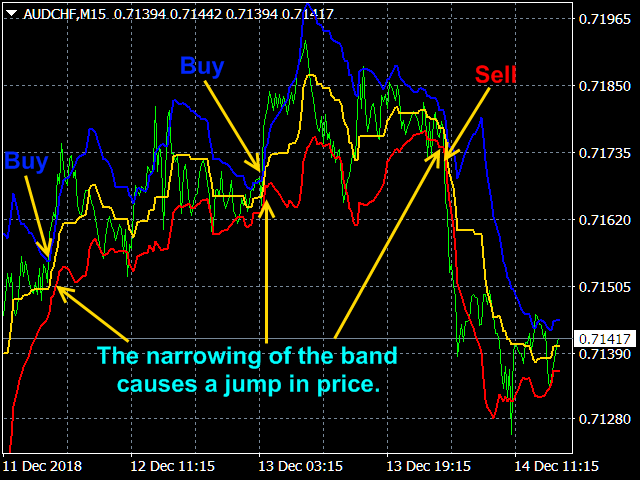
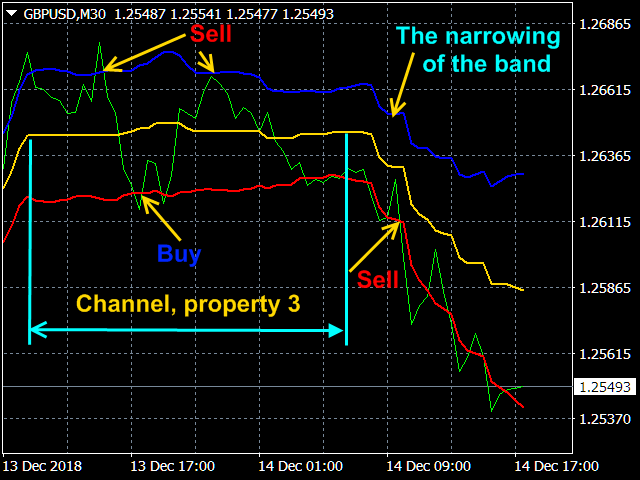
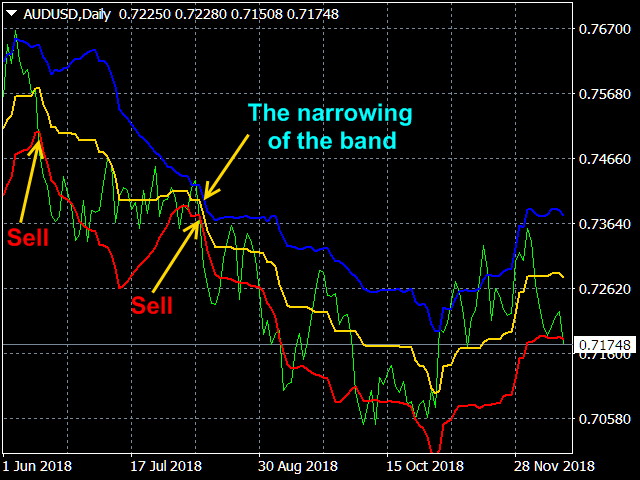
A trend occurs after a period of price consolidation, which is expressed by the Absolute Bands indicator in horizontal middle line and the convergence of the upper and lower lines. If after the consolidation period (1.1) the upper and lower lines diverged, (1.2) the price rose above the upper line (or dropped below the lower line), and (1.3) the middle line went up (down) sharply, then this indicates the beginning of the trend and you need to open position on Buy (Sell).
-
If the price moves from the top line down (from the bottom line up), and the middle line is horizontal, this indicates the origin of the channel (the price most likely reaches the opposite border) and you need to open positions on Sell (Buy).
-
If peaks and valleys outside the boundaries of the Absolute Bands indicator band are followed by peaks and valleys within its band, then a previously established tendency (trend, channel) may end.
All these situations are shown in the screenshots.
Indicator settings.
- Price type - applied price. Values: Close price, Open price, High price, Low price, Median price ((high + low)/2 - default), Typical price ((high + low + close)/3), Weighted price ((high + low + 2*close)/4).
- The averaging period - averaging period. Any integer (20 by default).
- Channel width factor - channel width factor. Values: any real number (1.5 by default).
Screenshots.


![[Two Different Approaches to Market Timing]: The Spiral Calendar and the VISTmany Research Project](https://c.mql5.com/6/1012/splash-preview-771691.png "[Two Different Approaches to Market Timing]: The Spiral Calendar and the VISTmany Research Project")
