

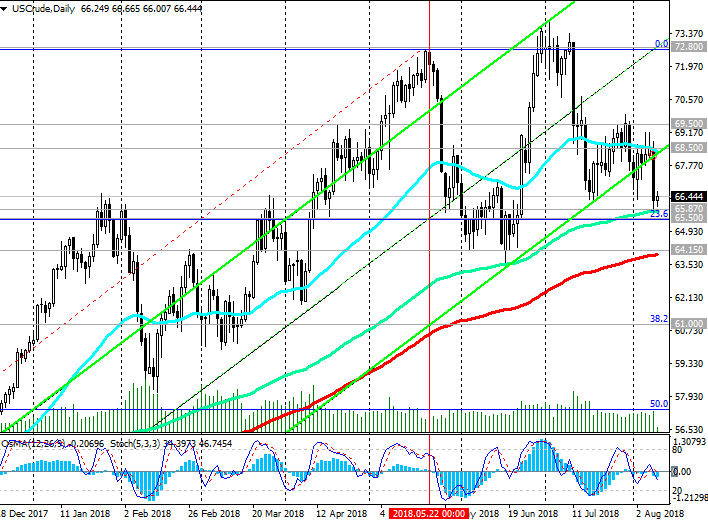
After in July, the prices for WTI oil reached the next annual maximum near the mark of 73.85 dollars per barrel, later prices fell sharply.
As a result of a sharp decline on Wednesday, the price reached the first important support level of 65.87 (EMA144 on the daily chart).
If downward dynamics develop, the targets will be support levels of 65.50 (Fibonacci level 23.6% of the correction to the wave of growth, which began in June 2017 with a support level near the 42.00 mark), 64.15 (EMA200 on the daily chart).
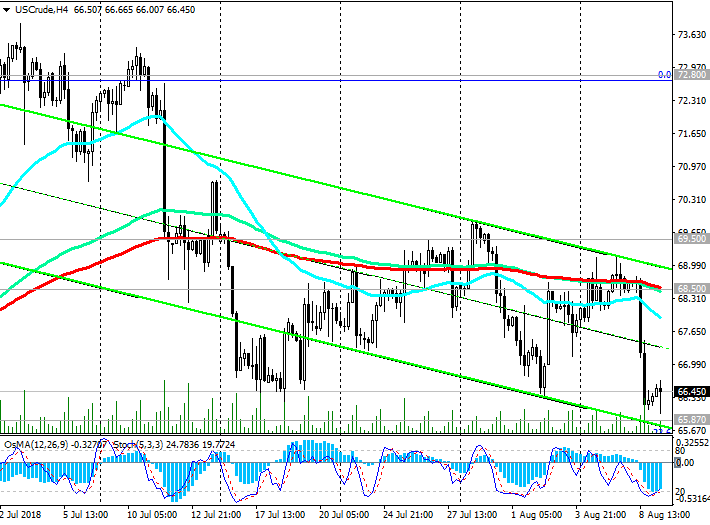
Indicators OsMA and Stochastics on the 4-hour, daily, weekly, monthly charts are on the side of sellers.
The bullish trend persists until WTI oil trades above the key support level 64.15 (EMA200 on the daily chart).
In case of return to the zone above the resistance level of 68.50 (EMA200 on a 4-hour grafik, as well as EMA50 and the lower boundary of an ascending channel on the daily chart), the price increase will resume.
Support levels: 65.87, 65.50, 64.15, 63.00, 61.00
Resistance levels: 68.50, 69.50, 70.00, 72.80, 75.00
*)An advanced fundamental analysis is available on the Tifia Forex Broker website at tifia.com/analytics
Trading Scenarios
Sell Stop 65.70. Stop-Loss 66.80. Take-Profit 65.50, 64.15, 63.00, 61.00
Buy Stop 66.80. Stop-Loss 65.70. Take-Profit 68.50, 69.50, 70.00, 72.80, 75.00
*) For up-to-date and detailed analytics and news on the forex market visit Tifia Forex Broker website tifia.com


 Trading Guide")

