

What is the indicator Color Trend FX? What is it for? Is it so simple? In fact, it is a very useful tool for trading. Today I will tell you how to use it correctly.
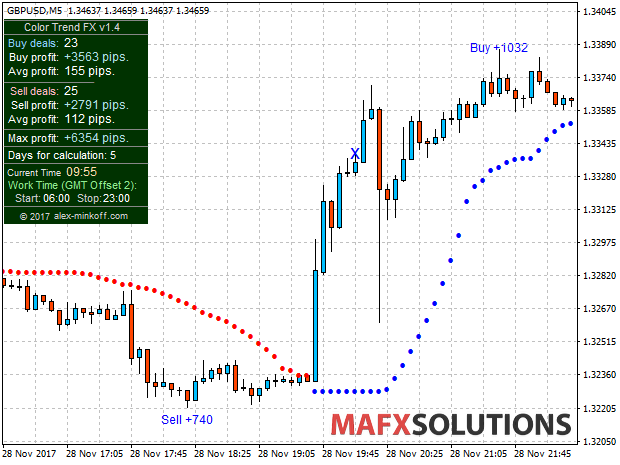
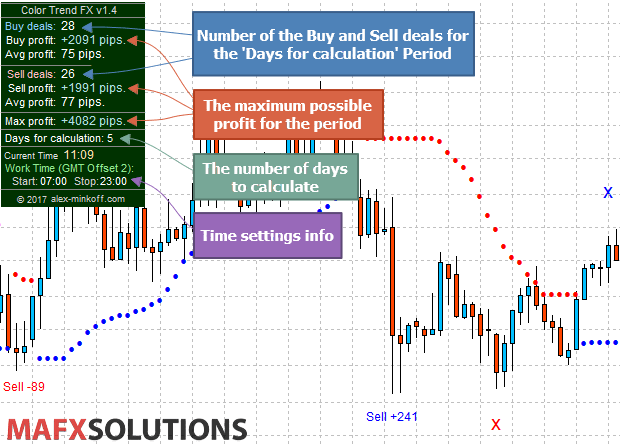
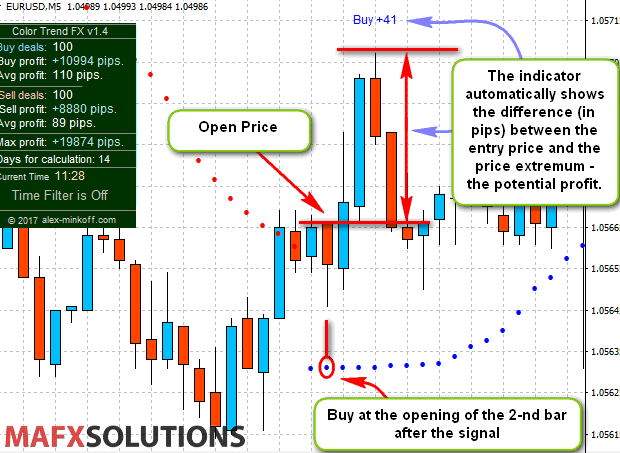
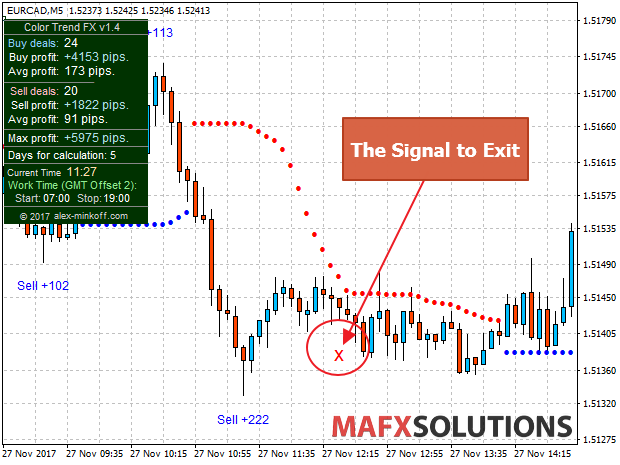
The Color Trend FX indicator shows on the chart the accurate market entry points, accurate exit points, maximum possible profit of a deal (for those who take profit according to their own system for exiting deals), points for trailing the open positions, as well as detailed statistics.
About Color Trend FX Indicator
Color Trend FX Indicator Settings
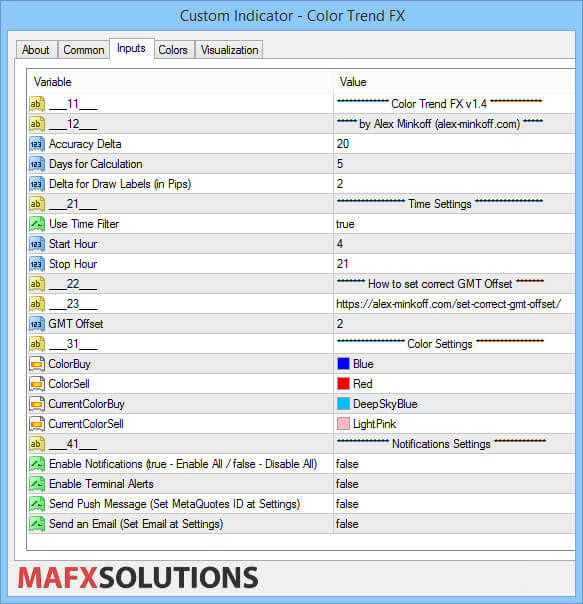
In fact, in the settings, there is nothing complicated. Now I will describe in detail.
Main Settings:
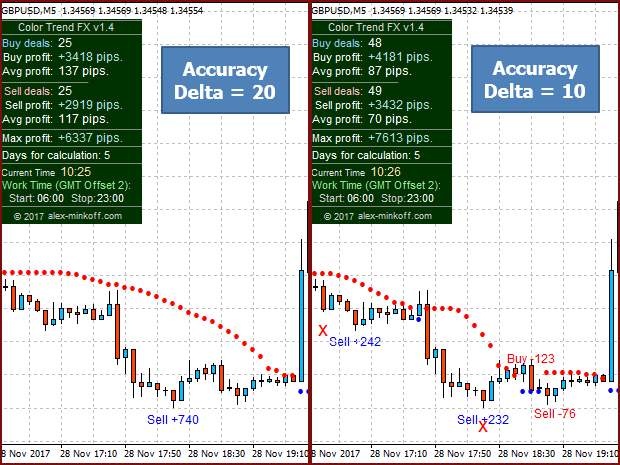
The most important setting is Accuracy Delta. So this is the accuracy of entry filter. The lower the value, the more “noise” in signals. If a value is too large, the signal may be lagging.
Days for Calculation – the number of the days for a calculation. This option allows you to examine statistics for a number of days. Next, I will talk in detail about it.
Delta for Draw Labels (in Pips) – offset in pips to display the signals on the chart.
Time Settings:
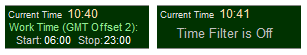
Use Time Filter – Time Filter activation.
Start Hour – hour to start trading.
Stop Hour – hour to stop trading.
GMT Offset – the offset to GMT time. How to set correst GMT Offset read here.
Color settings:
ColorBuy – color of buy signals.
ColorSell – color of sell signals.
CurrentColorBuy – color of buy signals on the current [0] bar.
CurrentColorSell – color of sell signals on the current [0] bar.
Notification (alert) settings:
Enable Notifications – activate all types of alerts.
Enable Terminal Alerts – activate alerts in separate message boxes.
Send Push Message – send push notifications to the mobile terminals (specify the MetaQuotes ID in the settings).
Send an Email – send emails to the address specified in the settings.
How to use Color Trend FX Indicator
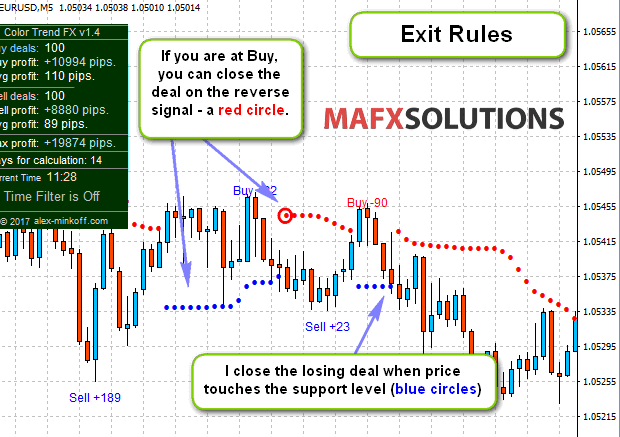
Here’s another option to close the deal:
So, why do we need to know the maximum possible profit? It’s a very simple. If you have an own strategy of profit-taking, or you develop your own strategy of the profit fixing, you can see how much you can get from the one deal. And to choose the level of the profit fixing as you need.
How to use Average Profit Info
First, we select the number of days for calculating the average price movement relative to the signals of the indicator.

If we chose 14 days, we will see the average price movement in about 2 weeks (excluding weekends). For a Buy, it’s about +231 pips. For a Sell: +90 pips.
Using this, we can assume the potential of the next deals.
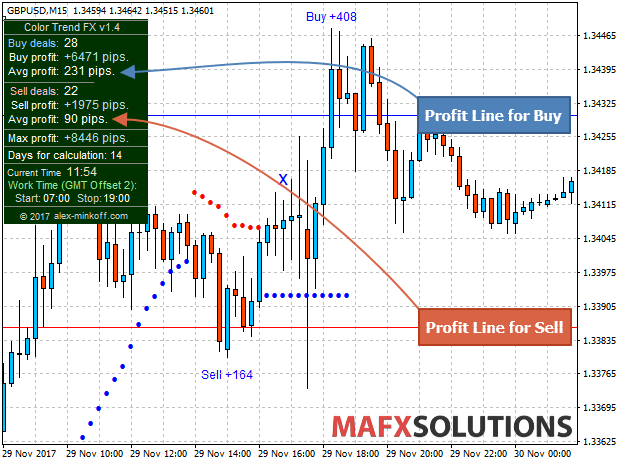
Also with this option, we can choose the more profitable currency pair (or another instrument) and timeframe. We can check the priority direction (Buy or Sell) on the selected instrument. And also to check the stability of trading by the chosen pair.
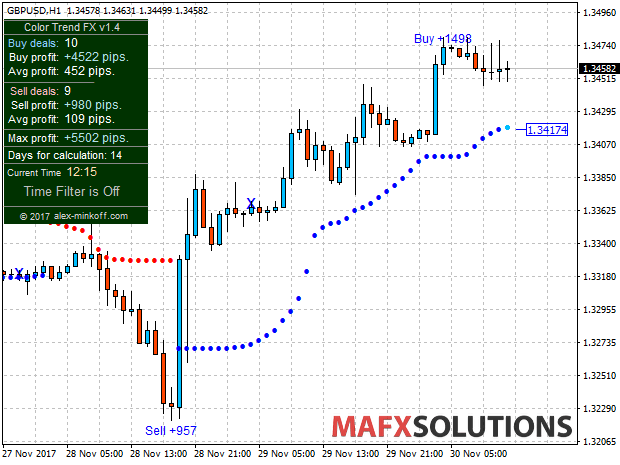
As we can see a buy trade on GBP/USD during the last 14 days gives 4 times more profit than on sale. 452 pips vs 109 pips.
Good Luck & Big Profits,
The MAFX Solutions


")

")