

This article concerns an indicator under development. Please leave your comments if you wish.
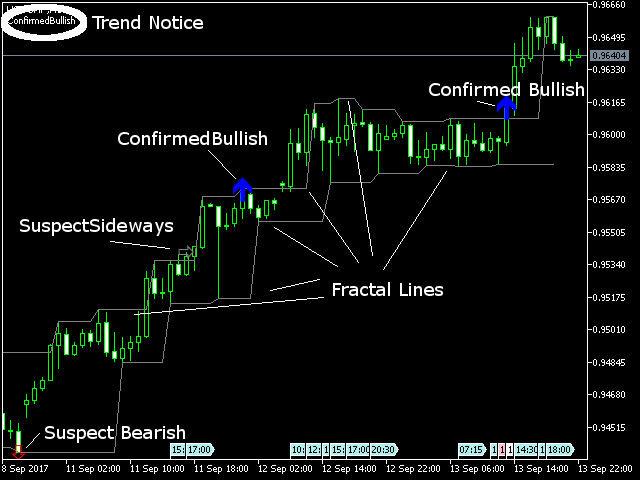
Finding the trend on a chart can be subjective. The trend determiner indicator examines the chart for you and reveals what the current trend is based on objective criteria. Using the trend determiner you can easily tell if you are trading with the trend or against it. It also identifies those times when the market is not trending. Theoretically, you could trade with the trend when the trend is strong and fade the trend when the market is range-bound. A comment is placed in the top left corner of the chart detailing the current trend.
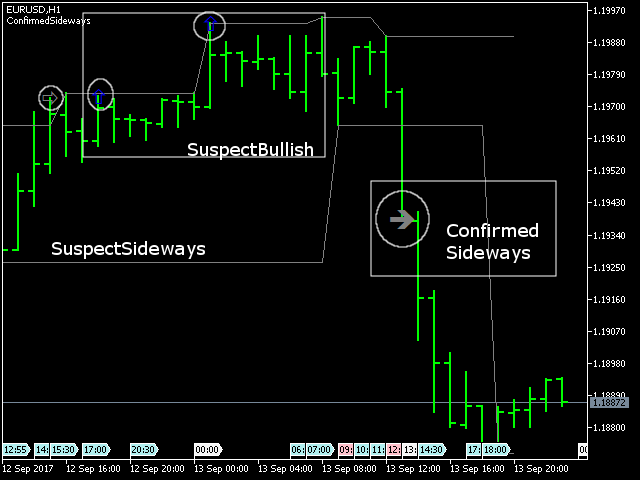
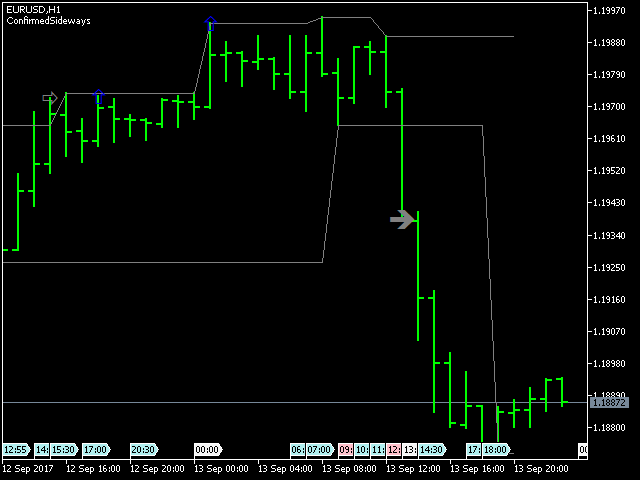
This indicator has three trend types bullish, bearish, and sideways. It also qualifies trends as being confirmed or suspect.
With a ConfirmedBullish trend, you can expect the price to go higher. When the trend is SuspectBullish price may go higher or lower this indicates the market is considered to be range-bound. Sideways trends are always range-bound and they can also be confirmed or suspect. With a ConfirmedBearish trend you can expect the price to go lower and if the trend is SuspectBearish price may go lower or higher but the market is range-bound. In general, the market is only trending 15 to 30 percent of the time.
This indicator also, allows you to set alerts. You can set an alert to activate when the trend type you wish activates, you could also be alerted to any trend change. The indicator also has a verbose mode, which prints out details in the journal tab, such at the price and volume of the fractal bar along with the bar being tested.
How does it work? Trend Determiner uses fractals as goal post to determine the trend. The fractal indicator is included in every version of meta trader. When a fractal appears the indicator remembers the value of that fractal. If price surpasses the value of a fractal it runs a test. If a bar tests a fractal point and closes on the other side of the fractal then the test is considered passed. The indicator then checks the volume of the bar that surpassed the fractal value, if the volume on the bar that passed the fractal value is greater than the value of the volume on the fractal the trend is considered confirmed. Logically, it is confirmed because the traders showed more interest at the point where it passed the fractal value than at the point where the fractal was created. To determine the trend the indicator looks at the value of the prior trend and adjusts it according to the results of the test see tables below.
For example, if the current trend is SuspectSideways and a bullish fractal prints at 1.0678 with a volume of 7333 and a few bars later a bar opens below at 1.0669 and closes at 1.0695 with a volume of 9501, this bar would initiate a trend test. Since the bar closed higher than the up fractal the trend would turn bullish and since its volume was greater than the volume of the fractal bar the trend would be confirmed. The result would be a trend transition from SuspectSideways to ConfirmedBullish.
Modifying the above example, if the volume on the bullish bar was less than the volume on the fractal bar say 6500, then the trend would still transition to bullish, however, it would be suspect since the volume on the bullish bar did not exceed the volume on the fractal that the test ran on. This shows that there is some possible affinity with lower prices since the volume was higher at a lower price so tread carefully when opening up a buy in this position.
Bullish bar surpasses an up fractal and closes higher with greater volume
| Prevailing Trend | Resulting Trend |
|---|---|
| Confirmed Bullish | ConfirmedBullish |
| SuspectBullish | ConfirmedBullish |
| ConfirmedSideways | ConfirmedBullish |
| SuspectSideways | ConfirmedBullish |
| ConfirmedBearish | ConfirmedSideways |
| SuspectBearish | ConfirmedSideways |
Bullish bar surpasses an up fractal and closes higher with less volume.
| Prevailing Trend | Resulting Trend |
|---|---|
| Confirmed Bullish | SuspectBullish |
| SuspectBullish | SuspectBullish |
| ConfirmedSideways | SuspectBullish |
| SuspectSideways | SuspectBullish |
| ConfirmedBearish | SuspectSideways |
| SuspectBearish | SuspectSideways |
Bearish bar begins above a down fractal and closes below with more volume.
| Prevailing Trend | Resulting Trend |
|---|---|
| Confirmed Bullish | ConfirmedSideways |
| SuspectBullish | ConfirmedSideways |
| ConfirmedSideways | ConfirmedBearish |
| SuspectSideways | ConfirmedBearish |
| ConfirmedBearish | ConfirmedBearish |
| SuspectBearish | ConfirmedBearish |
Bearish bar begins above a down fractal and closes below with less volume.
| Prevailing Trend | Resulting Trend |
|---|---|
| Confirmed Bullish | SuspectSideways |
| SuspectBullish | SuspectSideways |
| ConfirmedSideways | SuspectBearish |
| SuspectSideways | SuspectBearish |
| ConfirmedBearish | SuspectBearish |
| SuspectBearish | SuspectBearish |
Thanks for reading my blog post, let me know if you feel like this indicator should exist.


")