
S&P500: indexes rose against the backdrop of strong macro data

Strong macro data, received from the US at the beginning of today's US session, caused the growth of the main US stock indices. Nasdaq Composite climbed 18.00 points (0.30%), S & P500 rose 6.34 points (0.26%), DJIA started trading with an increase of 47.83 points (0.22%).
Personal incomes of Americans in July increased by 0.4% (the forecast was + 0.3%), personal expenses (indicator, estimating household costs) in July, adjusted for seasonal fluctuations, increased by 0.3% (forecast was +0, 4%). The increase in income raises the Americans' confidence in the government and economy.
Consumer spending accounts for the bulk of US GDP. Published on Thursday, the report showed that the annual growth in US GDP in the 2nd quarter of this year was 3%. Presented by the US Department of Commerce data indicate a positive momentum in the US economy in the second half of the year.
However, the price index for personal consumption expenditure (RFE), the Fed's preferred inflation indicator, rose 0.1% in July from the previous month after a lack of growth in June and a drop of 0.1% in May. Compared to the same period last year, the index grew by 1.4%, which is below the target level of the Fed, which is 2%.
Presented today by the US Department of Labor data indicate a steady increase in employment. Thus, the number of initial applications for unemployment benefits was 236,000 in the week of August 20-26. The number of primary applications has fluctuated historically in the past few years. They remain below 300,000 for 130 consecutive weeks, which is the longest period since 1970. As a percentage of labor, the indicator of layoffs is at the lowest level since the 1960s.
Secondary applications for unemployment benefits fell by 12,000 to 1.942 million. The consistently low level of applications for unemployment benefits is one of the signs of a strong labor market, which is approaching the state of maximum employment.
Against the backdrop of the data, US stock indexes rose. The growth of the indices continues, therefore, for the fourth trading session in a row, and for the seventh month in a row, which indicates the confidence of investors in the strength of the American economy.
At the same time, the weakness of inflationary pressures in the US economy makes it more difficult for the Federal Reserve to raise short-term interest rates before the end of the year.
Thus, the data presented today contribute to the further growth of the US stock market. It seems that the consequences of Hurricane Harvey, the geopolitical tensions associated with the terrorist attacks in Europe and the provocations with missile launches by North Korea are receding into the background. And, in general, the positive dynamics of the US stock market remains.
*)An advanced fundamental analysis is available on the Tifia Forex Broker website at tifia.com/analytics
Support and resistance levels
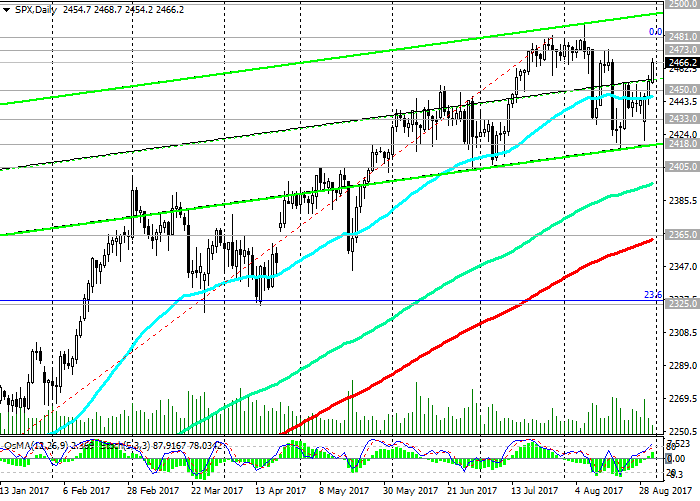
Twice this month, pushing away from the support level of 2418.0 (the bottom line of the rising channel on the daily chart), the S & P500 index keeps positive dynamics and is traded in the uplink on the weekly chart. There is a possibility of further growth.
The alternative scenario will be connected with the breakdown of the short-term support level 2450.0 (EMA200 on the 4-hour chart) and the continuation of the decline with the targets 2405.0 (June-July low and the lower limit of the uplink on the weekly chart), 2390.0 (March highs).
The upward trend in the S & P500 index is maintained as long as it trades above the key support levels of 2365.0 (EMA200 on the daily chart), 2325.0 (Fibonacci level of 23.6% correction to growth since February 2016). About the reversal of the bullish trend is not yet talking.
Support levels: 2450.0, 2433.0, 2418.0, 2405.0, 2390.0, 2365.0, 2325.0
Resistance levels: 2473.0, 2481.0, 2489.0, 2500.0

Trading Scenarios
Sell Stop 2454.0. Stop-Loss 2474.0. Objectives 2450.0, 2433.0, 2418.0, 2405.0, 2390.0, 2365.0, 2325.0
Buy Stop 2474.0. Stop-Loss 2454.0. Objectives 2481.0, 2489.0, 2500.0
*) For up-to-date and detailed analytics and news on the forex market visit Tifia Forex Broker website tifia.com


")

