

Interrupted by a series of non-stop 4-day growth, the price for Brent crude oil finished yesterday's trading day with a decrease of 1% or $ 0.6 per barrel. Published at the end of yesterday's trading day, data from the American Petroleum Institute (API) was the final chord of yesterday's decline in the price of oil. According to the API, oil reserves in the US increased by 882,000 barrels in the week of May 6-12. The presented data again revived fears of investors that the growth of oil production in the US is negating the efforts of the Organization of the Petroleum Exporting Countries (OPEC) to restore the balance in the market.
Oil prices in different directions are pulling information on the growth of oil reserves and production outside the cartel and the expectation that OPEC and countries outside the cartel are supporting the extension of the deal to cut production. On Monday, it was reported that Saudi Arabia and Russia expressed a propensity to extend the agreement to reduce production for another 9 months. The OPEC meeting on this issue will be held next week (May 25).
The skepticism about the efficiency of the OPEC deal returned to the oil market after the International Energy Agency (IEA) published data on Tuesday that according to which in the 1st quarter commercial oil reserves in developed countries increased by 24.1 million barrels. IEA data also indicate the growth of stocks in oil storage facilities and in April.
According to analysts of the oil market, OPEC will be able to achieve the goal, and world oil reserves in the storage facilities will drop to an average of 5-year level provided that in the next year the supply of oil is reduced by 1 million barrels per day. Some of the economists are of the opinion that the OPEC reduction deal should be extended for 2018 as well.
The increase in the number of drilling rigs and the increase in production in the United States go faster and larger than expected, offsetting the efforts of OPEC. This could lead to the fact that production in the US will continue to grow, and support from OPEC in 2018 will end. In this case, the risks of a sharp drop in oil prices rise significantly against the backdrop of a growing surplus of oil supply.
Today at 14:30 (GMT) will be a report from the US Department of Energy on the change in oil and petroleum products in the US over the past week. It is expected that oil and petroleum products in the US fell by another 2.283 million barrels (after a recent weekly reduction of 5.247 million barrels). When confirming the forecast, the price of oil should rise.
Closer to the end of the US trading session (18:00 GMT) on Friday a report will be published from the American oil service company Baker Hughes on the number of active drilling rigs in the US. It is expected that the number of active oil drilling rigs in the United States has again increased (in the previous week their number was 712 units). The next growth will negatively affect oil prices.

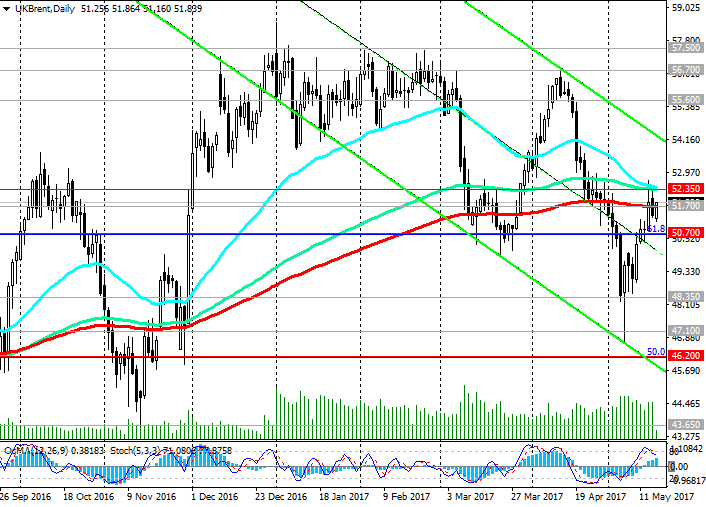
Support and resistance levels
After a sharp decline at the beginning of the month to 47.00, the price of Brent crude oil was able to significantly adjust to today's expectations on the expectation that OPEC will be able to agree on an extension of the agreement to reduce oil production.
Today, Brent crude trades near the key resistance level at 51.70 (EMA200 on the daily chart). This level is also a kind of middle line of the range formed between the levels 52.35 (EMA144, EMA50 on the daily chart) and 50.70 (the Fibonacci retracement level of 61.8% correction to the decline from the level of 65.30 from June 2015 to the absolute minimums of 2016 near the 27.00 mark).
The price for Brent crude oil remains within the descending channel on the daily chart, the lower limit of which is near the support level of 46.20 (50% Fibonacci level).
If the support level breaks through 50.70, the price will go down to levels 48.35, 47.10, 46.20. In the case of consolidation below 46.20 (50% Fibonacci level), the upward trend in the price of Brent crude oil will be canceled.
An alternative scenario for growth is associated with a return of the price above the level of 52.35. Long-term goals in the case of this scenario are near 55.60 (EMA200 on the weekly chart), 56.70 (April highs), 57.50, 58.40 (highs of the year).
Support levels: 50.70, 48.35, 47.00, 46.20
Resistance levels: 51.70, 52.35
Trading Scenarios
Sell Stop 51.25. Stop-Loss 51.85. Take-Profit 50.70, 50.00, 48.35, 48.00, 47.10, 46.20
Buy Stop 51.85. Stop-Loss 51.25. Take-Profit 52.35, 54.00, 55.00, 55.60, 56.70, 57.00, 57.50
*) Actual and detailed analytics can be found on the Tifia website at tifia.com/analytics


