

Top Trading Opportunities for 2017 - Part I
Indecision ruled much of 2016 – as it had the year before. Global equities and the Dollar carved out broad ranges rather than extend the trends of previous years. That complacency was shaken however in the final quarter of the year. A buildup of major event risk from Brexit to the US Presidential election to the second Fed rate hike put markets back in motion. Will revived trends hold true into the New Year or is volatility the only holdover to depend on? These are the DailyFX Team’s top trade opportunities for 2017.
Top Trades:
- John Kicklighter, Chief Strategist: GBP/JPY Combines a Depressed Pound and Risk Trends
- David Song, Currency Analyst: Tracking Key Market Themes Beyond Monetary Policy
- Jeremy Wagner, Head Trading Instructor: A Typically Quiet EUR/GBP May Provide an Outsized Move
- Paul Robinson, Currency Analyst: NZDUSD, Gold/Silver Setting Up for More Losses Before Hitting a Low
- Jamie Saettele, CMT, Senior Technical Strategist: Cyclical USDZAR Downswing May Be at Hand
- Tyler Yell, CMT, Forex Trading Instructor: Awaiting Aggressive Bullish Bounce In Gold From Higher-Low
- Walker England, Forex Trading Instructor: Finding Potential Trading Opportunities in EUR/GBP
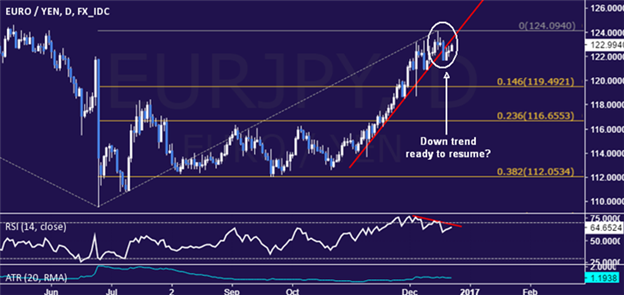
- Martin Essex, Market Analyst and Editor: EUR/JPY Faces Rising European Troubles, Brighter Japanese Horizons
- Michael Boutros, Currency Strategist: AUDJPY | Breakout at Initial Resistance- Constructive Above 80.60
- David Cottle, Market Analyst: What if the Fed has Under-Gunned its Rate Hike Call?
- James Stanley, Currency Analyst: Long EUR/AUD – Buy Support, Sell Resistance
- Oliver Morrison, Market Analyst: British Pound Set for Further Gains on Japan’s Yen
- Nick Cawley, Market Analyst: GBP Recovery Against EUR Likely on the Cards in 2017
GBP/JPY Combines a Depressed Pound and Risk Trends
There are a number of glaring fundamental themes that will need to be addressed in 2017 from the market’s continuous discount of the Fed’s forecast to the rise of trade boundaries in a shift towards protectionism. However, many of these overbearing threats have neither a significant skew between potential and probability nor are they attached to a clear fundamental trigger that can offer a reasonable sense of timing for resolution. Given that trading is largely the smart management of probabilities, it is important to find opportunities that can contain the widest array of favorable outcomes and the greatest amplitude with a positive course. A long GBP/JPY view appeals to me because it speaks to two critical, heavily-skewed themes: Sterling depressed by Brexit uncertainty and an evolution of risk trends.
The Sterling component of this setup is relatively straightforward. The UK’s currency has suffered an unceremonious devaluation with the country’s vote to withdrawal from the European Union. This sustained depression reflects uncertainty and worst-case-scenario assumptions in the absence of clear procedures to navigate the divorce. It is likely that negotiations between the two sides will be tense and the United Kingdom’s economy will be worse off on a number of aspects, but it is very unlikely to be the crisis state that is currently priced in. We will start to reassess the balance of fear that suppresses the country and currency in the first quarter of 2017. Prime Minister Theresa May is due to lay out plans for negotiation in the opening months, and - should she stick to the planned time line for invoking Article 50 - to start the procedure at the end of March.
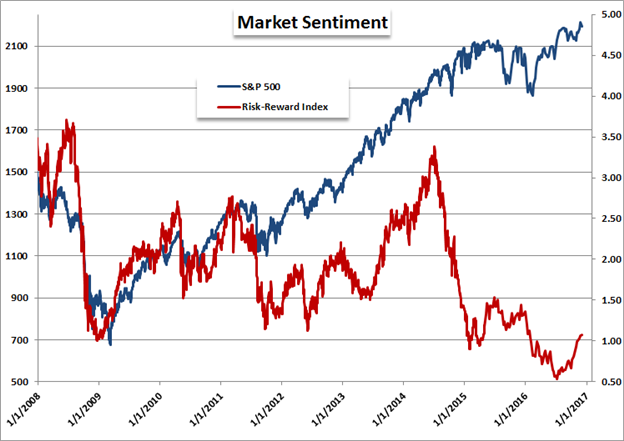
The speculative bias behind the Pound offers up a number of appealing opportunities (including EUR/GBP which sees the Euro showing little tangible appreciation of its own loss in this divorce), but GBP/JPY leverages that fundamental opportunity by adding a second fundamental theme with a particular skew: risk trends. As it stands, timing is very important to trading GBP/JPY. While the Sterling’s contribution to this situation is already grounded by speculative excess, the Yen poses a near-term risk to a bullish view. All Yen crosses are highly correlated to market-wide risk appetite. With its current bearings, speculative reach is excessive across many assets and on most fundamental measures. Below is a chart showing a risk favorite S&P 500 US equity index versus a basic ‘Risk-Reward Index’ (an aggregate G-10, 10-year government bond yield divided by an FX volatility index).
Welcome to my products:
A risk correction is overdue, and the GBP/JPY is unlikely to escape the downdraft. That said, the flush is not going to find an excess of speculative loiterers holding a long position given the exchange rate’s extraordinary low level and the absolute lack of carry the pair offers. After the painful but necessary risk scourge however, the market will be less fixated on jumping on a bandwagon of hollow momentum and instead prize genuine potential for return on depressed assets. A deeply discounted Pound with a recovering UK GDP and Bank of England not too far off from normalizing policy will lay an appealing landscape for such appetite.
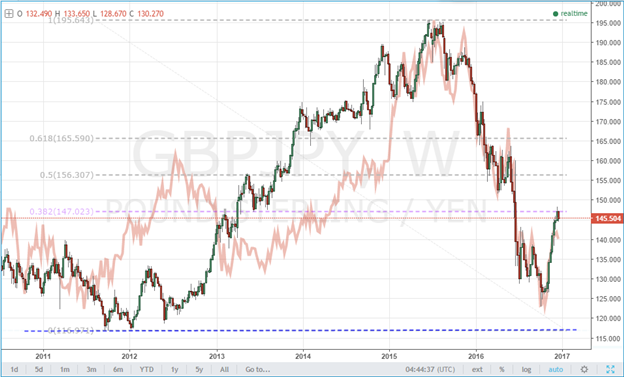
In the chart below, the candlestick series is GBP/JPY and the pale red line is GBP/EUR (EUR/GBP inverted). The technical appeal relative to other Yen and Sterling crosses is worth taking a look at, but it is the fundamental scenarios behind GBP/JPY that truly speak to its bullish potential over the medium to long-term. That is why it is at the top of my list for trade opportunities in 2017.
Cyclical USDZAR Downswing May Be at Hand
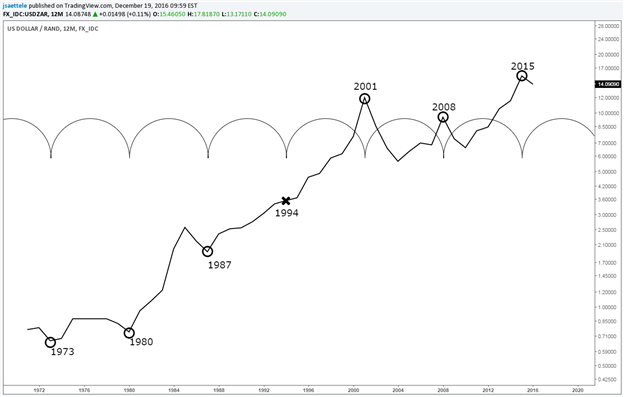
Yearly Chart
Since the end of the Bretton Woods era, USDZAR has more or less gone straight up. The only notable peaks on this chart are 2001 and 2008, which are 7 years apart. Work backwards in 7 year cycles and you’ll notice that 1987, 1980, and 1973 are pivot lows (1994 was nothing). 7 years after 2008 is 2015 (remember, we’re looking at yearly closes). The decline from 2001 lasted 3 years and the decline from 2008 lasted 2 years. It’s possible that 2016 is the first year of another decline.
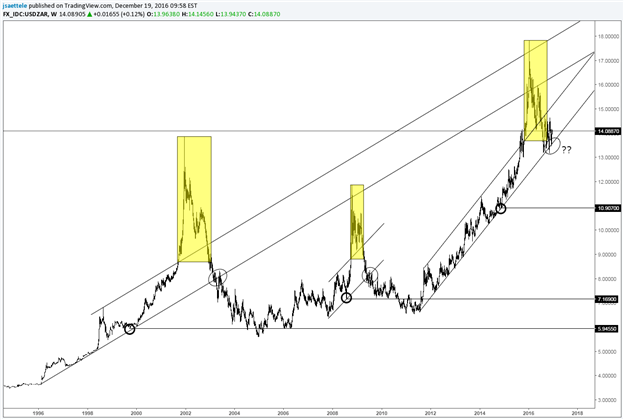
‘Blow-off’ Tops
The tops in 2001, 2008, and 2015 are ‘blow-off’ tops. The ‘blow-off’ portions of the rallies occur following breaks through the top of a channel. Once the market comes back into the channel, a reversal is considered underway towards the point from which the blow-off advance originated. This point is defined as the level where price last touched the support line. The circles on the chart denote the origin points. The target in this case is 10.9070.
Similarities to Previous Tops; Especially 2001
USDZAR fell in 3 waves from December 2001 to June 2002 and then rallied in 3 waves from June 2002 to August 2002. Weakness then accelerated through 2004.
USDZAR fell in 3 waves from October 2008 to January 2009 and then rallied in 3 waves from January 2009 to March 2009. Weakness then accelerated through 2010.
USDZAR fell in 3 waves from January 2016 to August 2016 and has traded sideways for 4 months. It’s critical that shorts are not established until the long term trendline is broken. A break below the trendline and subsequent ‘check’ on the trendline from below as resistance would be even better for entry.
Avoiding the Trump Trade Rollercoaster - Short EUR vs. GBP, JPY
Reality humbled smug prognosticators convinced that UK voters will vote to stay in the European Union, that Hillary Clinton will win the US presidential election, and that OPEC will fail to strike an output cut deal yet again. The road ahead looks no less treacherous and attempting to divine where it may lead seems no less foolish.
Much will depend on how the Fed will react to the as-yet unknown impact of policies put forward by the Trump administration. Will “big-league” fiscal stimulus really goose up growth, spur inflation and steepen the on-coming rate hike path?
The markets seem to think so, but no really one knows for sure. It is impossible to say with confidence that a boost from infrastructure spending, tax cuts and deregulation will not be offset if the President-elect gives in to his protectionist streak. Pretending this is not a possibility looks like wishful thinking.
The US economy is the single largest engine of global demand and the US Dollar is the world’s undisputed reserve currency, serving as the medium of exchange for close to 80 percent of all transactions. That means that answering this question will set direction for nearly every benchmark asset across the financial markets.
Crafting a robust strategy for the year against this backdrop will mean avoiding trades that force investors to take bets on world-changing outcomes, at least for now. Instead, it seems prudent to look for opportunities that sidestep them altogether. Selling the Euro against the British Pound and the Yen seems to fit the bill.
The Japanese unit and the single currency look similar heading into 2017. It may turn out that losses against a Trump-ed up US Dollar and an OPEC-driven crude oil rally will finally speed up price growth enough to consider scaling back ECB and BOJ stimulus. Then again, it may not.
In either case, both central banks’ actions would be driven by the same narrative and may turn out be a wash on-net. The Euro will have to contend with tremendous political uncertainty however as Germany and France head to the polls. Anti-establishment forces have gained ground in both countries.
The past year ought to have taught investors not to discount the threat of populist insurrection in heretofore bastions of the Western status quo. This means worries about election outcomes in the heart of the Eurozone may weigh on the Euro independently of how the big-picture global narrative develops.
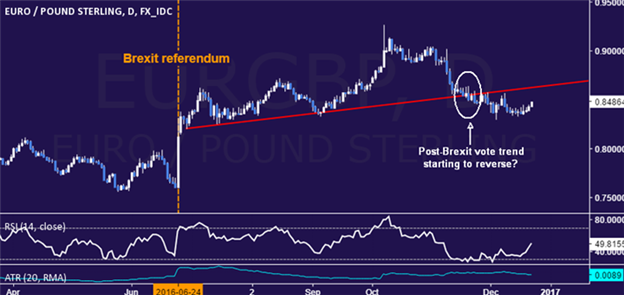
Another concern is the start of Brexit negotiations. The Euro soared against the Pound after the Leave campaign emerged triumphant but uncertainty about implementation will almost surely cool growth on both sides of the English Channel, meaning that Sterling looks somewhat cheap relative to its Continental counterpart.
Jeremy Wagner, Head Trading Instructor: A Typically Quiet EUR/GBP May Provide an Outsized Move
Focusing on the technical pictures, some cross pairs may surprise in 2017. We wrote about Sterling last year (“More Than Irish Look for the Pot of Gold”) and it followed through as anticipated. This year, EUR/GBP is one that as the year progresses it may set up for another strong leg higher.
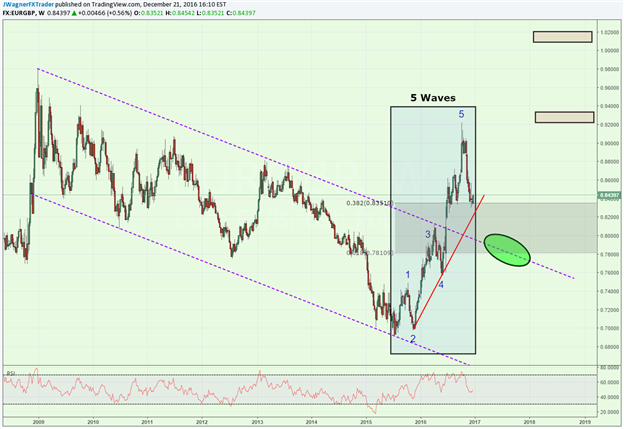
The move from July 2015 to October 2016 appears to be a 5-wave move to start a new trend. We know from Elliott Wave Theory that 5-wave moves to start a new trend typically have a partner in an alternating wave of similar size. Therefore, as price corrects this 2015-2016 trend higher, we will look to identifying levels that may support the correction prior to another leg higher.
Keep the Fibonacci retracement levels handy on the chart from July 2015 to October 2016. The 61.8% retracement level comes in near 0.7810. Coincidentally, the former resistance line (purple dotted line) crosses near this same level. We know from support and resistance training that former resistance, when broken, can act like new support in the future. Therefore, if price corrects lower, we may see a positive reaction near 0.75 – 0.78.
At that point, we will anticipate another move higher of similar size as the July 2015 to October 2016 trend. That move was nearly 2300 pips so we will look for a bounce higher of approximately 1400 (61.8% of 2300) or possibly 2300 pips. That suggests upside targets near 0.92 and possibly 1.01.
Wait for price to finish the correction lower. If trade prints below the July 2015 low of 0.69, then another pattern is in the works.
Keeping with the Sterling theme, we will also be monitoring GBP/JPY and specifically if a correction develops. The structure of a correction lower in GBP/JPY develops will help set the tone if we can anticipate a partial correction or move to new lows. If the move develops as a 3 wave corrective move, then GBP/JPY would be in a similar boat as EUR/GBP in that another strong leg higher may carry it towards 160’s and possibly 175 later in the year.
Join Jeremy for the US Opening Bell webinars to keep up to date on these trends plus other Elliott Wave patterns he is following.
Michael Boutros, Currency Strategist: AUDJPY | Breakout at Initial Resistance- Constructive Above 80.60
AUDJPY Weekly
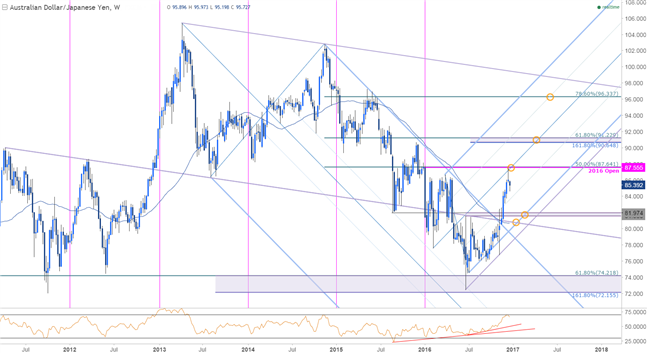
Last year we highlighted a broad descending median-line formation off the 2013 & 2014 highs while noting that, “The broader focus remains weighted to the downside while below this threshold (the upper parallel) with a break below the September low-week reversal close at 85.47, targeting subsequent objectives at the 81.84-82.80 range & the 50% retracement of the advance off the 2008 low at 80.16. A critical longer-term support zone rest lower at 72.05-74.20.”
Indeed this critical support barrier marked the low this year with the subsequent rebound in price marking the largest quarterly advance since 4Q of 2012. The pair has stretched back into key near-term resistance at 87.55/64 ahead of the yearly close- this level is defined by the 2016 open, the 50% retracement of the 2014 decline and the median-line of the ascending pitchfork extending off the February low.
While the immediate long-bias is vulnerable, a broader bottoming process off previous yearly range lows may be underway here and heading into 2017 the outlook remains weighted to the topside while within this ascending formation with interim support eyed at 81.58/97. Key confluence support & bullish invalidation rests just lower at the convergence of the 52-week moving average & the 2011 parallel around ~80.60 (also the origin of the Q4 breakout). Bottom line: we’ll be looking to fade weakness towards these levels early in the year with a breach above key resistance targeting subsequent topside objectives at 90.64-91.23 & 96.34.
Tyler Yell, Forex Trading Instructor: Awaiting Aggressive Bullish Bounce In Gold From Higher-Low
“Markets bottom when the last seller has sold and markets top when the last buyer has bought.”
-Tom DeMark, DeMark Analytics
One of the seemingly great ironies of the outcome of the U.S. Election was how wrong many market participants were to anticipate price outcome of a possible Trump victory. After President-elect Trump declared victory in the early hours of November 9, 2016, the market unexpectedly rallied in a full risk-on mode that lasted well into December.
Many traders thought Trump would cause markets to go risk-off and that Gold and JPY would be the big beneficiary of a Trump victory with both appreciating aggressively. However, since the November 9 intra-day high on XAU/USD just north of $1,340/oz, the price of Gold has fallen ~17% or nearly $230s/oz by mid-December. Similarly, the Japanese Yen has weakened by 1,335 pips as of the time of this writing against, which is worth a loss of nearly 14.6% in a month’s time.
While the market moved aggressively against haven assets and currencies like Gold and JPY, a trader should be on the watch for the scene setting up for a Bullish Gold move in early 2017. The main components that lead me to be on heightened watch for a Bullish Gold reversal are the steep slope of the price decline and the sentiment extremes developing. The price of Gold has fallen into the 0.618%-0.786% retracement zone of the December ‘15-July rally that saw the price of Gold rising by ~ 32.2% or $330/oz from $1,046/oz to as high as $1,376/oz.
There appears to be no more hated asset class going into 2017 than Gold as per the Daily Sentiment Index. DSI shows in mid-December there are 10% bulls in Gold (90% Bears leading long-term bonds or T-bonds and T-notes in second and third place with 11% and 12% respectively.
If you look at the start of 2016, there were aggressive calls for the price of crude oil to drop $10 a barrel and the US dollar to push ever higher while equity markets were hated asset class. Fast forward to the end of 2016 and the dollar did turnaround after falling 8% from the January high to early May low. The dollar rallied over 11% from the May low of 91.92. Oil rallied over 111% from February to December and might be pulling away on a bullish head and shoulders pattern that could turn towards $60 a barrel. The S&P 500 rose by over 26% from its February low after falling 13.3% in the first month of trading 2016.
This recent bout of market history is worth remembering as Gold could take the prize for strong reversal alongside with Bonds as trading gets underway in 2017.
While there is euphoria going on with the weak JPY & EUR, the strong USD has some feeling that all is right in global markets. However, we should remain on the watch in early 2017 that Gold could benefit from a mispriced euphoria. Considering Gold appears to be the most hated asset in the future’s market adds to the appeal that a breakout in 2017 to the upside in Gold may have a lot of room to run higher. Gold’s younger digital brother Bit-Coin (BTC/USD), which is another haven asset has a bullish range for 2016 of 440 USD with a bullish range from low to high of 125%.
Other correlated assets to Gold are also in a strong bear market that would need to reverse before entering a long Gold trade in 2017.
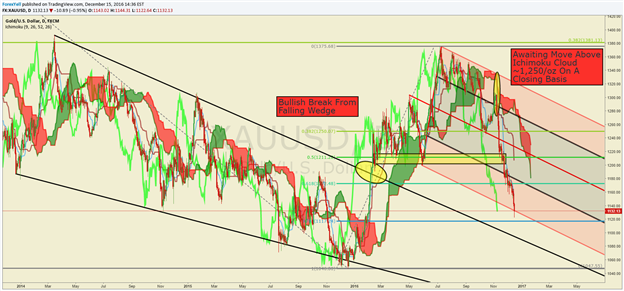
Awaiting Bullish Cues:
Naturally, a downtrend does not automatically equal a buying opportunity. Before entertaining a long view, I would like to see momentum and a repricing of markets upon the information that can lead to a good trade. In the current environment with equities at all-time highs, Yen staying weak, and bond yields rallying, we will await the right time for gold to turn Gold course.
By the time I bullish Gold, the price will need to be above the daily Ichimoku Cloud along with the lagging line also above the cloud (lagging line = price from 26-periods ago). Also, given the stirrings going on in the market with very extreme bearish sentiment and Haven assets being sold off, euphoria in risky assets alongside uncertainty in future global trade and growth potential for equity earnings, Gold may be setting up for an early 2017 rally in a similar way it rallied in H1 2016. If so, that’s a move I want to take advantage of.
Short EUR/USD, Long USD/JPY
Leave your preconceived notions in 2016: 2017 will be unlike any year in recent memory. After a 'wave' election in which one party swept control of both halves of Congress as well as the Presidency, Republicans are in the rare position of being able to end legislative gridlock in Washington, which should translate into fiscal stimulus for the US economy.
Regardless of ideology, whichever singular party has tended to be in control after a wave election has pursued fiscal easing strategies: the US budget deficit grew by an average of 0.4% of GDP during those 18 years. It seems that a Trump administration would uphold its bargain of running up the structural deficit as typically is the case during singular party control of the government. Deficit spending in the form of a massive infrastructure spending bill, combined with sweeping tax reform, should prove to be significantly inflationary.
Higher inflation expectations should translate into further gains for US Treasury yields (and was doing so in Q4’16 via steeper Fed rate hike expectations), which will be tremendously helpful for the US Dollar in context of the current environment that the Euro and the Japanese Yen find the European Central Bank and Bank of Japan operating in: implementing aggressive easing policies to keep rates at the short-end of the yield curve as low as possible, at any cost.
The ECB’s decision in early-December to alter how its QE program is undertaken can erode the market’s desire to hold Euros over the medium-term. With the decision to buy 1-year debt, the ECB has signaled that it is basically altering policy to be able to keep the front-end of European yield curves pinned to the floor. Between the ECB's policy shift and the Fed's signaling for a faster pace of rate hikes, the German-US 2-year yield spread has widened out significantly in the past few weeks, proving to be the driving force behind EUR/USD weakness. Another 50-bps of widening in the German-US 2-year yield spread (mirroring the move in November and December 2016) could see EUR/USD down towards 0.9500 in the first half of 2017; we’ll look for a test of parity in Q1’17.
The same can be said about what's happening with the Japanese Yen. In a rising yield environment where the BOJ is pegging the JGB 10-year yield at or below 0%, the Japanese Yen stands out to be a loser. Interest rate differentials (US-Japanese 10-year yield spreads) have moved sharply against the Yen, and appear poised to do so for the foreseeable future (three- to six-months). Another 100-bps widening in the US-Japanese 10-year yield spread (mirroring the move in November and December 2016) could see USD/JPY reach its 2015 highs near 125.70 in Q1’17 before 130.00 later in the year.
The President-elect Trump reflation trade could very-well last into Q1 or Q2'17, albeit in fits and starts, before trouble emerges. We’ll want to revisit the calls for short EUR/USD and long USD/JPY by mid-year. At some point, we'll pass through the threshold where rising US yields are seen a burden for debt sustainability concerns, but that probably won’t happen until late-2017 or early-2018.
Tracking Key Market Themes Beyond Monetary Policy
Long: AUD/JPY, Nikkei 225
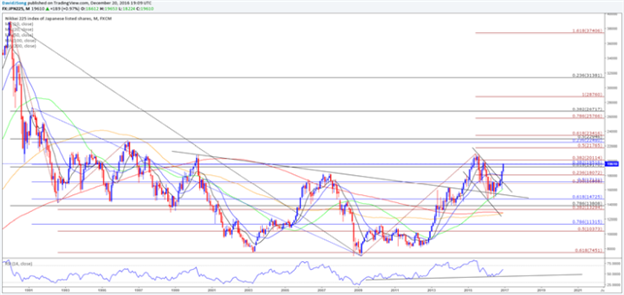
The pickup in risk sentiment has triggered a meaningful development across the major global benchmark indices, with the Nikkei 225 breaking out the bull-flag formation carried over from 2015, while currency pairs such as AUD/JPY are highlighting a similar dynamic all ahead of 2017.
Nikkei 225 Monthly


![[Two Different Approaches to Market Timing]: The Spiral Calendar and the VISTmany Research Project](https://c.mql5.com/6/1012/splash-preview-771691.png "[Two Different Approaches to Market Timing]: The Spiral Calendar and the VISTmany Research Project")

