
S&P 500 Long-Term Technicals: weekly breakdown or the ranging bullish
6 November 2016, 09:14

7
340
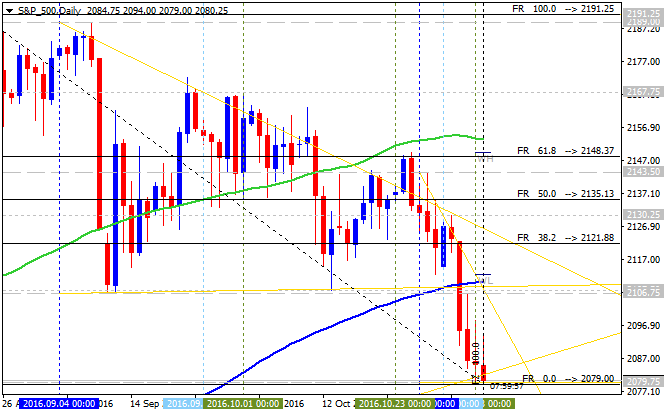
Weekly price is located above Ichimoku cloud in the bullish area of the chart. The price is on secondary correction to be started on open weekly bar for now with the 2,056 support level to be broken for the secondary correction to be continuing. Alternative, if the price breaks 2,191 resistance level to above so the primary bullish trend will be resumed.

- If the price breaks 2,191 resistance level on close weekly bar to above so the primary bullish trend will be resumed.
- If weekly price breaks 2,056 support level on close bar to below so the local downtrend as a secondary correction within the primary bullish market condition will be started.
- If weekly price breaks 1,981 support level on close bar to below so the revel of the price movement to the primary bearish market condition will be started.
- If not so the price will be on bullish ranging within the levels.
| Resistance | Support |
|---|---|
| 2,191 | 2,056 |
| N/A | 1,981 |
Trend:


")