
Welcome to my "Strength and Comparison" article for the
coming month. The article "Ranking, Rating and Score" has also
been
published. In the Currency Strength table the USD is the strongest currency, the GBP is the weakest and the JPY is currently in a dip while all the other currencies did not change except for the CHF which is 1 point higher. For more details read both of my
articles where the relevant Charts and Tables are provided.
This was updated on 30 September 2016 and is provided here for reference purposes:
Strong: USD, JPY, NZD. The preferred range is from 6 to 8.
Neutral: AUD, CHF. The preferred range is from 4 to 5.
Weak: EUR, GBP, CAD. The preferred range is from 1 to 3.
All the currencies are within their classification when using the Avg. 12 M. Although the JPY is in a dip this month this does not have any effect on the Avg. 12 months Currency Score. The JPY remains the strongest currency.
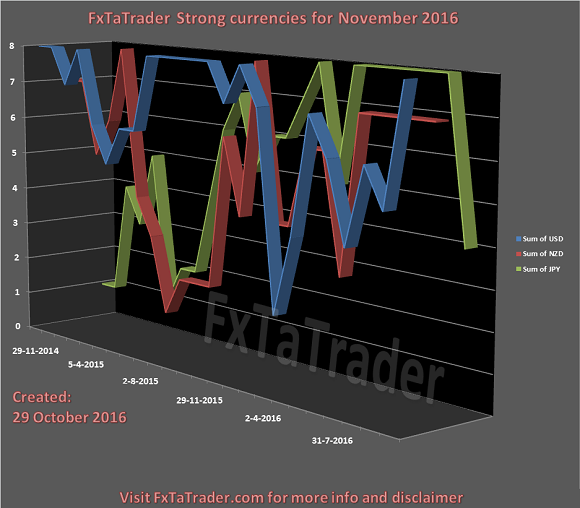
In the last Month the JPY
is in a dip with a score of 4 being the weakest one of the strong
currencies. However, it is clear to see that this currency was in the
last period very strong, the strongest of all for 6 months. For that
reason it does not seem that this currency will continue to weaken.
There will be at least a period of consolidation before the currency
will get close to a Neutral classification. It has at the moment the
highest Avg. 12 M. Currency Score of all currencies!
The NZD is very stable lately while the USD is gaining strength and coming back to the area of the Strong currencies.
Here below you can see the Monthly Currency Score Chart with 24 months data as a reference.
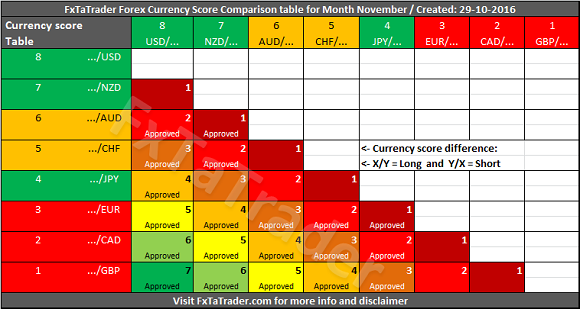
The Forex Currency Comparison Table compares each currency with its
counterpart based on the Currency Score. For more information about the
currency Score of this month you can read the article "Forex Ranking,
Rating and Score" which is published every month together with this
article.
By using the comparison table directly below you can get a view without the volatility and statistics as opposed to the "Ranking and Rating list". Only the strength of each currency against the counterparts is analyzed by using the Technical analysis charts of the 3 Time Frames that are also used for the "Ranking and Rating List".
The information from the Comparison Table is the source for calculating the "Ranking and Rating List" where this list additionally uses the volatility and statistics for creating the best and worst performer in the list from number 1 to 28.
The
additional value of this table compared to the Currency Score table
is that the Comparison Table compares the strength between the
currencies of each pair. By subtracting the strength of the weaker
currency from the stronger currency we have a way to compare each pair
combination.
The comparison table provides a way to compare currencies from a longer term perspective of 12 months and also simultaneously taking the current trend into account. By coloring the currencies in the X and Y axis according to their Classification we can show what the best combinations are. In doing this we apply 2 rules to make it clearer.
Based on the last "12 Months currency classification" and the "Currency Comparison Table" the most interesting currencies for going long seem to be the:
USD, NZD and AUD.
These are Strong or Neutral currencies from a longer term perspective when looking at the last "12 Months currency classification".
For going short the same analysis can be done and the following currencies seem to fit best:
GBP, CAD and EUR.
These are Weak or Neutral currencies from a longer term perspective.
Currencies with a high deviation seem less interesting to trade because they are less predictable. A good example at the moment is e.g. the:
JPY.
Some of the pairs in the "Currency Comparison Table" comply for a longer term trade based on the Technical Analysis (TA) of the Daily and Monthly chart. For the coming month these seem to be: GBP/NZD, GBP/USD, GBP/CHF, NZD/CAD, EUR/GBP, AUD/CAD, GBP/AUD, GBP/JPY, EUR/USD and USD/CHF.
For the GBP pairs the GBP/NZD seems the most interesting not being yet in the overbought/oversold followed by the GBP/CHF which is a little bit in that area but may stay within when the new month starts. The GBP/USD and EUR/GBP are in extreme overbough/oversold area according to the monthly chart using the Bollinger Band(20). Strong overbough/oversold areas in the Monthly chart may still offer a good opportunity but the pull back may be strong!
Besides this article I also use the Forex "Ranking, Rating and Score" which is also available once a month on my blog. In the article "Ranking, Rating and Score" we look in more detail at the absolute position of the currencies and pairs.
It is recommended to read the page Currency score explained and Models in practice for a better understanding of the article. If you would like to use this article then mention the source by providing the URL FxTaTrader.com or the direct link to this article. Good luck in the coming month.
DISCLAIMER:
The articles are my personal opinion, not recommendations, FX trading
is risky and not suitable for everyone.The content is for educational
purposes only and is aimed solely for the use by ‘experienced’ traders
in the FOREX market as the contents are intended to be understood by
professional users who are fully aware of the inherent risks in forex
trading. The content is for 'Forex Trading Journal' purpose only.
Nothing should be construed as recommendation to purchase any financial
instruments. The choice and risk is always yours. Thank you.
______________________________________
12 Months Currency Score Strength
The 12 Months Currency Strength and the 12 Months Average are
provided here below. This data and the "12 months Currency
Classification" are considered for deciding on the preferred range.
Because it is not ideal nor desired to change the range for a currency
every single month, we perform several checks to avoid this.
- First of all the strength over a period of 12 months. See each row for more information.
- Then the 12 months average, see the last row called "Avg. 12 M."
- The number of months that a currency is stronger than another currency can also be evaluated.
- The TA Charts for each Time Frame can also be consulted.
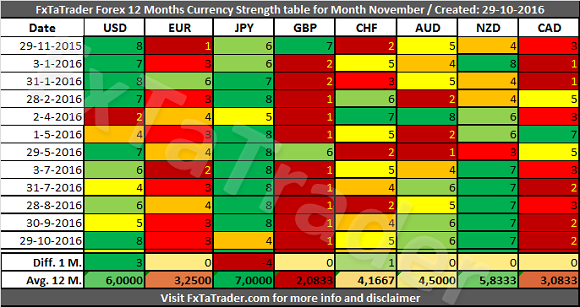
This was updated on 30 September 2016 and is provided here for reference purposes:
Strong: USD, JPY, NZD. The preferred range is from 6 to 8.
Neutral: AUD, CHF. The preferred range is from 4 to 5.
Weak: EUR, GBP, CAD. The preferred range is from 1 to 3.
All the currencies are within their classification when using the Avg. 12 M. Although the JPY is in a dip this month this does not have any effect on the Avg. 12 months Currency Score. The JPY remains the strongest currency.
_____________________________________
The Strong Currencies
The NZD is very stable lately while the USD is gaining strength and coming back to the area of the Strong currencies.
Here below you can see the Monthly Currency Score Chart with 24 months data as a reference.
_____________________________________
Currency Score Comparison
"Comparison
table" and the "Ranking and Rating list"
By using the comparison table directly below you can get a view without the volatility and statistics as opposed to the "Ranking and Rating list". Only the strength of each currency against the counterparts is analyzed by using the Technical analysis charts of the 3 Time Frames that are also used for the "Ranking and Rating List".
The information from the Comparison Table is the source for calculating the "Ranking and Rating List" where this list additionally uses the volatility and statistics for creating the best and worst performer in the list from number 1 to 28.
"Comparison
table" and the "Currency Score Chart"
The comparison table provides a way to compare currencies from a longer term perspective of 12 months and also simultaneously taking the current trend into account. By coloring the currencies in the X and Y axis according to their Classification we can show what the best combinations are. In doing this we apply 2 rules to make it clearer.
- First of all only better classified currencies in combination with weaker classified currencies are "Approved" when there is a Currency Score difference of at least 1 in the current month.
- The only exception is when 2 currencies are similarly classified but the Currency Score difference is equal to or more than 4.
- It means that each currency should be as far apart from each other as possible in the range from 1 to 8. The classification of the currencies in question may change in the longer term. By using the difference of 4 which is exact the half of the range it seems a safe approach for trading 2 currencies which are similarly classified.
- Even though currencies may be in the same classification a currency may be in a weaker/stronger period and may even change its classification in the future. See the current classification for the coming period at the beginning of this article.
______________________________________
Putting
the pieces together
Based on the last "12 Months currency classification" and the "Currency Comparison Table" the most interesting currencies for going long seem to be the:
USD, NZD and AUD.
These are Strong or Neutral currencies from a longer term perspective when looking at the last "12 Months currency classification".
For going short the same analysis can be done and the following currencies seem to fit best:
GBP, CAD and EUR.
These are Weak or Neutral currencies from a longer term perspective.
Currencies with a high deviation seem less interesting to trade because they are less predictable. A good example at the moment is e.g. the:
JPY.
Some of the pairs in the "Currency Comparison Table" comply for a longer term trade based on the Technical Analysis (TA) of the Daily and Monthly chart. For the coming month these seem to be: GBP/NZD, GBP/USD, GBP/CHF, NZD/CAD, EUR/GBP, AUD/CAD, GBP/AUD, GBP/JPY, EUR/USD and USD/CHF.
For the GBP pairs the GBP/NZD seems the most interesting not being yet in the overbought/oversold followed by the GBP/CHF which is a little bit in that area but may stay within when the new month starts. The GBP/USD and EUR/GBP are in extreme overbough/oversold area according to the monthly chart using the Bollinger Band(20). Strong overbough/oversold areas in the Monthly chart may still offer a good opportunity but the pull back may be strong!
______________________________________
Besides this article I also use the Forex "Ranking, Rating and Score" which is also available once a month on my blog. In the article "Ranking, Rating and Score" we look in more detail at the absolute position of the currencies and pairs.
It is recommended to read the page Currency score explained and Models in practice for a better understanding of the article. If you would like to use this article then mention the source by providing the URL FxTaTrader.com or the direct link to this article. Good luck in the coming month.
______________________________________


")

