
The X - Universal Trading Expert Advisor, Constructor, Strategy Builder

| 🧠 The X Universal Expert Advisor for MetaTrader 4 & MetaTrader 5 Universal automatic trading Expert Advisor based on standard MetaTrader indicators, strategy filters, averaging, trend additions, trailing stop, breakeven, virtual stops and advanced money management. The X is not a single fixed trading strategy. It is a professional strategy constructor for traders who want to build, test and optimize their own automated trading systems using standard MetaTrader indicators and powerful Expert Advisor management functions. |
[Русский] - [English] - [Español] - [Português] - [Deutsch] - [Français] - [한국어] - [日本語] - [中文] - [Türkçe] - [Italiano]
| 💎 The X MT4 | 💎 The X MT5 |
| ⬇ Download The X DEMO + PDF | 📘 Full Instruction |
| ▶ Watch Video | 🛒 All Expforex Products |
| 🏠 Main | 🎓 Documentation | ⚙ Settings |
| ❓ FAQ | ⭐ Reviews | 💬 Comments |
🎬 Watch The X Universal EAThe video shows the concept of The X: a universal Expert Advisor that works with standard MetaTrader indicators, signals, filters and a large set of trade-management functions. |
🧠 Automatic Universal Advisor — The X The X is a universal EA designed to work with standard MetaTrader indicators and a wide set of trading functions. |
🚀 What is The X?
The X is a universal Expert Advisor for MetaTrader 4 and MetaTrader 5.
It is designed for traders who want to create automated trading strategies using standard MetaTrader indicators without programming a new EA from zero.
The X includes a large set of signal blocks, filters and trade-management functions. You can choose a main indicator signal, add confirmation filters, select a timeframe for each signal, reverse the logic, use pending orders, manage Stop Loss and Take Profit, add trailing stop, breakeven, averaging, additional openings by trend, time filters, dynamic lot and global profit/loss limits.
This EA is not a “one-click profit machine”. It is a strategy builder. The result depends on your settings, optimization, broker conditions, symbols, timeframe, risk model and testing quality.
📊 Standard IndicatorsBuild strategies using standard MetaTrader indicators such as MA, MACD, RSI, Stochastic, Bollinger Bands, ADX, ZigZag, ATR and others. | 🧩 Signals + FiltersSelect one main signal and add multiple filters to create stricter trading conditions. |
⚙ Full Trade ManagementUse Stop Loss, Take Profit, trailing stop, breakeven, pending orders, virtual stops and close-by-total-profit logic. | 📈 Advanced Strategy ModulesAveraging, martingale, additional opening by trend, dynamic lot, time filters and drawdown protection are available. |
| ✅ Main idea: The X gives you a ready professional EA framework where you can build and optimize your own strategy using standard MetaTrader indicators and advanced trading functions. |
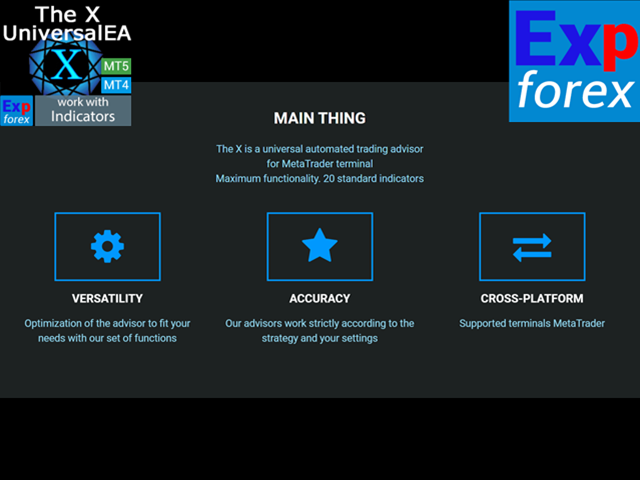
⭐ Main Things: Versatility, Accuracy, Cross-Platform The X is focused on flexibility: you configure the strategy logic, filters, risk model and trade-management behavior. |
🧠 The X is a Strategy Constructor
The most important thing to understand: The X requires optimization and testing.
It includes many ready functions, but the user must decide how to combine them:
- which indicator should generate the main signal;
- which indicators should work as filters;
- which timeframe should be used for the main signal;
- which timeframe should be used for filters;
- whether signals should be reversed;
- whether positions should close when the signal changes;
- whether averaging or trend-addition should be enabled;
- which Stop Loss, Take Profit, trailing and breakeven logic should be used;
- which risk model is suitable for the account.
This makes The X especially useful for traders who want to test ideas systematically instead of manually rewriting Expert Advisor code every time.
📌 Advisor Creation Facts and Workflow The X is built as a configurable professional framework: choose indicators, enable functions, optimize settings, save the configuration and trade with your tested strategy. |

📊 Standard MetaTrader Indicators Inside The X
The X works with standard MetaTrader indicators. This is the main difference between The X and custom-indicator systems.
You can use these indicators as the main signal or as filters:
| Indicator Group | Examples |
| Trend Indicators | Moving Average, MACD, Alligator, Ichimoku, ADX, ADX Wilder |
| Oscillators | Stochastic, RSI, CCI, Williams Percent Range, OsMA, Awesome Oscillator, Accelerator/Decelerator, MFI |
| Volatility and Channel Tools | Bollinger Bands, Envelopes, ATR |
| Price and Structure Signals | Bar direction, ZigZag, Fractals |
| No Signal Mode | Allows the EA to ignore the main signal and work using filters. |
🔎 Signal vs Filter: The Core Logic
The X separates two important concepts: signal and filter.
Signal is the event that creates an entry condition. For example, two Moving Averages crossed each other, RSI crossed a selected level, or price crossed a ZigZag level.
Filter is the current state of the market according to another indicator. For example, a higher timeframe Moving Average allows only BUY trades, or ADX confirms that a trend exists.
| Concept | Meaning |
| Main Signal | The event that allows the EA to open a position. |
| Filter | The condition that confirms or blocks the main signal. |
| Signal Reverse | Reverses the main signal direction. |
| Filter Reverse | Reverses a selected filter direction. |
| Signal Shift | Allows choosing current bar or closed bar logic for signal reading. |
| Example: Moving Average on M30 can be used as the main signal, while Moving Average on H4 can work as a higher-timeframe filter. This allows the EA to open trades only when the local signal agrees with the larger market direction. |
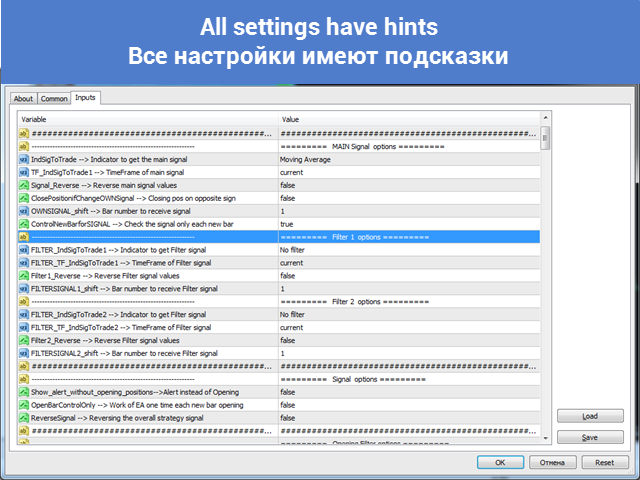
⚙ All Settings Have Hints
The X has many parameters, but the settings window includes hints and structured blocks. This helps users understand the logic without reading the entire documentation every time.
⚙ Settings Window with Hints The input parameters are organized by blocks: signal options, filters, trading functions, stop settings, averaging, time control, trailing, breakeven and limits. |
🧩 Main Strategy Settings
The signal block is the heart of The X. Here you choose how the EA should understand market direction.
| Parameter | Purpose |
| IndSigToTrade | Selects the main indicator and signal used to open the first position. |
| TF_IndSigToTrade1 | Selects the timeframe for the main signal. |
| Signal_Reverse | Reverses the main signal direction. |
| ClosePositionifChangeOWNSignal | Allows closing positions when the main signal changes. |
| OWNSIGNAL_shift | Selects whether the signal is read from the current bar or from a closed bar. |
| FILTER_IndSigToTrade2 ... FILTER_IndSigToTrade6 | Selects additional filters for confirming or blocking the main signal. |
| FILTER_TF_IndSigToTrade | Selects timeframe for each filter. |
| Filter_Reverse | Reverses selected filter logic. |
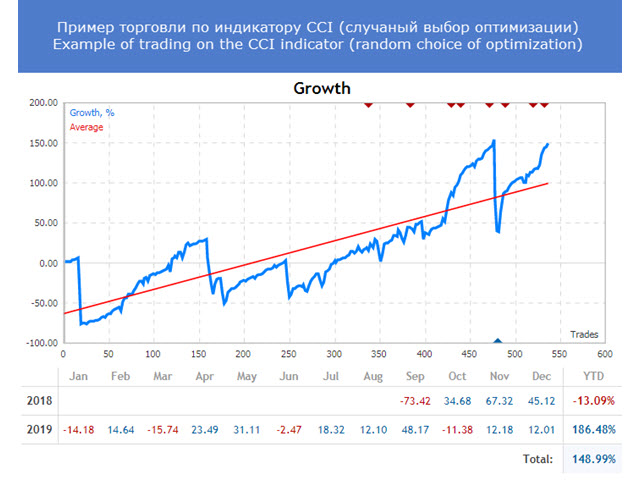
📈 Example: Optimization and Trading by CCI Indicator
The X is useful for testing and optimization. For example, you can choose CCI as a signal or filter, optimize its parameters, and then test how the strategy behaves across a selected period.
The image below shows an example of trading based on the CCI indicator after a random optimization selection. This is not a promise of future results. It is an example of how The X can be used for strategy research.
📈 Example of Trading on the CCI Indicator The X can be used as a research tool for testing standard-indicator strategies and optimizing parameter combinations. |
🛠 Main Trading Functions
The X includes many functions that are often needed in real Expert Advisor trading.
| Function Group | What it does |
| Market and Pending Orders | Open market positions or place pending orders based on selected signals. |
| Stop Loss and Take Profit | Use fixed SL/TP, automatic server minimum levels, forced modification or virtual stops. |
| Trailing Stop | Use standard trailing stop or Parabolic SAR trailing stop. |
| Breakeven | Move Stop Loss to breakeven after the position reaches selected profit. |
| Dynamic Lot | Calculate lot size based on account balance, equity, free margin or selected risk percentage. |
| Martingale | Increase lot after a losing trade according to selected coefficient. |
| Close by Total Profit/Loss | Close positions when total profit or loss reaches selected level. |
| Time Filters | Trade only during selected hours, days, sessions or close positions on Friday. |
🔁 Averaging and Additional Opening by Trend
The X includes two advanced position-building modules:
- Averaging — opens additional positions against price movement when the first position goes into drawdown.
- Additional Opening by Trend — opens extra positions in the direction of profitable movement.
These functions can be useful for certain strategies, but they also increase risk. They must be tested carefully and configured with realistic deposit size, lot size, distance and maximum number of orders.
| Module | Main Parameters |
| Averaging | UseAverage, TakeProfitALL, Distance, DistanceMartin, LotsMartinAverager, MaxOrders |
| Additional Opening | AdditionalOpening, StopLossALL, DistanceAdditionalOpen, LotsMartinAdditionalOpen, MaxOrdersOpenAdditionalOpen |
| Risk note: averaging, martingale and trend additions can increase total exposure. Use them only after proper testing and with strict risk management. |
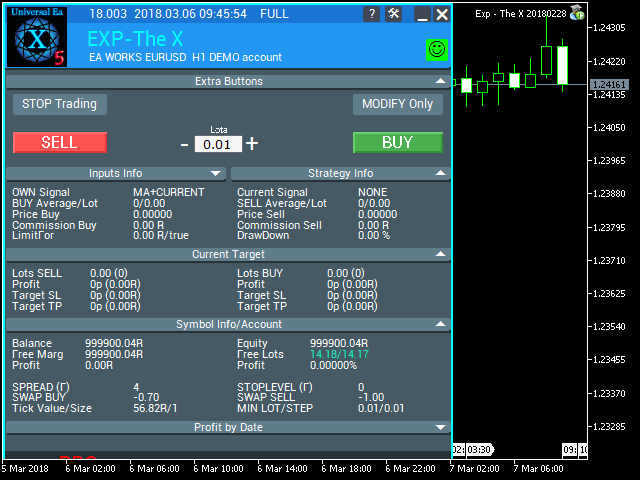
🖥 Working Panel and Trading Information
The X includes an on-chart panel that helps monitor strategy state, current signal, lot size, spread, account information, profit, drawdown and trade-management data.
🖥 The X Working Panel in MetaTrader The panel gives a quick overview of trading status, strategy information, current targets, symbol data and account values. |
🆚 The X vs The xCustomEA
The X and The xCustomEA are based on a similar Expert Advisor framework, but they are designed for different users.
| The X | The xCustomEA |
| Works with standard MetaTrader indicators. | Works with custom indicators through iCustom logic. |
| Includes ready signal logic for built-in MetaTrader indicators. | Requires custom indicator signal configuration. |
| Better for traders who want to build strategies from standard indicators. | Better for traders who use custom arrow indicators or custom programmed systems. |
| No programming is required for standard indicator strategies. | Programming knowledge or ready-made custom indicator logic can be useful. |
| Simple choice: if you want to work with standard MetaTrader indicators, choose The X. If you want to trade using custom indicators, arrows or your own indicator logic, choose The xCustomEA. |
⚙ Main Settings You Should Understand
The X has many settings because it is a universal Expert Advisor. The most important groups are listed below.
| Setting Group | Purpose |
| OWN Signal Options | Select the main indicator, timeframe, signal shift, signal reverse and close-on-signal-change behavior. |
| Filter Options | Add indicator filters, higher timeframe confirmation and reverse logic for each filter. |
| Signal Functions | Alert without opening, open only on new bar, one position per signal, alternating signals and spread filters. |
| Main Trading Functions | Market orders, pending orders, order filling, rounding, slippage, Magic number and comment. |
| Stop Order Functions | Virtual stops, forced SL/TP modification, server minimum stop conversion, fixed Stop Loss and Take Profit. |
| Auto Lot and Martingale | Fixed lot, dynamic lot, balance percent, maximum lot and martingale coefficient. |
| Averaging | Grid distance, lot increase, total Take Profit, maximum orders and OnlyModify mode. |
| Additional Opening by Trend | Add positions in the trend direction with distance, lot multiplier and maximum order control. |
| Time Settings | Trading hours, trading days, Monday/Friday settings, closing positions outside time and Friday close. |
| Trailing and Breakeven | Standard trailing, Parabolic SAR trailing, breakeven level and trailing step. |
| Profit/Loss Limits | Daily, weekly or monthly limits by money, points or balance percentage. |
| Drawdown Limitation | Disable new signals, disable averaging, close positions or send alerts when drawdown levels are reached. |
| 📘 Want the full parameter list? Open the complete The X Settings documentation before using advanced filters, averaging, martingale, virtual stops, profit limits or drawdown controls. |
🧪 Testing and Optimization
The X should be tested and optimized like a strategy builder.
The correct workflow is:
- Select one main indicator signal.
- Select one or more filters only if they improve logic.
- Choose a reliable timeframe and signal shift.
- Test without dangerous money management first.
- Add Stop Loss, Take Profit, trailing and breakeven.
- Optimize indicator settings.
- Check drawdown and stability, not only final profit.
- Test on out-of-sample period.
- Forward test on demo or small real account.
- Only then consider real trading.
| Important: The X is a constructor. There is no universal set file that works equally well for every broker, symbol, timeframe and account. Each user must optimize and validate their own strategy. |
🌐 Broker and VPS Recommendations
The X can trade using different strategies, so broker requirements depend on your selected logic. Scalping strategies need faster execution. Trend strategies can tolerate slower execution. Grid and averaging strategies require more margin and careful risk control.
✅ Recommended
| ⚠ Check Carefully
|
🛠 How to Install and Start The X
Installation is standard for MQL5 Market products. After installation, attach The X to a chart, choose your signal logic, configure filters and test your strategy.
| Step | Action |
| 1 | Download, buy or rent The X for MetaTrader 4 or MetaTrader 5. |
| 2 | Open MetaTrader and log in to the MQL5 account used for the product. |
| 3 | Install The X from the Market section of the terminal. |
| 4 | Attach The X to the chart of the symbol you want to test. |
| 5 | Enable Algo Trading / Auto Trading and allow automated trading in EA settings. |
| 6 | Select the main signal in IndSigToTrade. |
| 7 | Add filters only when they improve the strategy logic. |
| 8 | Configure Stop Loss, Take Profit, trailing, breakeven and money management. |
| 9 | Optimize and test the strategy in the Strategy Tester. |
| 10 | Run forward testing on demo or small real account before using serious capital. |
🔗 Useful Links🔹 Buy / Rent The X for MetaTrader 4 🔹 Buy / Rent The X for MetaTrader 5 |
❓ Practical FAQ
Do you provide universal set files?
No. The X is a strategy constructor. Each user should build, optimize and validate their own settings for their broker, symbol, timeframe and risk model.
What is the difference between The X and TickSniper?
TickSniper is already designed as a specialized automatic tick scalper. The X is a universal constructor where the trader builds their own strategy from standard indicators and management functions.
Can I use custom indicators in The X?
The X is designed for standard MetaTrader indicators. For custom indicators, use The xCustomEA.
Why are MT4 and MT5 test results different?
MT4 and MT5 have different tester engines, quote history, execution modeling and indicator handling. Results may differ even with similar logic.
Which indicator is the best?
There is no universal best indicator. MA, MACD, RSI, Stochastic, CCI, ADX, Bollinger Bands, ATR and other tools can work differently depending on symbol, timeframe and market state.
📌 Practical Recommendations
- Start with one simple signal and one simple filter.
- Do not enable all functions at once.
- First test without martingale and averaging.
- Add money-management functions only after the signal logic is stable.
- Use closed-bar signals when you want more stable historical testing.
- Use current-bar signals only when you understand repainting and live behavior.
- Check spread, slippage and broker stop levels.
- Do not optimize only for maximum profit.
- Always check drawdown, recovery factor and stability.
- Forward test the result before real trading.
⚠ Risk Warning
| Trading Forex and CFDs involves risk. The X is a universal Expert Advisor and strategy builder. It can use averaging, martingale, dynamic lot, pending orders, virtual stops, trailing stop and total profit/loss closing. These functions can increase both flexibility and risk. The EA does not guarantee profit. Results depend on your strategy, optimization, broker conditions, spread, slippage, symbol, timeframe and money management. |
🏁 Final Thoughts
The X is a serious tool for traders who want to automate strategies based on standard MetaTrader indicators.
It combines signals, filters, timeframe logic, order management, trailing stop, breakeven, averaging, trend additions, dynamic lot, martingale, time filters, drawdown controls and global profit/loss management in one Expert Advisor.
If you want a ready strategy that trades automatically without optimization, The X is not the right expectation. But if you want a flexible professional constructor for building your own automated trading systems, The X can become one of the most powerful tools in your MetaTrader workspace.
🚀 Build Your Own MetaTrader Strategy with The XDownload the demo, study the settings, select a signal, add filters, optimize your strategy and test it carefully before real trading. |
| ▶ Watch Video | 📘 Full Instruction |
| 💎 Buy The X MT5 | 💎 Buy The X MT4 |
| ⬇ Download DEMO + PDF | 🛒 All Expforex Products |
SEO Tags
The X, Exp The X, The X Universal Expert Advisor, MetaTrader universal EA, MT4 universal Expert Advisor, MT5 universal Expert Advisor, Forex strategy builder, MetaTrader strategy constructor, Expert Advisor on standard indicators, automatic trading robot, Forex trading robot, MA Expert Advisor, MACD Expert Advisor, RSI Expert Advisor, Stochastic Expert Advisor, CCI Expert Advisor, Bollinger Bands Expert Advisor, ADX Expert Advisor, ZigZag Expert Advisor, ATR Expert Advisor, Fractals Expert Advisor, MetaTrader indicator strategy, automated trading system, EA with filters, EA with averaging, EA with martingale, EA with trailing stop, EA with breakeven, dynamic lot EA, virtual stops EA, close by total profit EA, Expforex The X, MQL5 Market Expert Advisor


