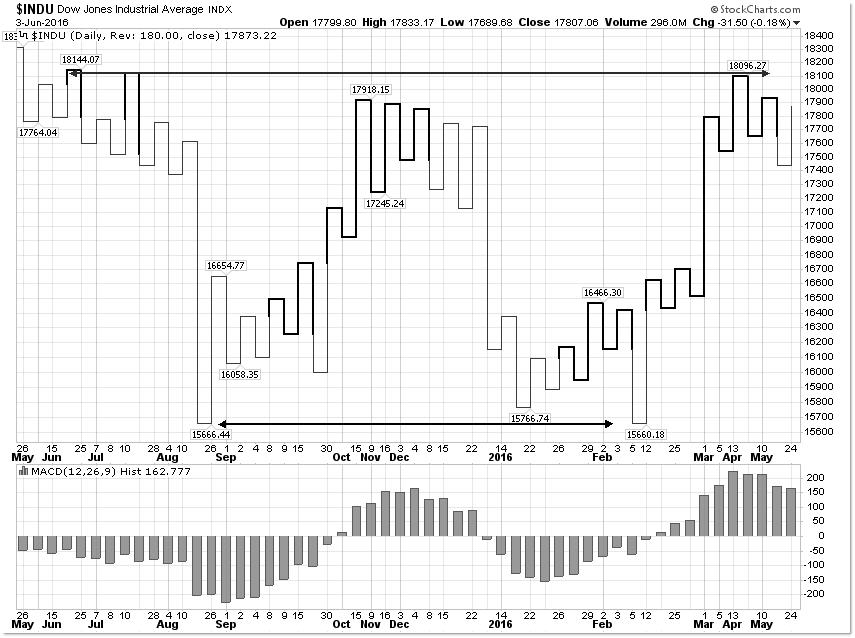
All Blogs / Analytics & Forecasts All Blogs Analytics & ForecastsWeekly TrendsForecastsTrading SystemsMy TradingChartsTrading StrategiesStatisticsTrading IdeasScalpingNeural NetworksWave CountMarket NewsCurrencyMetalsCrude OilCompany NewsEventsBanksBrokersLaw/RegulationsOther Rules Analytics & Forecasts Kagi chart & Dow Jones Industrial 5 June 2016, 22:04 Muhammad Elbermawi 0 165 Dow Jones Industrial Kagi Chart 1% shows support around 15660 & resistance around 18100.Forecasts is down trend to target 15000 before December 2016. To add comments, please log in or register The Real Case for Passive Income Through Automated Trading: Why the System Runs While You Live Your Life Other 13 0 Surviving the Drawdown: Why Staying the Course Is the Hardest and Most Important Decision in Automated Trading Trading Strategies 12 0 The Future of Automated Trading: How AI Is Replacing Traditional Algorithms — And Why the Window for Early Adoption Is Trading Systems 16 0 The Hidden Variable: Market Regimes and Why Every Fixed Automated Trading System Eventually Fails Trading Strategies 13 0 Why Your Expert Advisor Worked in Backtest and Failed Live: The Complete Guide to Backtesting Limitations Trading Systems 14 0 Global Rank #24: How Did Smart Gold Hunter Signal Surpass Quantum Queen Shortly After Launch? Analytics & Forecasts 16 0 Three Ways Your Session Filter Gets Time Wrong (And the Permanent Fix) Trading Systems 18 0 Gold Hook Trap Pro — User Guide Trading Strategies 19 0 Gold Confluence Pro — User Guide Trading Strategies 13 0 365 Why Do So Many Traders Lose Profits They Already Earned? 59 Forex and Cryptocurrency Forecast for June 29 – July 03, 2026 38 Five Structural Failures I Find in Most "Working" EAs forex technical analysis eurusd EUR/USD gbpusd gold usdjpy GBP/USD usd/jpy usd Trading AUD/USD usd/chf S&P 500 forecast usd/cad Fed bitcoin Fxwirepro dax fundamental analysis VistaBrokers Gold spot ($) Silver spot ($) Crude Oil (WTI) USD/TRY audusd EUR forex news ECB