Gold Analysis for April 14, 2016


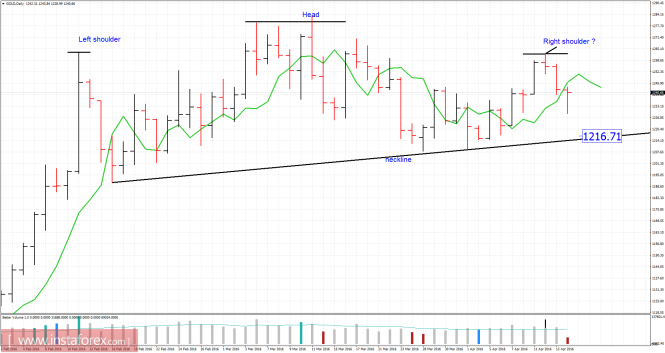
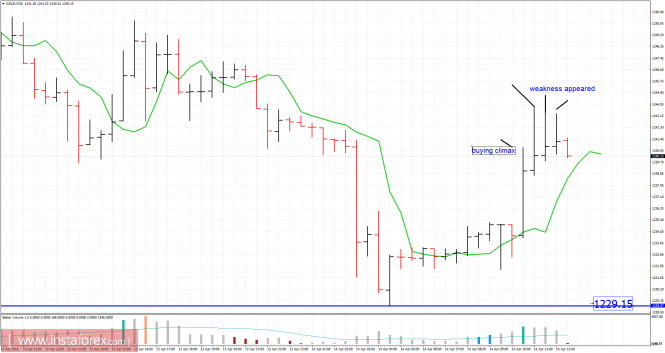
Since our previous analysis, gold has been moving downwards. The price tested the level of $1,228.99 in a high volume. According to the daily time frame, I found that head and shoulders pattern (topping formation) is forming. According to the 30M time frame, I found a lack of demand near the level of $1,243.00. We can observe buying climax followed by few weak up bars (strong sign of weakness). The support level is set at the price of $1,229.00. Watch for intraday selling opportunities on rallies. The valid breakout in a high volume of $1,216.50 will confirm the head and shoulders formation.
Daily Fibonacci pivot points:
Resistance levels:
R1: 1,254.00
R2: 1,258.25
R3: 1,264.75
Support levels:
S1: 1,241.00
S2: 1,237.00
S3: 1,230.60
Trading recommendations for today: Be careful when buying and watch for potential selling opportunities.
The material has been provided by InstaForex Company - www.instaforex.com


