

Oil, Stocks and Banks: The Transmission of Contagion
Talking Points:
- Global stocks put in an aggressive rally this week after China re-opened from the Lunar New Year. This led many to ask whether we’ve hit a bottom in stock prices after setting new lows just last Thursday.
-Be very careful of calling a bottom or a major market theme after just one week of price action. As we’ve discussed before, major market turns take time.
- If you’re looking for trade ideas, check out our Trading guides, in which the DailyFX team delivers forecasts as well as Top Trade ideas for 2016.
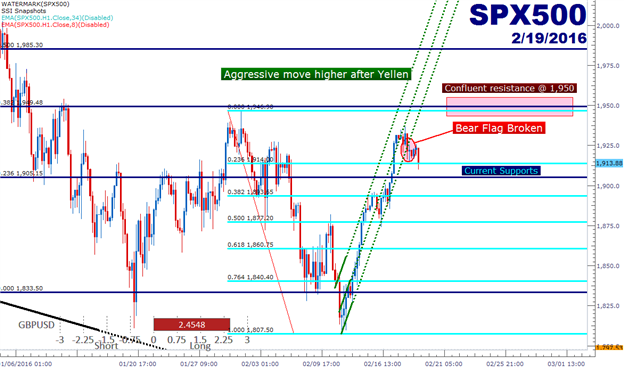
Most global equity markets are trading lower on the morning after a huge week of rallies that had begun around Ms. Yellen’s Congressional testimony last week. In that testimony, she helped to allay concerns of acompletely disconnected Central Bank, as she mentioned data dependency and a non-committal stance towards future rate hikes. This, at the very least, helped to stem the declines that have become commonplace with 2016.
This led to a near 7% incline over the course of four trading days on the SPX500, creating an extremely aggressive trend-channel after a large move lower. As we discussed yesterday, this is on the back of virtually no other positive news outside of that dose of confidence that Chair Yellen delivered last week. Just yesterday we heard the Central Bank of Norway warn that ‘winter is coming,’ alluding to fears of a prolonged global slowdown on the back of lower Oil prices, and the Central Bank of Hungary began to stockpile ammunition. These reports began circulating yesterday, just as we began to break the under-side of the bear-flag formations that have shown up in many global equity markets.
The break of a bear-flag could be significant as it signals a slowdown of the previous retracement, and the potential for a return of the predominant trend, which for global equities right now is lower. Watch the confluent resistance area at 1,950. Should price action continue lower, testing through support at ~1,915 and then ~1,905, short-side positions could become attractive again.
The Transmission of Contagion
One of the growing themes this year has been the widely followed correlation between oil prices and stocks. This is somewhat of an abnormality because traditionally, lower oil prices have been a positive for American consumers. So, lower oil prices were thought, for a very long time, to be a bullish thing for stocks. And this made sense to a degree, if a country is importing all of their oil, well oil prices going down means a few more dollars in those consumer’s pockets; just like a tax refund. And if those consumers have a few extra dollars, they’ll likely spend it, and this means better performance for corporates.
But as we posited back in October, that relationship doesn’t really hold true any longer, at least for the United States, because the fracking and shale revolution have made the US a net producer of energy. Meaning lower oil prices might put a few more dollars in consumer’s pockets, but lost profits, lost jobs and increased headwinds for oil producers would likely offset whatever benefit lower oil prices brought to the table.
But perhaps even more threatening from this softness in Oil prices is the prospect of contagion; the same thing that roiled markets when European Sovereign debt was on the verge of blowing up in 2012. When people (or countries or companies) stop paying their bills, the banks that they owe money to get hit really hard: Someone has to absorb that loss, and for the bank ‘non-performing loans’ are the bane of their existence. It’s normal to have some non-performing loans, that’s just a part of doing business. But when a predominant theme envelops an entire industry (like technology in 2000 or housing in 2007), major problems can ensue because banks get hit by multiple non-performing loans from an entire industry at the same time.
This is the point where the pain can spread from the borrower to the issuer; and unfortunately the issuer can’t just absorb the entirety of the hit – that gets spread out to the investors backing that borrower. This is what the Troubled Asset Relief Program was about in 2008. Banks were getting hit so hard that the government had to come in to help absorb some of the loss.
After six years of ZIRP, investors had to search far and wide for yield. This meant more risk was taken on that normal because of a distorted investment environment. This drove capital into research and development and more speculative industries. But as rates rise, so do opportunity costs. We’ll see fewer expenditures into more speculative investments, and this in and of itself can become a headwind for growth; as that ‘drying up’ of fresh capital can make it difficult for young or speculative companies to continue operating (considering many of these types of outfits operate at a loss for numerous years before attaining profitability).
And as that pressure picks up, more borrowers are unable to re-pay their loans, and banks begin to see a rise in non-performing loans. Now if you combine that impact with Oil prices disintegrating, you have a real problem on your hands because these borrowers get hit not only by rising financing costs, but declining commodity prices which put direct pressure on a producer’s margins; in many cases beyond the point of profitability.
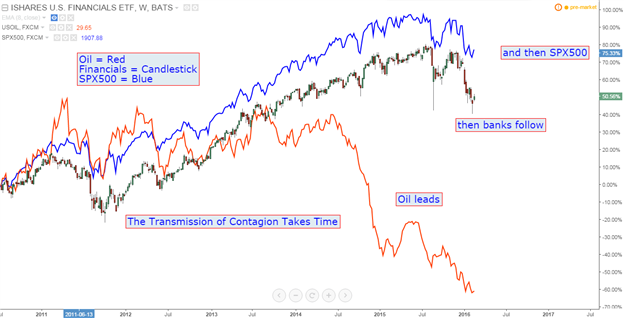
So, this transmission traditionally takes time. Because borrowers don’t just call their bank as oil prices are dropping to say ‘hey, about that interest payment, that’s not going to happen, but maybe next time.’ Instead, we see non-performing loans rise in the months and quarters following the hit to commodity prices, and this hits banks profit margins, which then impacts their lending and risk-taking activities.
What we’re seeing now with the correlation between Oil prices and stock prices is investors attempting to get ahead of this expectation. But saying that this theme is divorced simply because of one day or one week’s worth of observation is incredibly short sighted. Instead, look inside of the matter by watching performance of banks. Right now, that isn’t pretty. On the chart below, we’re looking at the ETF for ‘IYF’ which represents American Financial companies.
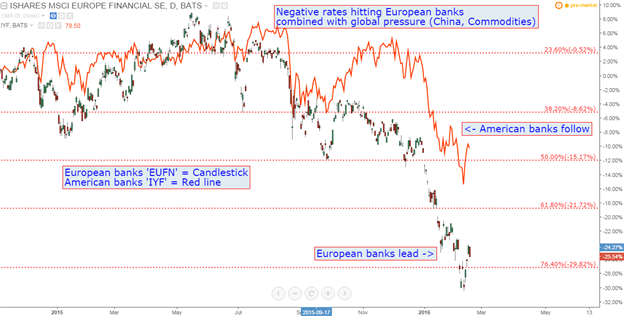
But perhaps even more troubling to the prospect of contagion is what is happening to European banks right now. Over a year’s worth of negative rates from the ECB have only put these banks in a more precarious position to deal with some of these global headwinds, and at the end of January (towards the top of the previous reversal-rally), we discussed how Italian banks are screaming warning signs to the European Central Bank.
This is just another difficult factor for American banks to deal with given counter-party risk. If a bank in Europe that does significant business with US banks gets hit, well that bank won’t be able to honor all of their commitments to their counter-parties. And after years of negative rates in Europe, European banks are in a really tough spot.
On the chart below, we’re looking at the ETF for ‘EUFN,’ representing European banks. We’re also comparing this to American banks, as represented by that same ‘IYF’ ETF from the previous chart.
Banks are the segment of the economy to watch for further global pressures. Sure, oil prices carry an impact, but that transmission is often delayed; although it looks like it may have already begun.


")
![[XAUUSD]: Weekly Liquidity Activation Points (timings), June 22-26, 2026](https://c.mql5.com/6/1013/splash-preview-771790.png "[XAUUSD]: Weekly Liquidity Activation Points (timings), June 22-26, 2026")
