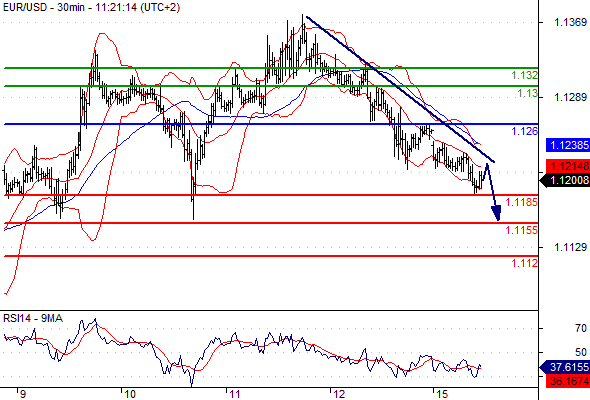
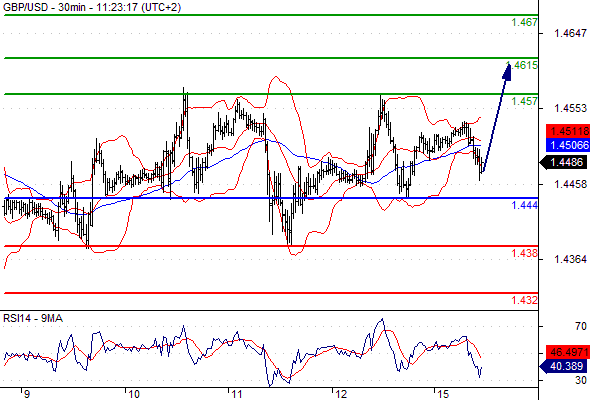
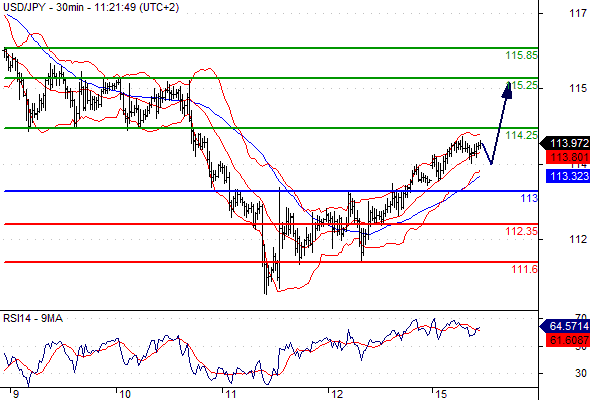
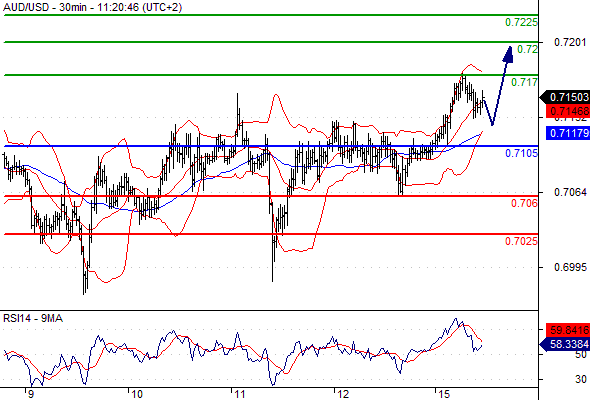
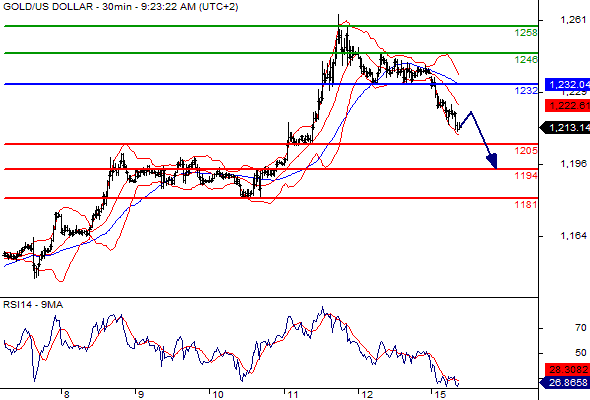
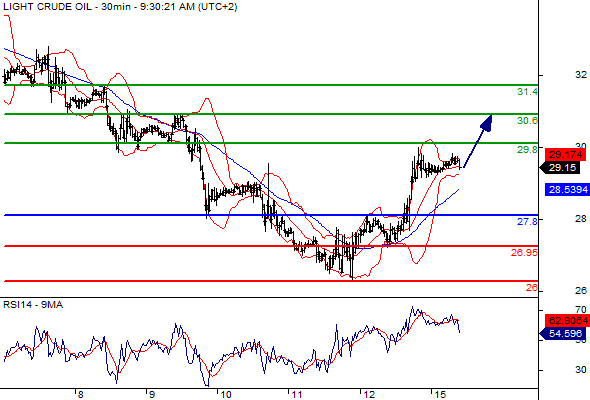
All Blogs / My Trading / Charts All Blogs Analytics & ForecastsWeekly TrendsForecastsTrading SystemsMy TradingChartsTrading StrategiesStatisticsTrading IdeasScalpingNeural NetworksWave CountMarket NewsCurrencyMetalsCrude OilCompany NewsEventsBanksBrokersLaw/RegulationsOther Rules Charts Pre US Open, Daily Technical Analysis Monday, February 15, 2016 15 February 2016, 13:25 Mohammed Abdulwadud Soubra 0 147 Pre US Open, Daily Technical Analysis Monday, February 15, 2016 Please note that due to market volatility, some of the below sight prices may have already been reached and scenarios played out. EUR/USD Intraday: the downside prevails. Pivot: 1.1260Most Likely Scenario: short positions below 1.1260 with targets @ 1.1185 & 1.1155 in extension.Alternative scenario: above 1.1260 look for further upside with 1.1300 & 1.1320 as targets.Comment: the RSI is capped by a declining trend line. GBP/USD Intraday: the bias remains bullish. Pivot: 1.4440Most Likely Scenario: long positions above 1.4440 with targets @ 1.4570 & 1.4615 in extension.Alternative scenario: below 1.4440 look for further downside with 1.4380 & 1.4320 as targets.Comment: the RSI lacks downward momentum. USD/JPY Intraday: the upside prevails. Pivot: 113.00Most Likely Scenario: long positions above 113.00 with targets @ 114.25 & 115.25 in extension.Alternative scenario: below 113.00 look for further downside with 112.35 & 111.60 as targets.Comment: the RSI is bullish and calls for further advance. AUD/USD Intraday: the upside prevails. Pivot: 0.7105Most Likely Scenario: long positions above 0.7105 with targets @ 0.7170 & 0.7200 in extension.Alternative scenario: below 0.7105 look for further downside with 0.7060 & 0.7025 as targets.Comment: the RSI is mixed to bullish. Gold spot Intraday: under pressure. Pivot: 1232.00Most Likely Scenario: short positions below 1232.00 with targets @ 1205.00 & 1194.00 in extension.Alternative scenario: above 1232.00 look for further upside with 1246.00 & 1258.00 as targets.Comment: the RSI lacks upward momentum. Crude Oil (WTI) (H6) Intraday: continuation of the rebound. Pivot: 27.80Most Likely Scenario: long positions above 27.80 with targets @ 29.80 & 30.60 in extension.Alternative scenario: below 27.80 look for further downside with 26.95 & 26.00 as targets.Comment: the RSI is mixed to bullish. To add comments, please log in or register Trading Time Filter for Any MT5 Expert Advisor Trading Strategies 4 0 Panther Trade Scenario indicator trade review on XAUUSD from May 11 to 15, 2026 My Trading 22 0 Intradaysoft CORE (May 11 – May 17) My Trading 21 0 XAUUSD, EURUSD, USDJPY: Review of trades of the Owl Smart Levels system from May 11 to 15, 2026 My Trading 31 0 Diamond DE40 My Trading 39 0 Mastering High-Probability Reversals with the CRT Concept (ICT Methodology) Trading Strategies 43 0 Why Most Grid Systems Blow Accounts — And How Smart Grids Survive Trading Strategies 48 0 Apex Drawdown Zero — Price Increase Blog Post My Trading 42 0 Two Gold EAs, One Account, Correlation 0.2: What Happens Next Will Surprise You Analytics & Forecasts 23 0 99 XAUUSD Market Analysis – Monday Market Opening (18/05/2026) 41 Institutional Grade Gold Briefing for Monday, May 18, 2026. 25 [iVISTscalp5]: A Laboratory for Market Behavior Research Through Time forex technical analysis eurusd EUR/USD gbpusd gold usdjpy GBP/USD usd/jpy usd Trading AUD/USD usd/chf S&P 500 forecast usd/cad Fed bitcoin Fxwirepro dax fundamental analysis VistaBrokers Gold spot ($) Silver spot ($) Crude Oil (WTI) USD/TRY audusd EUR forex news ECB


")

![[iVISTscalp5]: A Laboratory for Market Behavior Research Through Time](https://c.mql5.com/6/1005/splash-preview-770124.jpg "[iVISTscalp5]: A Laboratory for Market Behavior Research Through Time")