
Applying Simple Mathematics to Evaluate Your Trading Results

Mathematics is an essential tool in many fields, and it should be used extensively in trading as well. By using mathematics you will reduce emotion and uncertainty, two of the biggest hurdles a trader faces. I wrote a comment in another member's article on how he could test his trading system, so I thought that it was probably beneficial for more traders if I wrote a simple and easy to understand article, on how to backtest a system/strategy and evaluate its perfomance, using a few mathematical formulas.
At the end of the article there's a link to an Excel file which contains a calculator, so you can easily and quickly compute these formulas without having to do any maths.
________________________________
► How to do manual backtesting
If you have developed a new system, or have a new idea but don't know if it is profitable in the long run or not, and don't know how to program an automatic backtest to check its profitability, you can do a manual backtest instead, also called paper trading.
This is similar to using a demo account, because there is no financial risk. However, when you use a demo account to test your systems, it can sometimes take a long time for a statistically valid number of trades to occur. You need, at the very least, about 100 trades to have a sample big enough to be statistically valid, but I would advise on testing much more than 100 trades, the more the better. With backtesting you have access to historical data, and this gives you the opportunity to quickly test the system in hundreds of trades.
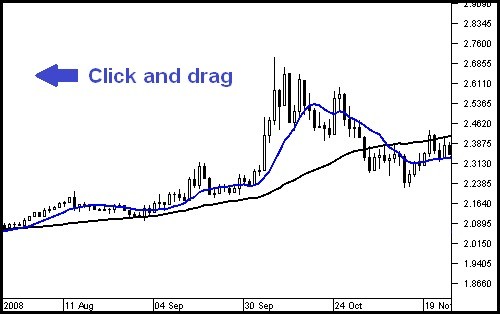
Open the trading platform, place your charts and all the indicators, lines, etc, that are part of your strategy, and then drag the chart to show a previous date, a few years at least, depending on the time frame you use. If you're a scalper a few weeks may be enough, if you're a long term trader who uses weekly charts then you need as many years as possible, 10-15 at least. Then slowly drag the chart forward, candle by candle, as if it was a live market and new candles were being created.
When you notice a possible trade setup according to your system's rules, write down the entry price, keep dragging the chart candle by candle, and analyse the final result of the trade, writing down the closing price. Do this for a significant number of orders, write down the number of trades, loses, wins, money won, money lost, etc. Always take into account slippage, commissions and swap rates in case you keep your positions open overnight, to better simulate a live account.
This information, combined with the formulas I will describe, should give you a good picture of the profitability of the system, and if it should be traded in a live account or not.
________________
► Win Ratio (%)
This is simply the total number of winning trades divided by the total number of trades, and then multiplied by 100 to give you a percentage.

_______________
► Profit Factor
This is the total money won on the positive trades, divided by total money lost on the negative trades. Anything above 1 means that the system is profitable, anything below 1 means that it is not profitable.

______________________________
► Risk/Reward Ratio Per Trade
It measures the ratio between the money lost and the money won on average, per trade. If, on average, you make $500 when you win, and lose $200 when you have a negative trade, then the Risk/Reward Ratio is 2.5, which means that for every unit risked you made 2.5.

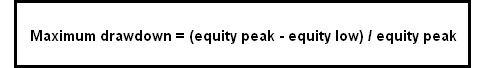
► Maximum Drawdown
This calculates the highest percentage loss from an equity peak to the subsequent equity low. If, at some point, you had 1000 units, and then after a few trades you only have 700, the drawdown is 30%.
► Compound Annual Growth Rate (CAGR%)
This is a bit more complex to calculate, but it is extremely indicative of how well a system performs. CAGR indicates the smoothed annualized growth of an investment over a specific period of time. Or, in other words, how much you'd make every year (or week, month, etc) if the returns were constant and steady. This indicator is used extensively in the financial industry.
If you started on year 1 with 1000 units, and 4 years later you have 1500 units, that means you had a CAGR of 10.67%. You can measure not only annual growth rates, but actually any time frame you wish. If you are a short term trader and want to calculate your weekly growth rate, just use the number of weeks that have passed instead of years.
The CAGR, using the first example, is the ratio of the ending value to beginning value (1500/1000 = 1.5) raised to the power of 1/4 (4 is the number of years or periods), then subtracting 1 from the result.

______________
► Conclusion
To make things easier for everyone, I've created a calculator on Excel, you just need to enter the variables and it gives you the results. This is how it looks like:

You can download it HERE.
Feel free to leave a comment or ask any questions you may have.


