

The indicator "Bright Road" be built on the basis of analysis of rates for a fixed period. And naturally (as with any cumulative indicator) is associated with Bolinger Bands though and based on other principles. Use these relationships and differences to improve the strategy using Bolinger Bands basically
The Bright Road indicator is displayed as two lines — the orange line "Road" and the line of colored circles "Bright".
Enough to carefully consider their behavior relatively Bolinger Bands taken from the same period to see those moments that will help improve strategy.
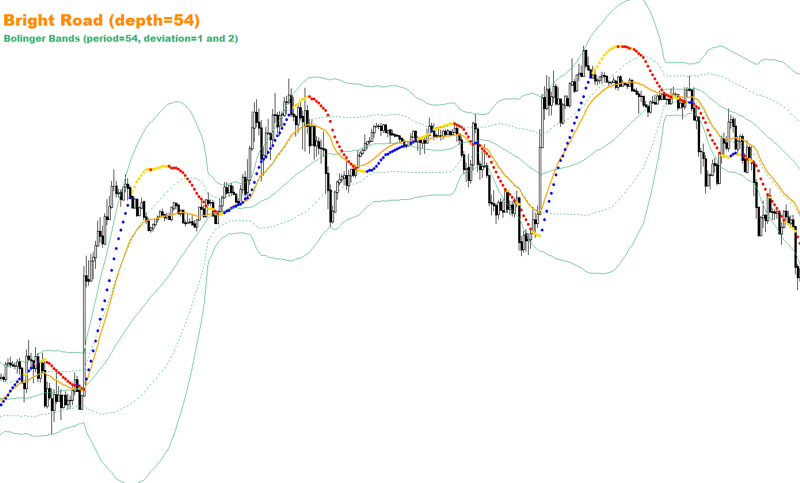
For illustration see Bright Road with default settings and Bolinger Bands taken from the same period (54 bar) and standard deviations 1 and 2. Choose a moment in history where it was expected the movement strategies based on the breakout of the lines BBands.
.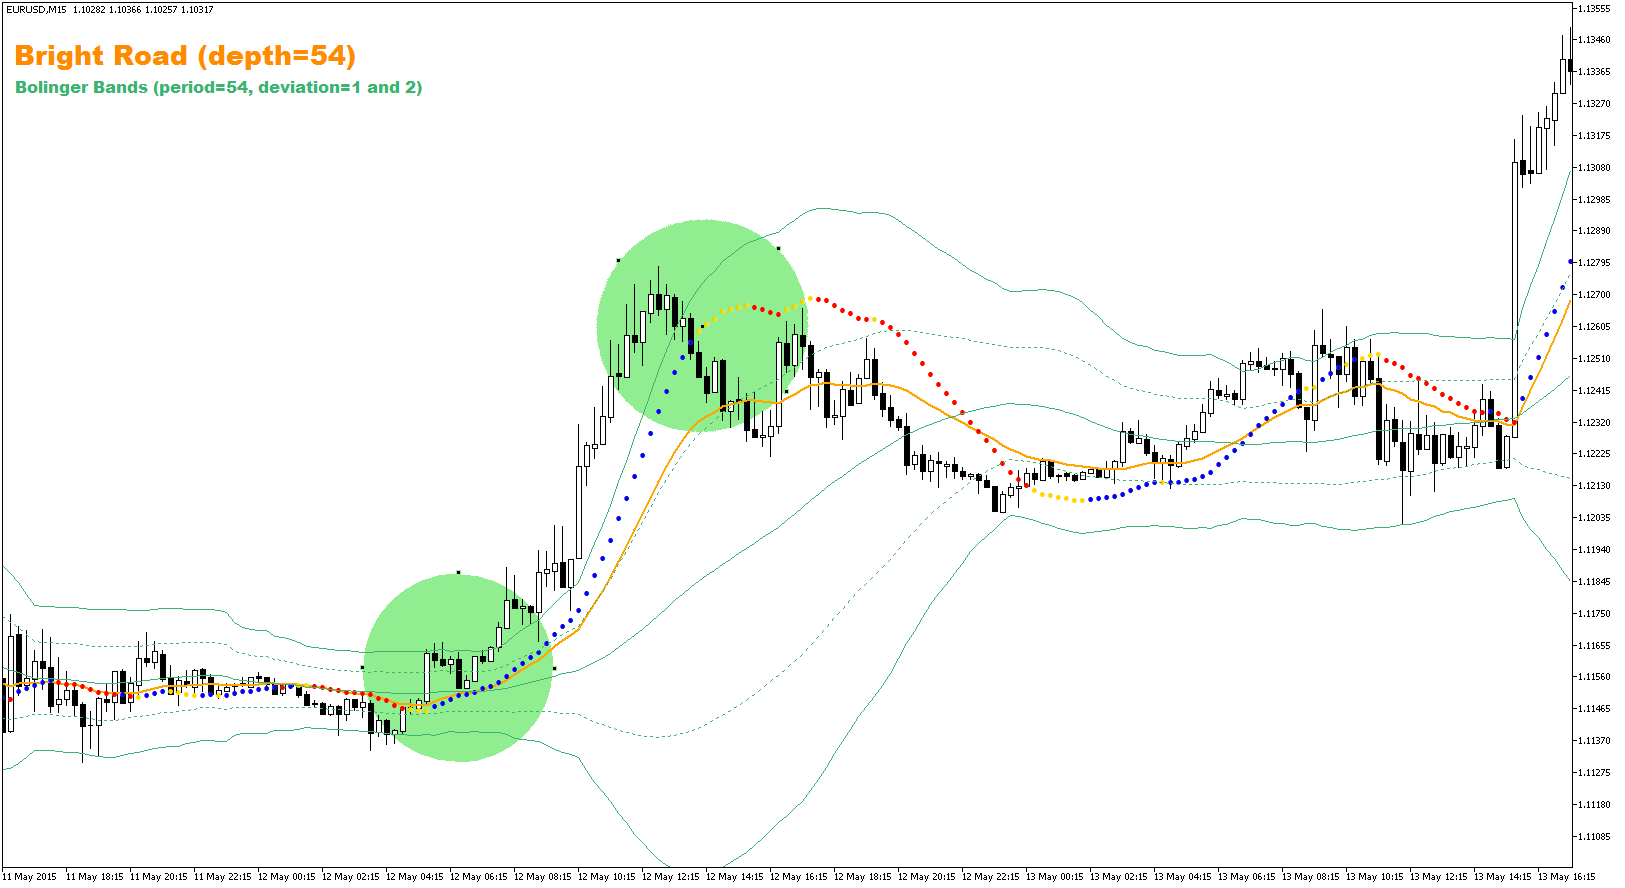
The graph shows that the indicator Bright Road is well caught starting on time and announced the end of the pulse. Let's look at the details of the three phases of the event: a breakthrough line Bolinger upward movement along the pulse return to normal prices
Phase 1: The beginning of the movement and a break Bollinger Bands
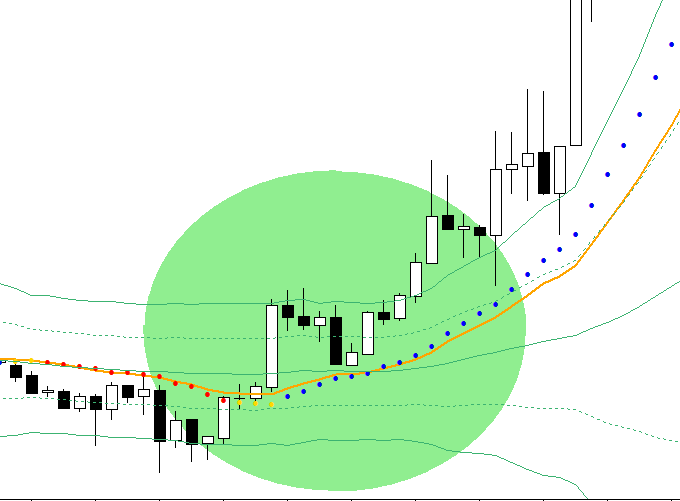
series the following events occur:
- price deviates to the bottom line and starts to rise Bbands
- Bright signals in yellow "CAUTION" and switches to blue
- the price steadily and almost linearly increasing
- both lines Bright Road crosses the SMA
- and finally the price beyond the Bands 2, line Bright ahead Road, and Road begins to move along with the Bands 1
Phase 2: The price movement outside of the Bands
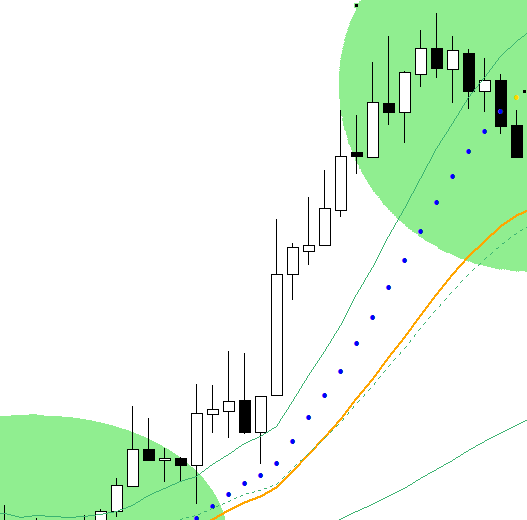
- both lines of the Bright Road indicator grow, the distance between them increases
- Bright color line remains blue
- Road line moves very close to Bands1 and almost simultaneously with it
Phase 3: the completion of the pulse and the revival of the price within the Bands
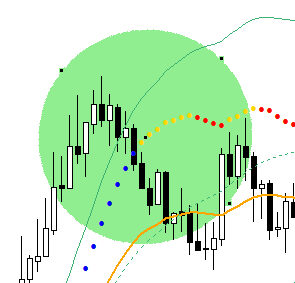
the following happens:
- price reverses and crosses the line Bands2 then the line "Bright"
- the yellow indicates "COUTION"
- the price reaches and crosses the line of the Road following close to the Bands1
- line Road begins to move away from Bands 1
Our consideration of the joint behavior of the two indicators is already enough to draw some conclusions, can improve strategies based on the breakout of the lines and Bands "catching" of this movement.
Conclusions:
- check the movement of the indicator line Road - the intersection of SMA and its starting to Bands1 says about the beginning of the pulse. This is a good confirming signal of an impending break through of Bands.
- flashlight Bright gives a very good preliminary signal and if it is confirmed by other indicators then it is possible to open a transaction.
- while the Road moves close to and parallel with Bands1 can be calm in motion pictures
- exit is possible (and necessary) warning signal "Bright" or change its color to the opposite.
Bright Road for MT 4 available on Market: https://www.mql5.com/en/market/product/13886
Version for Meta Trader 5 also available: https://www.mql5.com/en/market/product/14014
And finally, another picture showing the inner connection Bright Road and Bolinger Bands:


 & AMD Framework")