

On this post, we will explain what this indicator is, how it is calculated as well as suggest some ways to trade with it.
Simply said, Power Candles (or PC from now on) are very strong price movements when compared to previous candles. They frequently (but not always) appear during release of economic data and opening of London and NY markets. It is a downright simple measure of market volatility.
We created the indicator because we wanted to have an exact measure on how much of an impact the current price movement is bringing to the market. Sure, anybody can spot a big candle being formed, but saying "it's a big candle" is not something that a computer or an EA can understand. Besides, human interpretation is often faulty, and I believe there is always a need to base our decisions on established parameters rather than subjective information.
They are calculated by taking the current candle's range (High - Low) and dividing it by the average range of the candles you want to compare it with. Let's say, for example, that we want to calculate the Power Candle's value for the yesterday's AUDJPY movement on the Daily timeframe (Figure 1).
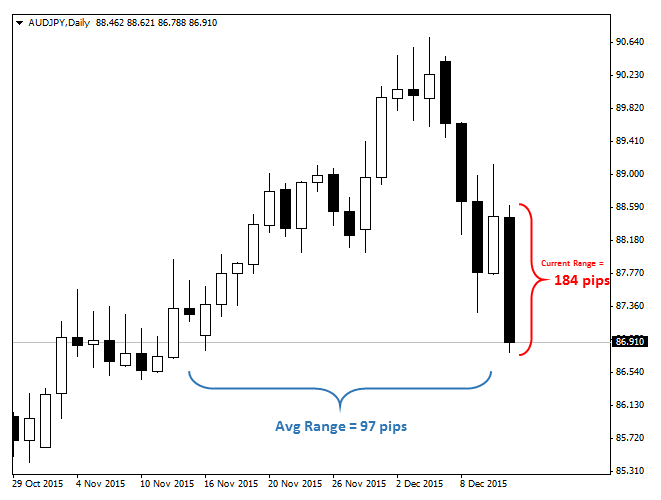
Figure 1
In this case, we are comparing the current candle with the previous 20. The current candle has a range of 184 pips. The average of the previous 20 is 97, We actually have to take the candle ranges one by one and divide the sum by 20.. no way around that! But we just put the result here so we don't waste too much time on details. Now we have all we need: PC = 184/97 = 1.89. So now we know that yesterday's price movement was 1.89 times higher than the recent average.
In our indicator, we plot these PC values on a histogram below the chart, usually putting a line on key limits, such as 1.00, 2.00 and 3.00, to make the analysis easier (Figure 2).
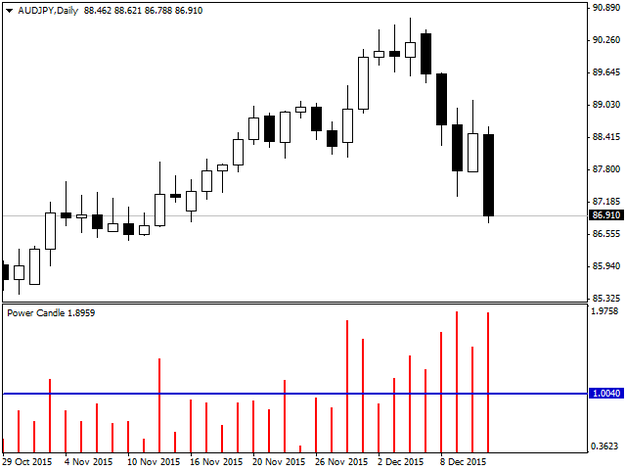
Figure 2
We can play with this indicator in many ways. Besides the obvious possibility of choosing other number of periods to create the average, we can also filter the range of specific candles that seem more meaningful. For example, we all know that the H1 candle from London's opening will likely have a PC well above 1.00, because that's a time when volatility picks up. But what if we compare it with the previous 20 London opens alone? So we pick the last 20 H1 08:00 GMT candles and make an average specific for that time. Now we know if the opening is going stronger or weaker than usual, such as in this case (Figure 3) where we can see that the range of the candles in the morning are both above 3 times the normal volatility.
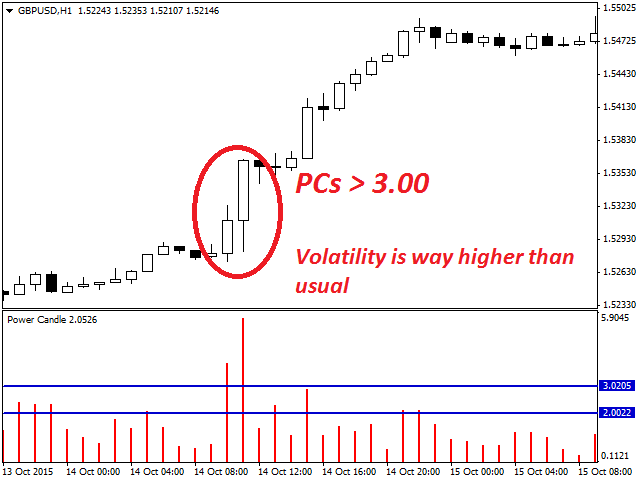
Figure 3
Great, but what does this all mean? What really matters is if an indicator has any predictive power or not. We conducted many tests to verify its effectiveness by creating EAs with opening and closing conditions based on the indicator. The results were better than we expected.
One of the tests we made: Long when bullish PC > 2.5 and Short when bearish PC > 2.5. Every position closing after 4 candles. We tested this out on the EURUSD M15 chart, with 15 years of data (2000 - 2014). Results are the following:
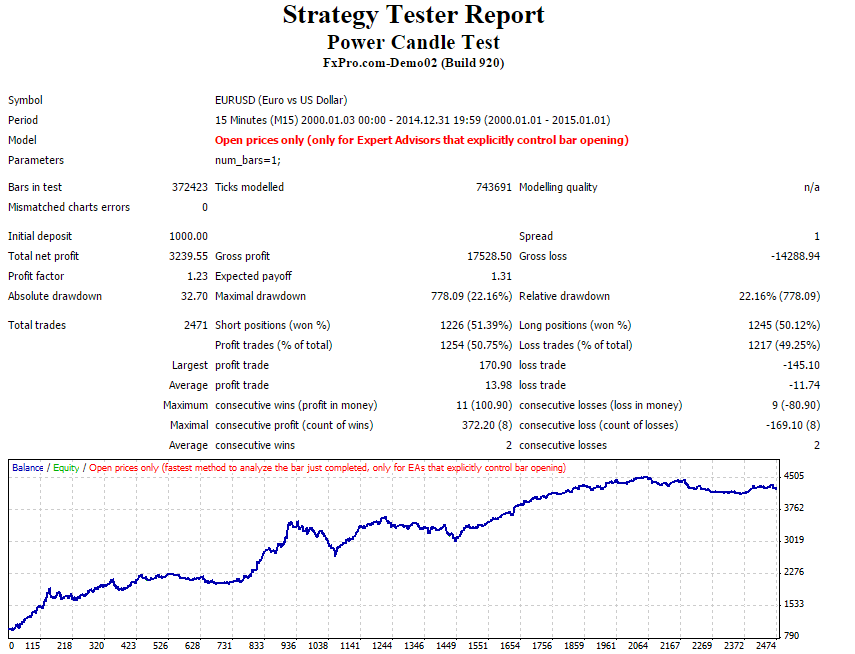
Figure 4
To summarize our findings on Power Candles:
- Values < 2: Weak candles. Many of these price changes are just market noise and moves may not be significant.
- Values from 2 to 4: These are the real Power Candles! Strong, significant price moves. They indicate the beginning or continuation of a trend in the direction they point to.
- Values > 4: Overly strong move. Although it generally defines a significant trend, a short-term correction may occur after these candles. Entries have to be carefully planned.
So, don't fight the market current.. especially when it's strong!
The Power Candle Indicator is available for Meta Trader 4 on MQL5's website. You can find it by clicking here.
Also, you can find one of the strategies we created based on Power Candle values here.
Later on we intend to make it available an excel spreadsheet for people to be able to calculate PC values for free. They will be mostly for swing trading and backtestings, but at least people will be able to use it with any instrument, including those who are not available on Meta Trader platforms.
We hope you enjoy trading with it as much as we do. And since this will probably be the last post of the year, we wish you all happy holidays!
Original post in our website: mononfx.com/blog


