
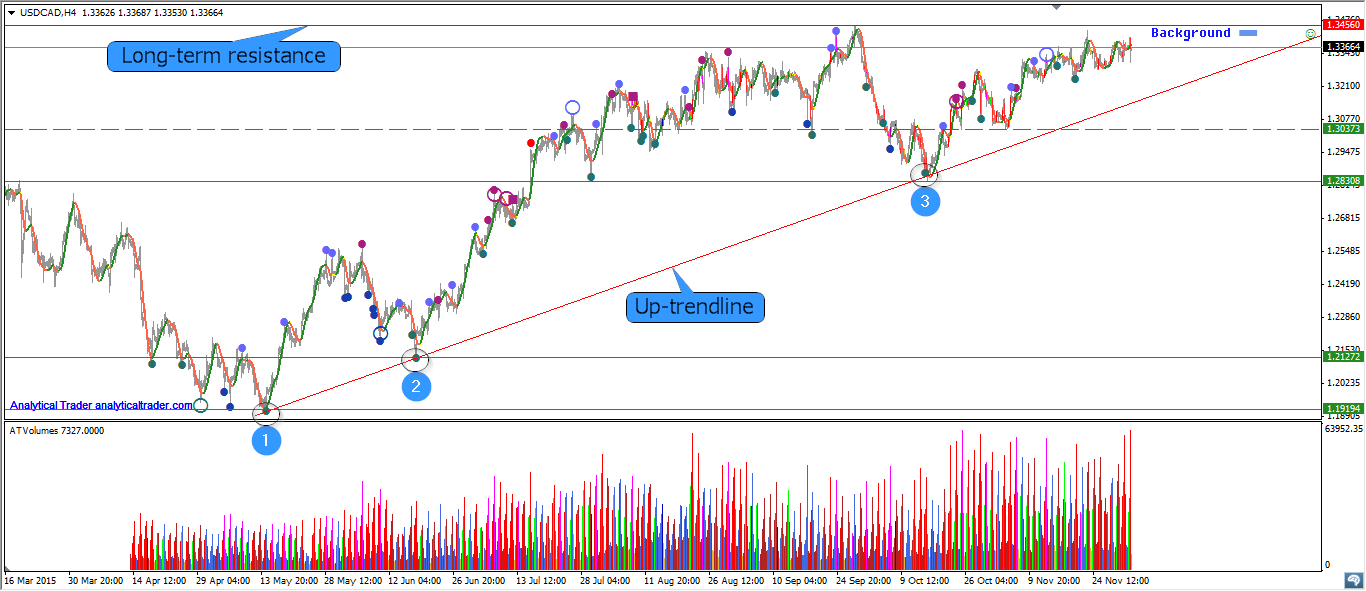
USDCAD was moving upward and it was possible to draw an up-trendline with several touches. After the price approached the point №3, Analytical Trader detected strong signal and the trendline worked as a support for the prices, market changed direction. One more important line in this chart – long-term resistance. Now the price is approaching this level. Better view of this movement can be shown in H1 timeframe.
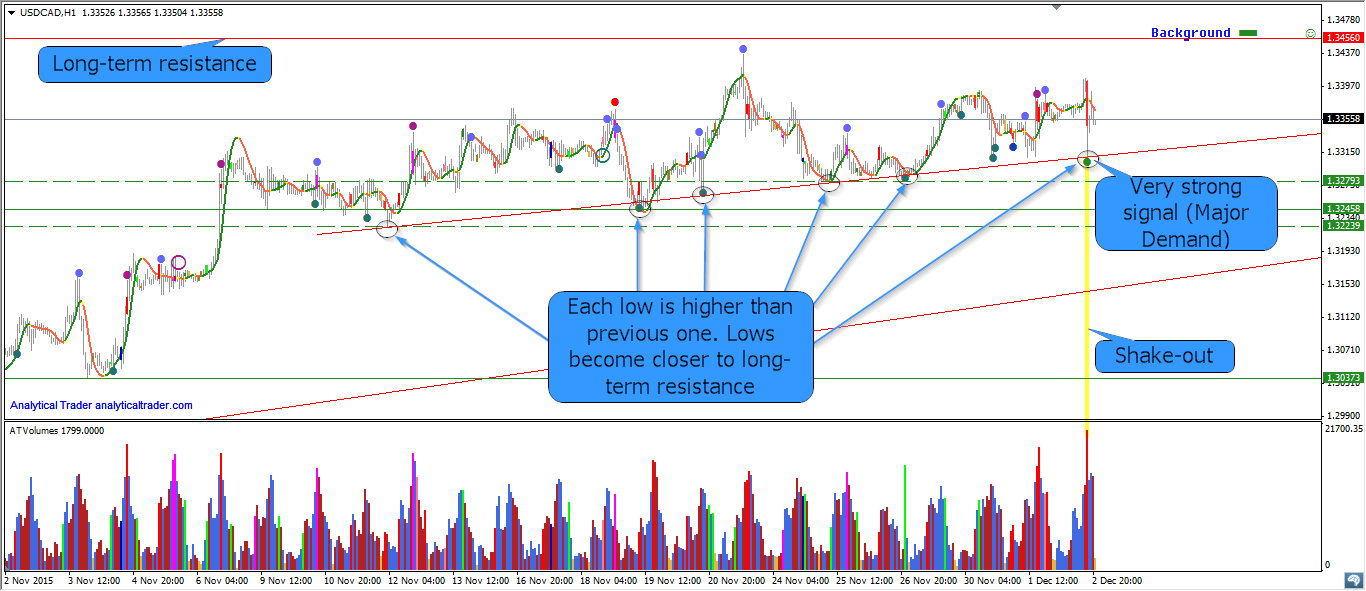
There is one more up-trendline in this timeframe. Each low is higher than previous one, price is approachong long term resistance. Analytical Trader has detected very strong signal (Major Demand). In VSA terms – this bar is a shake-out: wide spread down-bar with high volume. The bar is closed in the middle and it is important to watch next bars. They must be up to confirm that the high activity in this bar was buying from professional traders. You always have to see the whole picture and do not concentrate your attention in a separate bar. Most probably that the price will reach the resistance in our case. In order to understand next movement, we need to asess weak/strong signals, volume, spread of bars near the resistance.


")

