
These two charts prove that the bear market has begun

Today's significant volatility is a result of the world gradually coming to an awareness that global growth will never be the same again. Will a 2008-like crash follow? - many ask.
It won't. But MarketWatch columnist Mark Spano argues we all have to accept
that we are going to have at least a normal bear market. In fact, it has already started. To prove this argument, he shows two charts.
In the S&P 500 chart below, there are the
long-term patterns going back to 1970. The "strategic number" is an
algorithmic measure consisting of multiple factors which measure risk. Risk is very high when it is near 100, and very low when it is close to 0.
In between, risk is about normal, and trend following can be employed. The "strategic risk range" indicates the rough range that the market is likely to be in during the intermediate term.
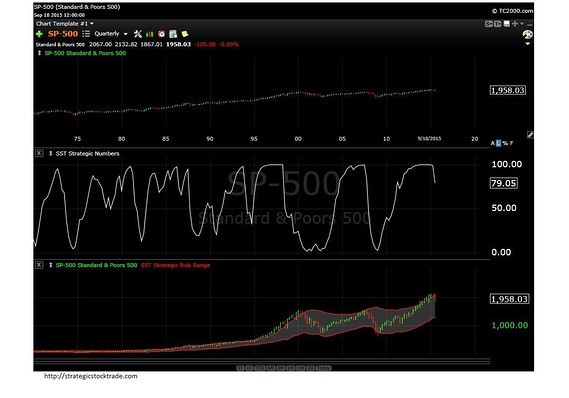
Without renewed buying pressure to push the trend up - unlikely given the risk numbers and new
downward trend - that the market has quite a large potential drop that
it can sustain in coming months or quarters.
The bottom of the range is
around 1200 on the S&P 500 - over a 30% fall from here. Given all
of the recent central banks' and governments' moves, the S&P 500 will hardly drop any deeper than about
1200 and might not quite make it all the way there at all, as there is a
lot of money on the sidelines. However, investors need to learn that this risk exists.
In the Nasdaq chart below, as seen through the Powershares QQQ Trust, you can see that the market is much earlier in the process of a correction, but has begun nonetheless. Here, the data is available only since 1997, so it is possible that the Nasdaq does retest its highs before continuing down. In looking at the risk range, it is vivid that the Nasdaq could be in line for another 40% to 50% correction. It is not for sure, though it is quite possible, Spano says. He does expect a significant correction and if he had to pick a number, he says, he would say about 30% off of its top.
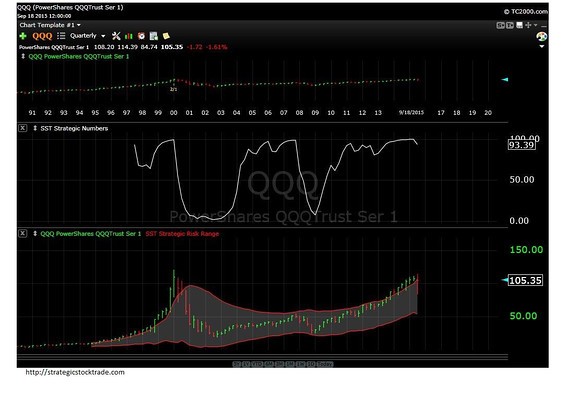
What both charts show is that stock prices have come back into the risk range from the top. That is a signal of a change of trend, if not reversed in short order.
According to Spano, earlier this year we were in the late stage of a cyclical bull market. The markets are finally agreeing and turning the late-cycle bull into an early cycle bear.
And he is confident that nothing like the 2008 crash will follow as there is a difference between bears and collapses. Bears are healthy corrections that refresh the markets and economy with creative destruction. There is no reason to believe that a collapse is unavoidable even if economic woes are vivid.
Going for defense does make sense, regardless of how deep the bear market is. While I know that most people believe in broad diversification, Spano says that it clearly does not work, has never worked and will never work. How good did it feel to be broadly diversified in 2008?
Avoid the worst spots of the economy and go for mild diversification, that is what the analyst advises to do.


