
EURUSD Intra-Day Technical Analysis - bearish breakdown or bullish breakout?
17 September 2015, 10:24

1
1 515
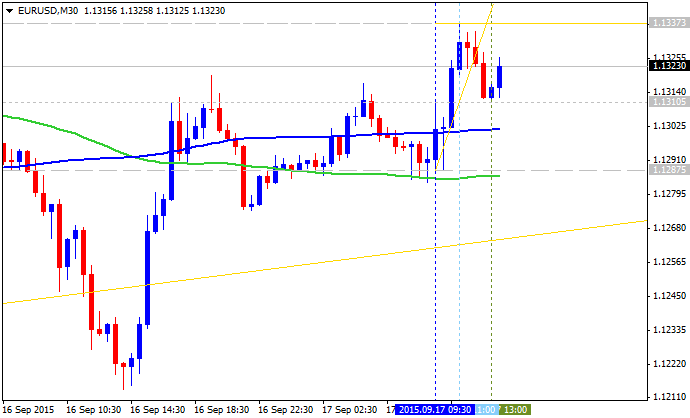
H4 price is located above 100 period SMA (100-SMA) and above 200 period SMA (200-SMA) for the primary bullish market condition for the secondary ranging within the following key levels:
1. Intermediate levels.
- 1.1320 resistance level which is crossed by the price for now from below to above for 1.1379 as the next bullish target;
- 1.1213 support level located between 100-SMA and 200-SMA in the ranging area of the chart between the bearish and bullish condition;
- 1.1121 support level located just below 200-SMA in the bearish area of H4 chart in the beginning of the bearish trend to be started if crossed.
2. Key reversal levels.
- 1.1379 key bullish reversal level located far above 200-SMA in the primary bullish zone; if the price breaks this level from below to above so we may see good bullish breakout;
- 1.1064 key support level located far below 200-SMA in the primary bearish zone; if the price breaks this level from above to below so we may see good bearish breakdown.

| Resistance | Support |
|---|---|
| 1.1320 | 1.1121 |
| 1.1379 | 1.1064 |
- Recommendation for long: watch close H4 price to break 1.1379 for possible buy trade
- Recommendation
to go short: watch H4 price to break 1.1064 support level for possible sell trade
- Trading Summary: ranging
SUMMARY : waiting to break the levels


 & AMD Framework")