
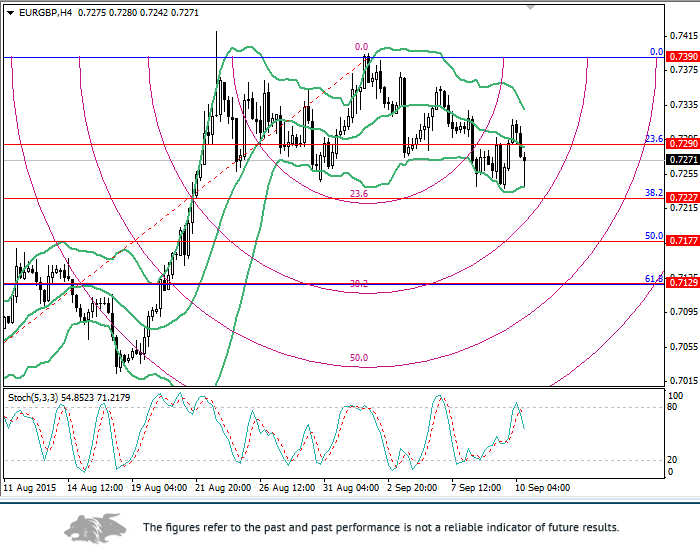
A fall can continue.
On the 4-hour chart, the price broke down the 23.6% Fibonacci correction for the short-term trend (0.7290). At present, the next bearish target seems to be the level of 0.7227 (38.2% Fibonacci crossover with the 38.2% arc), the breakdown of which would allow the pair to fall to 0.7177 (38.2% Fibonacci) and 0.7129. The latter seems to be the strongest level as both the short-term and the medium-term trends corrections (61.8% and 38.2%) remain at 0.7129-0.7133. The breakout of the level of 0.7290 could lead to a growth towards 0.7390.
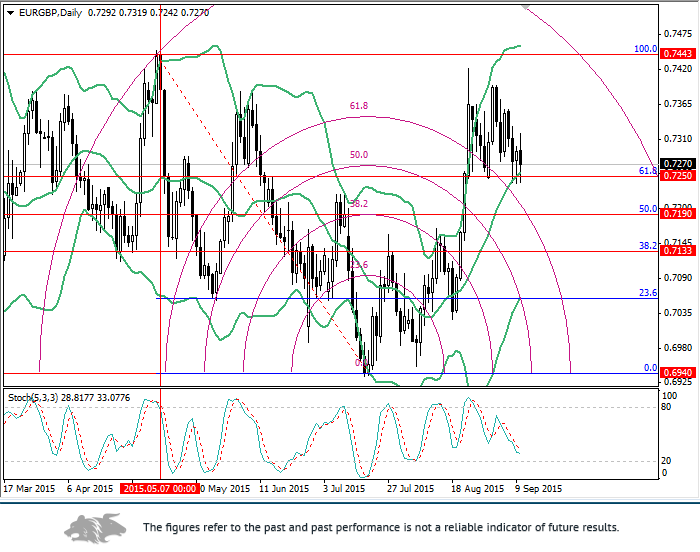
On the daily chart, the price is testing the 61.8% Fibonacci correction (0.7250). Its breakdown would allow the pair to fall to 0.7190 (50.0% Fibonacci) and 0.7133 (38.2% Fibonacci), possibly along the 61.8% arc.
Trading tips
Sell the pair below the level of 0.7227 with targets at 0.7177, 0.7129 and stop-loss at 0.7270.
Alternative scenario
Buy the pair after the price consolidation above the level of 0.7290 with the target at 0.7390 and stop-loss at 0.7240.


")