
Quick Technical Overview - NASDAQ Composite Index: R1 YR1 Pivot breaking for breakout
10 August 2015, 03:11

0
872
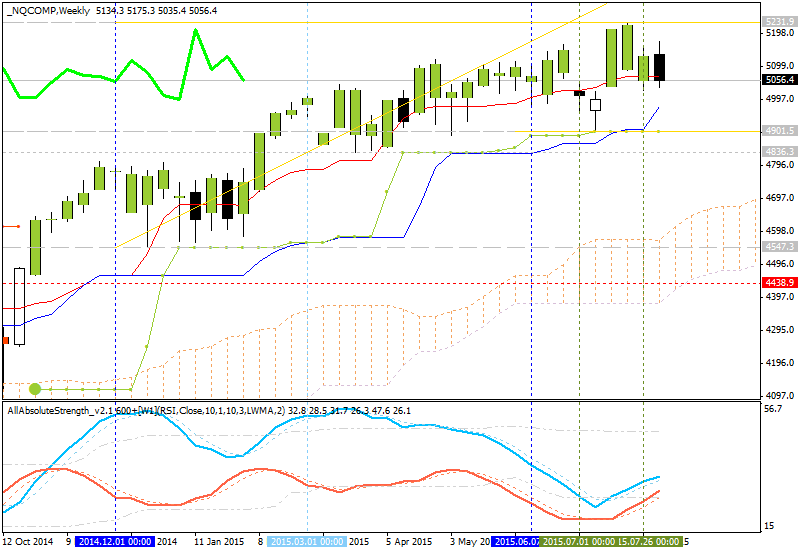
Weekly price is on bullish market condition for ranging between 4901.5
support level and 5231.9 resistance level. The price is breaking R1
YR1 Pivot at 5043 for the next target which will be R2 YR1 Pivot at 5359.
- Chinkou Span line is located to be above the price and indicating the ranging bullish trend to be continuing.
- 'Reversal' Senkou Span A line (which is the virtual border between the primary bullish and the primary bearish on the chart) is located far below the price which makes bearish reversal to be impossible in the near future.
- The nearest resistance level is 5231.9, and the next level is R2 YR1 Pivot at 5359.
- Absolute Strength indicator is estimating the absolute ranging.
- Pivot Points (yearly PP on weekly chart): the price is ranging between Central Pivot at 4494 and R2 YR1 Pivot at 5359.
| Instrument | S1 Pivot | Yearly PP | R1 Pivot | R2 Pivot |
|---|---|---|---|---|
| IXIC |
4178 |
4494 |
5043 | 5359 |
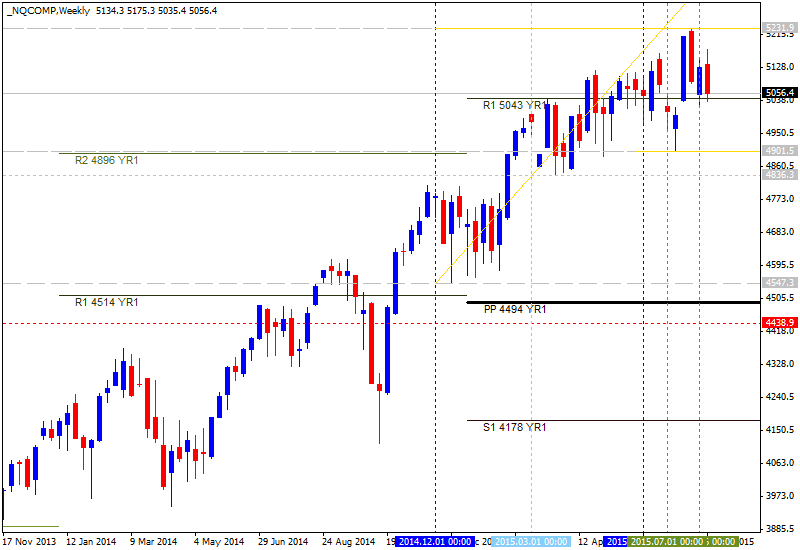
If W1 price will break R1
YR1 Pivot at 5043 on close W1 bar so the primary bullish trend will be continuing with the secondary ranging market condition.
If W1 price will break 5231.9 resistance level so the bullish trend will be
continuing with good breakout possibilities in the near future up to R2 YR1 Pivot at 5359 as the next target.
If not so the price will be ranging between the levels.
Trend:


")
![[XAUUSD]: Weekly Liquidity Activation Points (timings), June 22-26, 2026](https://c.mql5.com/6/1013/splash-preview-771790.png "[XAUUSD]: Weekly Liquidity Activation Points (timings), June 22-26, 2026")
")