
Technical Analysis for EURUSD, GBPUSD, AUDUSD, NZDUSD, USDJPY, USDCAD and USDCHF
6 October 2014, 12:11

0
364
EUR/USD
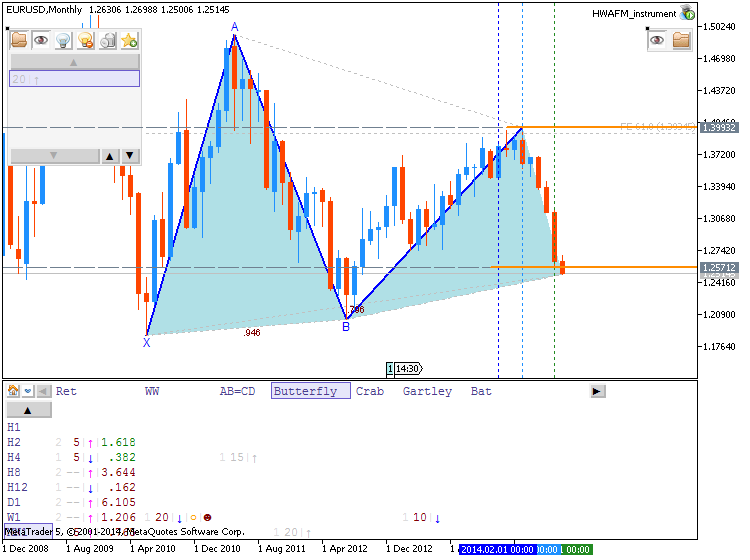
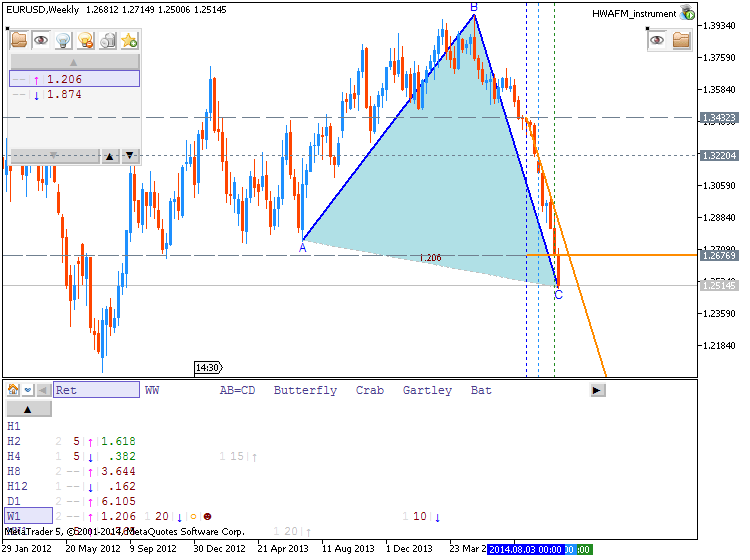
- In keeping with the 3 year cycle tops (2008, 2011, and 2014), EURUSD has collapsed. Of course, every level that I had suspected would provide support for at least a bounce of several days has failed spectacularly. While the long term wave count points below 1.1875 (and much lower), one cannot ignore how extreme the current situation is and how long that extreme has been in place.
- Since the inception of the EURUSD, the rate had declined for 8 consecutive weeks once (March 2010). That resolved with a nearly 400 pip bounce before continued weakness. This week marks the 12th consecutive decline. Weekly RSI is at its lowest level ever. The prior RSI low registered in May 2010.
GBP/USD
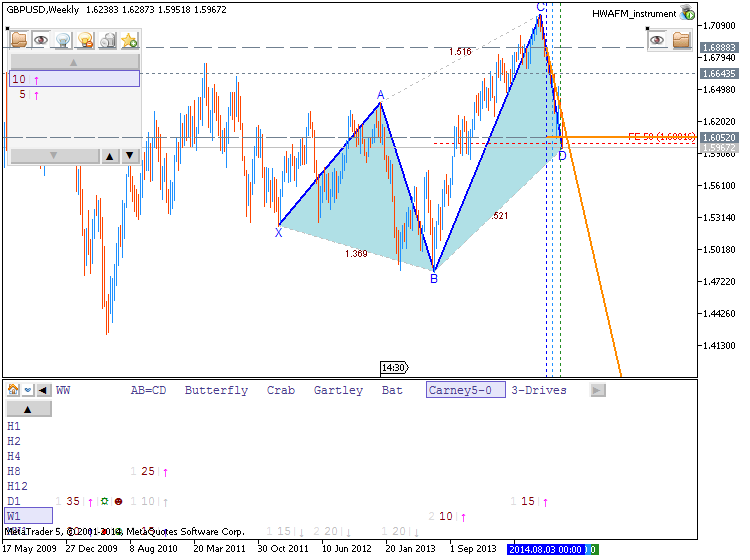
- GBPUSD has retraced half of the rally from the 2013 low and then some. The top side of the line that extends off of the 2011 and 2013 highs is a level to keep in mind but the next major support level is the November low at 1.5853, followed by the June 2013 high and 61.8% retracement at 1.5720/50. 1.6150-1.6224 is resistance.
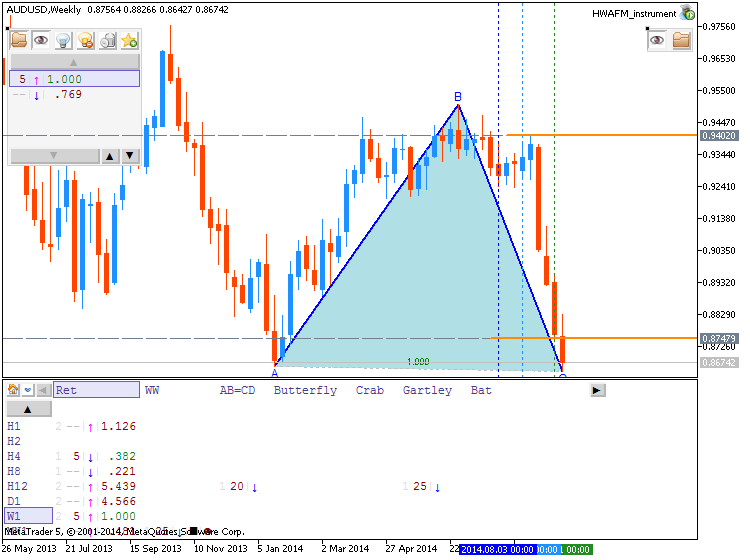
- “The combination of the .9400 figure and weekly RSI failing near 60 indicates a lot of overhead to punch through. Since the 2011 top, each RSI failure near 60 has led to a top or topping process (range for several weeks then a breakdown...that may be the case now).”
- “Don’t forget about the line that extends off of the 1996 and 2007 highs. That line crosses through the 2008, 2011, and highs as well. In 2011 (record free float high), the rate surged through the line in late July before topping on August 1st. The rate reversed this week from pips below the record high and above the mentioned line.”
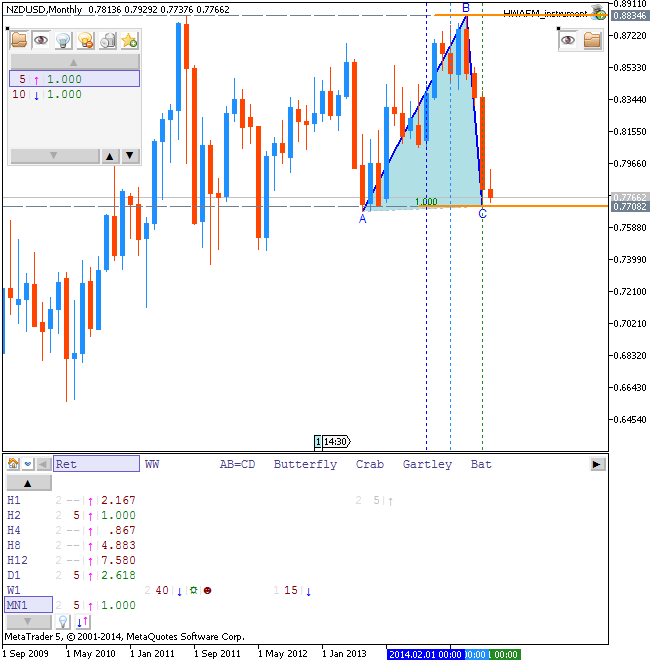
- “Above .8534 is needed in order to suggest that at least a minor low is in place. Look lower as long as price is below that level.” The pivot can be lowered to .8169. The February low is now resistance at .8050. The gap from Labor Day 2013 has held as support so far at .7720 but weakness below opens up the October 2009 high at .7634. Ultimately, weakness below .7370 would confirm a double top with an objective of .5898.
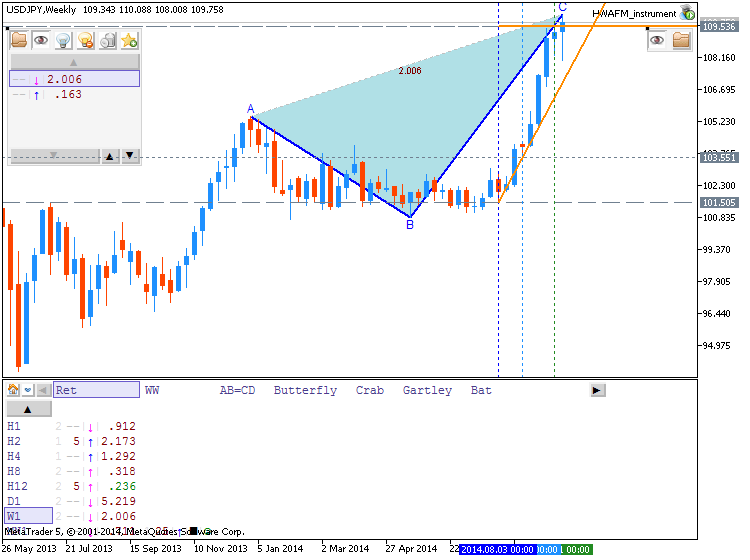
- “Treat wave 4 as complete as long as price is above 102.50 (103.00/30 is support). That means new highs in wave 5 (then risk of a major decline but don’t forget that ‘5ths’ can extend). 104.75 is a near term target.”
- “Focus is now on expansion targets at 108.33 and 110.12 as long as price is above 103.50.” The first target has already been reached. The latter level isn’t far from the August 2008 high at 110.65. There is also a trendline that extends from the 2001 and 2007 highs at the current level. 106.80-107.40 is support. At this point, USDJPY would have to break 105 to do real damage to the trend.
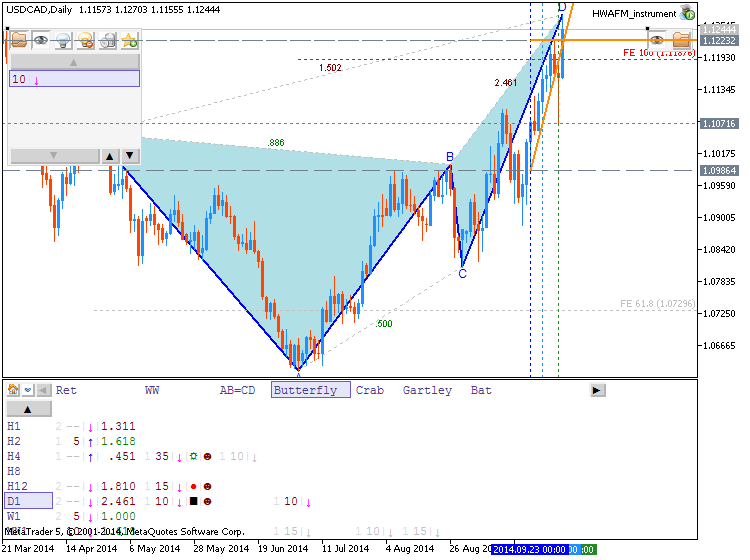
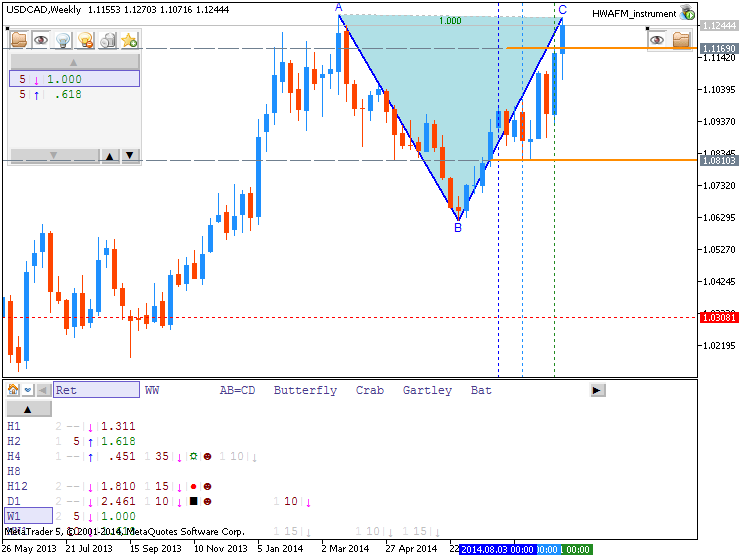
- “USDCAD has fallen apart which ironically means it is probably going to find some sort of low soon. The rate is nearing important price levels. The 2011 high at 1.0657 and current year open at 1.0634 are possible supports. The line that extends off of the 2012 and September 2013 lows is at about 1.0607 next week. This level is in line with the July 2013 high at 1.0608.” USDCAD ended up finding low at 1.0620.
- The USDCAD dip from 1.0997 found support at the 50% retracement of the 1.0620-1.0997 advance (the 61.8% is at 1.0764). The hold is a positive sign and I lean towards the upside until at least 1.1720-1.1875.
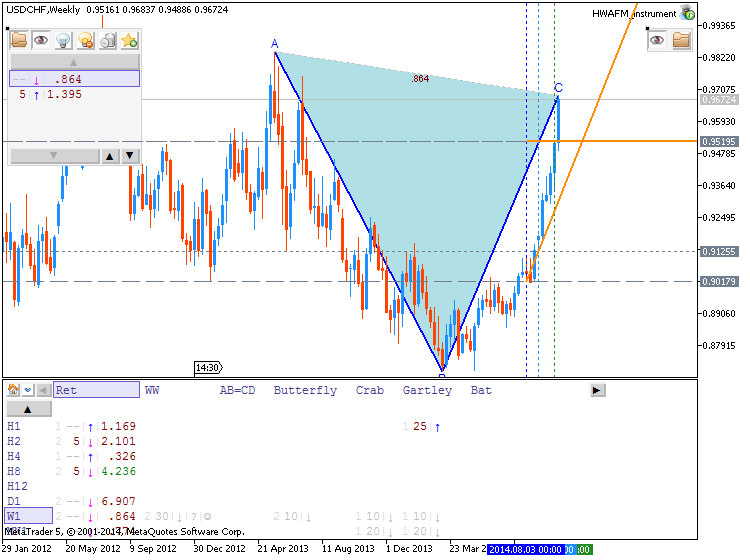
- USDCHF has blown through the 61.8% retracement of the decline from the 2012 high and the 2008 low at .9645 hasn’t influenced either. The July 2013 high at .9750 is in line with the close of the week that produced the 2012 high at .9742. Focus on this zone for resistance.


")
