
Chart Patterns Digest for Head and Shoulders: The Theory, HowTo, Video Manuals and Book to Read

Some call it head and shoulders pattern and others call it king's crown. Whatever the name may be this candlestick pattern is a very significant bearish reversal pattern.
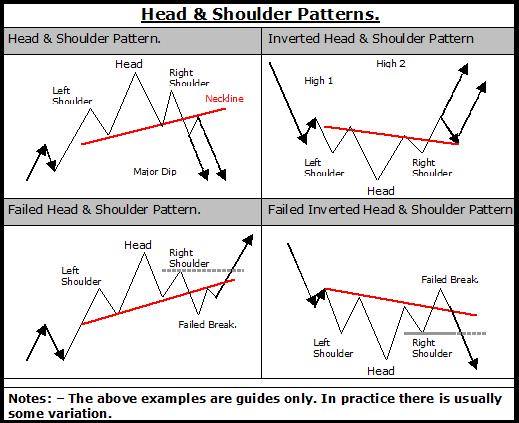
In the figure below, consider an uptrend represented by a solid line that passes through points 1, 3, 5.

An uptrend swing 1-2-3, 3-4-5, and 4-5-6 is well intact with higher highs at points 2, 4, 6 and higher lows at points 1, 3, 5.
Now consider the swing A-B-C
The corrective dip from high point A is well expected as a reaction. But
it is also expected for the dip to pause at around the trendline level.
Should the uptrend continue, the price should bounce off the trendline
and move higher on the north side since the trendline should act as
a support. However, the trendline gets violated and the price slides further down
to point B. This raises yellow flag of caution that potentially trend
reversal is in progress.
Next consider the swing B-C
The price bounces off and moves higher from point B to C. At point C the
price rendezvous the previous trendline which now becomes the
resistance level. For the uptrend to continue the market must shoot
higher beyond point C and beyond point A to make new higher high.
However, the market fails to make higher move byeond point C. This
should be sufficient reason to liquidate all long positions.
Finally consider the swing C-D-E
The price slides down after hitting resistance line at point C and dips
below to point D resulting in breaking of a neck line represented by the
dotted
line 5-B-E. The breaking of the neckline completes the formation of head
and shoulders pattern. Usually the price traces an upward return move to point E from point D
just to rendezvous the previous neck line which now acts as a resistance
line. This point E could potentially become the point to initiate short
positions. By the completion of downward swing C-D-E, the price has penetrated the
trendline and completed the requirement for down trend with lower
lows at point B and D and lower highs at point C and E.
2. THE BOOK
Trading Classic Chart Patterns
by Thomas Bulkowski


Use popular chart patterns profitably
In his follow-up to the well-received Encyclopedia of Chart Patterns,
Thomas Bulkowski gives traders a practical game plan to capitalize on
established chart patterns. Written for the novice investor but with
techniques for the professional, Trading Classic Chart Patterns includes
easy-to-use performance tables, vivid case studies, and a scoring
system that makes trading chart patterns simple. This comprehensive
guide skillfully gives investors straightforward solutions to profitably
trading chart patterns. Trading Classic Chart Patterns also serves as a
handy reference guide for favorite chart patterns, including broadening
tops, head-and-shoulders, rectangles, triangles, and double and triple
bottoms. Filled with numerous techniques, strategies, and insights,
Trading Classic Chart Patterns fits perfectly into any pattern trader's
arsenal.
Thomas N. Bulkowski (Keller, TX), an active investor since 1981, is the
author of the highly acclaimed Encyclopedia of Chart Patterns as well as
numerous articles for Technical Analysis of Stocks & Commodities.
Trained as a computer engineer, Bulkowski worked for over a decade at
Tandy Corporation. Prior to that, he worked on the Patriot air defense
system for Raytheon.
New technology and the advent of around the clock trading have opened
the floodgates to both foreign and domestic markets. Traders need the
wisdom of industry veterans and the vision of innovators in today's
volatile financial marketplace. The Wiley Trading series features books
by traders who have survived the market's ever changing temperament and
have prospered-some by reinventing systems, others by getting back to
basics. Whether a novice trader, professional or somewhere in-between,
these books will provide the advice and strategies needed to prosper
today and well into the future.
3. THE VIDEO
How to Trade the Head and Shoulders Pattern Part 1
The lesson on charting patterns which looks at the head
and shoulders pattern and how traders use this in the stock market,
forex market, and futures market.
How to Trade the Head and Shoulders Pattern Part 2
The lesson on charting patterns which looks at how to
trade the head and shoulders pattern and the reverse had and shoulders
pattern for daytraders in the stock market, futures market, and forex
market.


