

The falling wedge pattern is characterized by a chart pattern which forms when the market makes lower lows and lower highs with a contracting range. When you find this pattern in a downtrend it is considered a reversal pattern as the contraction of the range indicates the downtrend is loosing steam.
The Rising Wedge:
The rising wedge pattern is characterized by a chart pattern which forms when the market makes higher highs and higher lows with a contracting range. When you find this pattern in an uptrend it is considered a reversal pattern as the contraction of the range indicates that the uptrend is loosing steam.

When a falling wedge appears in an uptrend, this is seen as a potential
continuation pattern. As this is the case when traders see this pattern
occur in an uptrend in the forex, futures, or stock market, they will
commonly look to trade in the direction of the prevailing trend. The
buy point they will use here as well is the breakpoint of the upper
resistance line as this is seen as a potential confirmation of the
continuation of the prevailing uptrend. The target for the trade is
then calculated by measuring the distance from the highest peak on the
pattern to the lowest trough, projected upward from the breakpoint.
Lastly, the stop loss is placed just below the outside of the wedge
pattern.
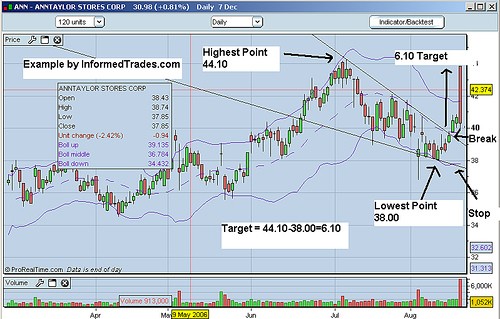
When a rising wedge
appears in an uptrend this is considered a reversal pattern. As this
is the case when traders see this pattern occur in an uptrend, they will
commonly position to trade the reversal of that uptrend by looking for
selling. The sell point they will commonly use is the breakpoint of the
bottom support line as this is seen as confirmation the uptrend is
reversing. The target for the trade is then calculated by measuring the
distance from the lowest trough on the pattern to the highest peak,
projected downward from the breakpoint. Lastly, the stop loss is then
placed just above the outside of the wedge pattern.

When a rising wedge appears in a down trend in the forex, futures, or
stock market, it is considered a continuation pattern. As this is the
case when traders see this pattern occur in a downtrend they will
commonly look to trade the continuation of that downtrend by looking for
selling opportunities on the break of the lower support line. The
target for the trade is then calculated by measuring the distance from
the lowest trough on the pattern to the highest peak, projected downward
from the breakpoint. Lastly, the stop loss for this strategy is then
placed just above the outside of the wedge pattern.


")
![[XAUUSD]: Weekly Liquidity Activation Points (timings), June 22-26, 2026](https://c.mql5.com/6/1013/splash-preview-771790.png "[XAUUSD]: Weekly Liquidity Activation Points (timings), June 22-26, 2026")
")