"Synchronize your watches. The future’s coming back..."
This is the third post in the series about future prediction on the markets. In the first two posts several relevant indicators were described (you may find details in the Part I and Part II). This time the story is about yet another indicator which may be useful for the topic. And it should not be a surprise that the underlying methods are still statistical.
First let us consider the WPR (Williams Percent Range) indicator. I'm sure everyone is familiar with it, but in case you don't - here is its description and source code.
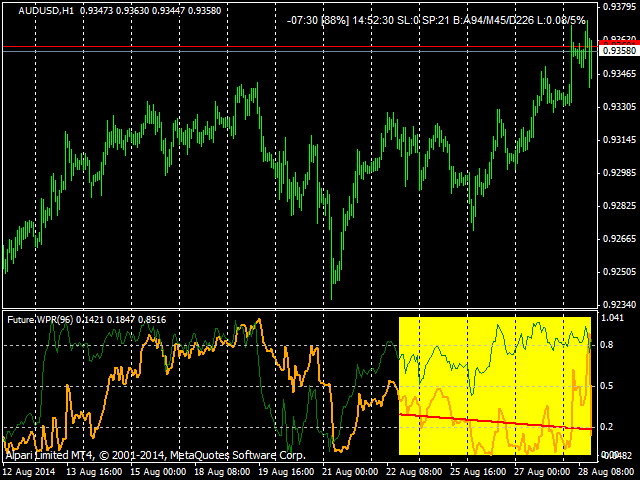
Basically it shows "overbought" or "oversold" states calculated from highs and lows of quotes in the past. What if the same WPR algorithm would be applied in reverse direction for quotes in the future? Of course, it's impossible in real time, but it can be easily done on the history, where the "relative future" is "already" known. You may have a look at the screenshot below with
FutureWPR indicator.
Future WPR (or, alternatively, backward WPR - because of its calculation from the right to the left) is shown in orange. Conventional WPR is shown in green for reference. Both are normalized into [0, 1] region for convenience. You may notice that Future WPR does always give correct signals about market state. This is because it "knows" the future. Now the question is how to obtain this "knowledge" in real time?
The answer is to use statistics from available history, which bind values of conventional WPR and future WPR. For every point in the history, where bar number is larger than WPR period, one can calculate both indicators and register combination of their values in an array of counters. This array accumulates data about all combinations in the history. Then we can repeat the process for different periods of WPR, and finally get an overall probability of possible levels of future WPRs for given latest levels of conventional WPRs.
This is implemented in the following indicator -
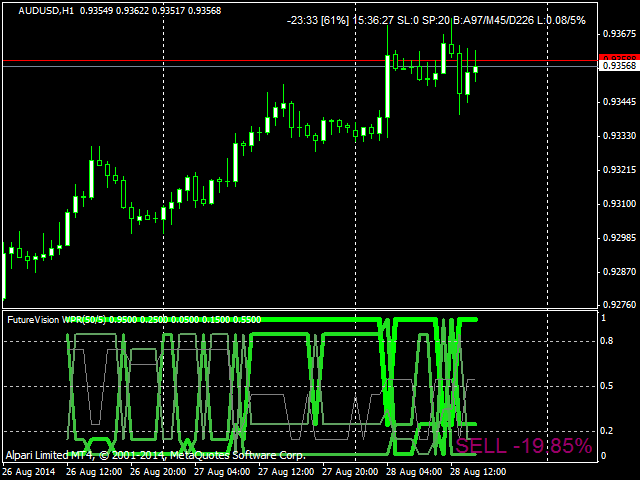
FutureVisionByWPR. The result is shown below:
This is a prediction of the backward WPR on last N bars, where N is the least WPR period used. The width of a line corresponds to importance of its level. As you see, most probable levels are spread across the range of values, jumping up and down according to supposed price movements. As usual upper levels signal to sell and lower levels signal to buy. And current state of levels is on the latest 0-th bar. The indicator compares density of the levels above and below the middle line and produces an estimation of overall trading signal with direction and strength in percents.
This way anyone can foresee most probable evolution of price in the future, as percent ranges statistics suggest.
Well, this story comes to its end, but the study of market prediction could be continued more and more. Many interesting approaches were left uncovered here and are waiting for their time, appropriate time, in future.


