
In this article I will provide my view on the NZD/USD, EUR/USD and the GBP/CAD. These are the pairs that I am currently interested in or was interested in last week for trading with the Hybrid Grid strategy.
- All trades are based on specific rules according to the FxTaTrader Hybrid Grid strategy.
- All open positions can be viewed by clicking here.
This articles will provide:
- The weekly currency chart for the interesting pairs.
- The daily(timing) chart for the interesting pairs.
- Possible positions for the coming week and positions taken.
- According to the TA Charts, the "Currency score" and the "Ranking & Rating list" the EUR/USD is the best pair to trade followed by the EUR/GBP, USD/JPY and the NZD/USD. The pairs comply to the strategy rules for the FxTaTrader Hybrid Grid strategy.
- These pairs are having a good ranking in the ranking & rating list of resp. 1, 2, 3 and 6. See the Weekly FxTaTrader ranking and rating list.
- Last week (pending) orders were placed for the NZD/USD, EUR/USD and the GBP/CAD. Profit was made on 3 positions and losses on 2 and ending the week higher.
___________________________________________
Open/pending positions of last week
GBP/CAD
The situation compared to last weeks has not changed very much for going long and this pair remains interesting for the Hybrid Grid strategy. Because of the current pull back in the daily chart this pair offers possibilities. Last week (pending) orders were placed for this pair where the GBP is the stronger currency and the CAD is the average performing currency. Profit was made on 2 positions.
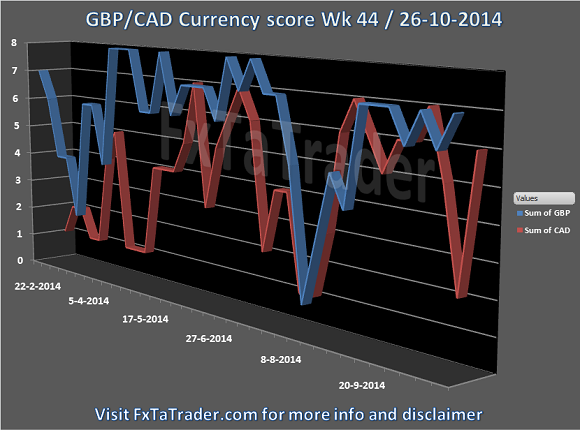
- As can be seen in the Currency Score chart in my previous article of today "Forex Currency Score Wk 44", the CAD is having a score of 5 but it is an average performing currency meaning that this score may be the highest for the time being.
- The rank in the Ranking and Rating list in the last weeks shows also that the pair is attractive for taking long positions. This list is used as additional information besides the Currency score and the Technical analysis charts.
- Besides the general information mentioned the pull back in the specific GBP/CAD pair and the outlook in the TA charts makes it also an attractive opportunity.
The rank in the Ranking and Rating is not in the Top 10 and this is mainly because price is within the Ichimoku cloud in the 4H chart but this seems as temporary for several other technical reasons when looking in more detail at this indicator. The MACD is in negative territory but recovering.
Ranking and rating list Week 44
Rank: 17
Rating: = +
Weekly Currency score: Up
Based on the currency score the pair looks mixed in the last 3 months but the GBP is the stronger currency. The GBP showed 1 dip in that period and recovered fast. The CAD had 2 dips and the last one showed a clear difference in performance of the 2 currencies. From a longer term perspective the CAD is an average performing currency while the GBP is a stronger currency. See for more information my previous article of today "Forex Currency Score Wk 44". Based only on this information the pair looks interesting for going long.
Monthly chart: Up
- On the monthly(context) chart the indicators are looking reasonable for going long.
- The Ichimoku is meeting all the conditions. The Kijun-Sen is however in the cloud so a pull back in that direction can take place. This is however from a longer term perspective.
- The MACD is in positive area but showing consolidation having the histogram weakening.
- The Parabolic SAR is long and showing the preferred pattern of higher stop loss on opening of new long and short positions.
- Since the monthly chart is used to get the context where that pair is in for the long term the indicators are looking fine because they are showing reasonable strength in the current up trend.
Weekly chart: Neutral
- On the weekly(decision) chart the indicators are looking weak for going long but still good enough since the direction is up.
- The Ichimoku is meeting all the conditions but the pull back was significant with price near the bullish cloud.
- The MACD is in positive territory but near the zero line. The histogram is showing that the consolidation period is almost ending.
- The Parabolic SAR is going long but not showing the preferred pattern of lower stop loss on opening of new long and short positions. However the previous switch from short to long and short again was a very short period. It was caused by a 2 days higher price, 4 and 5 August, and without counting this event the preferred pattern looks intact. In essence the preferred pattern is not shown but the reason for not being there is a small one and the PSAR changed last week to long so all in all this indicator looks neutral.
Daily chart: Up
- On the daily(timing) chart the indicators are looking strong for going long.
- The Ichimoku is meeting all the conditions.
- The MACD is in positive territory. The indicator is showing higher bottoms.
- The Parabolic SAR is not going long but showing the preferred pattern of higher stop loss on opening of new long and short positions.
Total outlook: Up
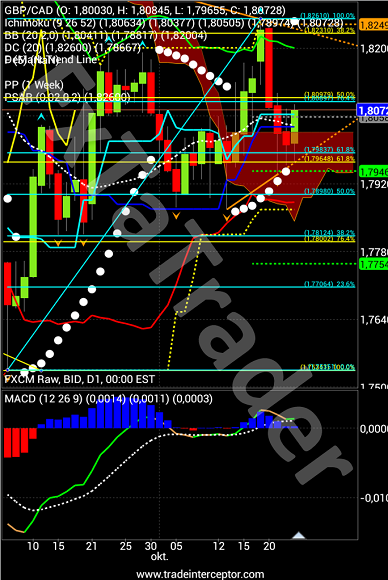
GBP/CAD Daily chart
___________________________________________
EUR/USD
This pair will be discussed briefly in this article because it has been discussed in a previous article in the period of Weeks 41 & 42. The situation has improved compared to last week for taking short positions. The pair is no more oversold according to the FxTaTrader Hybrid strategy rules. According to this a pair is overbought/oversold once it is above/below the Weekly Bollinger Band. The pair is interesting for going short and for the FxTaTrader Hybrid Grid strategy. The monthly and weekly chart remain interesting for going short.
Because of the current pull back in the daily chart this pair offers possibilities. Last week (pending) orders were placed for this pair where the USD is the stronger currency and the EUR the weaker currency. Profit was made on 1 position.
- In the daily chart the Ichimoku remained unchanged and same interesting since the last article on this pair.
- The MACD is now showing some strength building up for going short according to the histogram.
- The Parabolic SAR has improved. It is now going short and showing the preferred pattern of lower stop loss on opening of new long and short positions.
Ranking and rating list Week 44
Rank: 1
Rating: - - -
Total outlook: Down
___________________________________________
NZD/USD
This pair will be discussed briefly in this article because it has been discussed in a previous article in the period of Weeks 42 & 43. The situation has improved compared to last week for taking short positions. The pair is no more oversold according to the FxTaTrader Hybrid strategy rules. According to this a pair is overbought/oversold once it is above/below the Weekly Bollinger Band. The pair is interesting for going short and for the FxTaTrader Hybrid Grid strategy. The monthly and weekly chart remain interesting for going short.
Because of the current pull back in the daily chart this pair offers possibilities. Last week (pending) orders were placed for this pair where the USD is the stronger currency and the NZD the weaker currency. However, the pull back was stronger than expected and the 2 short positions were closed because the stop loss got hit on 21-10-2014 at 06:35 C.E.T. One of the positions was opened just before because the Sell Limit was hit and it remained open for just 50 sec. This was a very unlucky situation where price went up and came back within 1 minute and moved up about 30 pips from being around 0.8000 jumping to 0.8033. The stop loss was set at 0.8035 but it got hit anyway. Although this is unfortunate it can always happen and the alternative of using no stop loss at all is worse. The only thing that can be done about this is trying to time better. Once price is over the last recent top it is best to take short positions, however this is not always easy. Anyway the direction was good and without the stop loss getting hit profit would have been made. Some losses were compensated by going short on the EUR/USD which looked weaker in that period. Also the 2 positions taken in the GBP/CAD made that the week was ended with profit.
The analysis of this pair is almost similar as the EUR/USD and the comment here below is exactly the same.
- In the daily chart the Ichimoku remained unchanged and same interesting since the last article on this pair.
- The MACD is now showing some strength building up for going short according to the histogram.
- The Parabolic SAR has improved. It is now going short and showing the preferred pattern of lower stop loss on opening of new long and short positions.
Ranking and rating list Week 44
Rank: 6
Rating: - -
Total outlook: Down
___________________________________________
Although the explanation may seem simple and clear there is always risk involved. I added a disclaimer to my blog for this purpose. If you like to use this article then mention the source by providing the URL FxTaTrader.com or the direct link to this article. Good luck in the coming week and don't forget to check my weekly Forex "Ranking and Rating list" and the "Currency Score".


")
