
Interaction between MetaTrader 4 and Matlab via DDE

Introduction
I have already published an article about data exchange between MetaTrader 4 and Matlab via CSV files (MT 4 <-CSV->Matlab) here. However, the approach described in the article is, in many cases, unpracticable, and often even unacceptable.
The mechanism of DDE (Dynamic data exchange) supported in MT 4 allows us to transfer data from one application into another directly through the computer's RAM. Matlab has the complete functionality to realize both the front end and the back end of DDE, so we would like to make the best of this opportunity.
MetaTrader 4 DDE server provides only the latest tick data. However, even considering such limitations, DDE is more preferable when, for example, working with quotes inside bars.
Like in the article of "MT 4 <-CSV->Matlab", I will describe the sequence of creating an exchange-organizing tool.
Don't forget to enable DDE server in the Tools -> Options -> Server tab in your MetaTrader 4 Client Terminal, and we can start.
About DDE
So, in the organization of data exchange using DDE, there are two ends (front end and back end) between which the connection will be established. The front end is an application that requests data (Matlab, in our case), the back end is an application that has this data at its disposal (MT 4).
The data can be transferred from the server to the client via DDE in three ways:
- by the client's request,
- by the client's request and after the server has notified that the data has been prepared for transferring, or
- upon the data is ready for transferring.
MetaTrader 4 DDE server works in only one (the third) mode and sends the ready data to the client without waiting for requests, confirmations, and other stuff like that. =) So the task of Matlab is to notify MT 4 that it has a client, inform about what data is needed, and wait until the data arrives.
As soon as the data arrives, we will just show it in a graph.
Creating a GUI
In the Matlab environment, there is a possibility to create a graphical user interface (GUI). Once having created a GUI, we will combine in it all controls, price charts and textual information that we think to be necessary to display.
Creating a GUI is described in more details in section 3 of article “MT4 <-CSV->Matlab”, so I will only mention here the console command named “guide” that launches the GUI Creation Wizard, and also I will give the list of graphical objects we need.
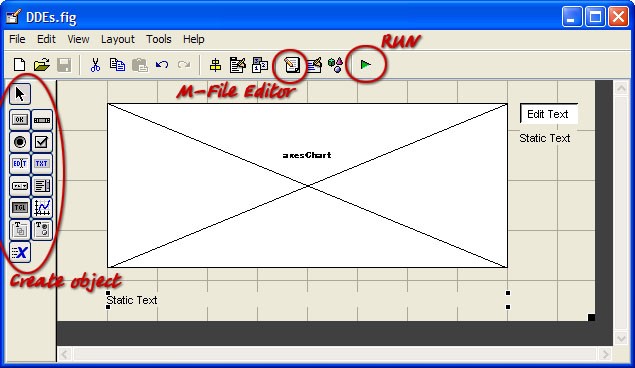
Thus, we need the following:
- input box “Edit Text” to enter the currency pair name;
- “Axes” to display the chart;
- two text output fields “Static Text” to display the precise value of the last quote, or for something else.
It is shown below how I have placed the objects in a GUI sheet:
You should set graphical object properties as follows:
For Axes:
Tag = axesChart (we will display the chart here);
Box = on – enclose the chart area in a full rectangle, off – encloses the chart area with a left line and a bottom line;
FontSize = 7 (the default size is just huge);
Units = pixels (we will need this at charting to set the scale of 1:1).
For EditText:
Tag = editPair (we will enter the currency pair name in this field).
For StaticText below the EditText field:
Tag = textBid (we will enter the precise value of the last quote here);
HorizontalAlignment = left (this is not very important, you may leave it as 'center').
For StaticText at the very bottom of the sheet:
Tag = textInfo;
HorizontalAlignment = left.
Now we can press RUN.
I named my project "DDEs", so if you want that your version does not have any discrepancies with mine, please name your project the same.
If the appearance of your GUI suits you and the m-file is ready for editing, let's start creating a DDE client.
Connection Initializing
First of all, you should organize the channel to connect to the server when launching GUI, and take care of connection breaks when closing the interface.
In Matlab, DDE connection is initialized by the function: channel = ddeinit('service','topic'),
where:
‘service’ – DDE server name (‘MT4’)
'topic’ – name of a data section. In our case, it can takes the values of 'BID', ‘ASK’, ‘QUOTE’, etc.
The function returns the descriptor of the initialized channel. This descriptor will be used for further conversations with DDE server.
You should also specify the exchange method. In Matlab, the exchange method supported by MT4 is called “Advisory link” and initialized by the function: rc = ddeadv(channel,'item','callback','upmtx',format);,
where:
channel – descriptor of the initialized channel,
‘item’ – data we are interested in, i.e., the symbol name of a currency pair,
'callback' – a line to be executed upon arrival of data from the server,
'upmtx' – symbol name of the variable to place the data received from the server,
format – array of two flags, which defines the format of data sent.
Function ddeadv returns “1” if successful; otherwise, it returns “0”.
Please not that a symbol expression is given as the ‘callback’ parameter, not a function descriptor. In fact, we will execute the “eval” function that executes the line as if it has been typed in a console. This feature produces the following difficulty: At arrival of a new quote, we have to execute a large function receiving the new quote. At the same time, we would like to pass to this function the “handles” descriptors structure that will be used to get access to GUI graphical objects. However, I found neither any methods of passing the handles structure descriptor into executable line nor the way to call the function located in the m-file that describes GUI.
All this resulted in that I had had to place the new quote receiving function into a separate m-file and call it as a normal Matlab function. However, the inconvenience turned out to be an advantage after I had discovered that I could edit the processing function without interrupting the DDE client operations.
Thus, first of all, let's create a separate processing function that will just display the received data into console.
function newTick(simbols)
% new tick processing
disp(simbols); % display the argument in console
song = wavread('C:\WINDOWS\Media\Windows XP - launch.wav'); % read the sound
wavplay(song,40000); % play the sound with the sampling rate of 40 kHz
The exemplary function above will also play the 'C:\WINDOWS\Media\Windows XP - launch.wav' file as soon as a new quote arrives. Save the function text as newTick.m in the working directory of MATLAB.
Now let's edit the m-file describing the behavior of our GUI. Add the connection initialization to the DDEs_OpeningFcn function, and deinitialization will be added to the figure1_CloseRequestFcn function.
(To add the CloseRequestFcn function to the m-file, you should execute the following in GUI editor: View -> View Callbacks -> CloseRequestFcn).
% --- Executes just before DDEs is made visible.
function DDEs_OpeningFcn(hObject, eventdata, handles, varargin)
% This function has no output args, see OutputFcn.
% hObject handle to figure
% eventdata reserved - to be defined in a future version of MATLAB
% handles structure with handles and user data (see GUIDATA)
% varargin command line arguments to DDEs (see VARARGIN)
channel = ddeinit('MT4','QUOTE'); % initialization
pair = get(handles.editPair,'UserData'); % read the symbol name
rc = ddeadv(channel, pair,'newTick(x)','x',[1 1]); % establish connection
if (rc==1) % if the connection has been established,
disp('Connected'); % inform the console
end
handles.chann = channel; % save the channel ID in handles
% Choose default command line output for DDEs
handles.output = hObject;
% Update handles structure
guidata(hObject, handles);
% UIWAIT makes DDEs wait for user response (see UIRESUME)
% uiwait(handles.figure1);
% --- Executes when user attempts to close figure1.
function figure1_CloseRequestFcn(hObject, eventdata, handles)
% hObject handle to figure1 (see GCBO)
% eventdata reserved - to be defined in a future version of MATLAB
% handles structure with handles and user data (see GUIDATA)
channel = handles.chann; % get the channel ID from handles
pair = get(handles.editPair,'UserData'); % read the symbol name
ddeunadv(channel,pair); % disconnect
rc = ddeterm(channel); % deinitialization
if (rc==1) % if everything is OK
disp('Disconnected'); % inform the console
end
% Hint: delete(hObject) closes the figure
delete(hObject);
% --- Executes during object creation, after setting all properties.
function editPair_CreateFcn(hObject, eventdata, handles)
% hObject handle to editPair (see GCBO)
% eventdata reserved - to be defined in a future version of MATLAB
% handles empty - handles not created until after all CreateFcns called
set(hObject, 'String', 'EURUSD'); % Enter the symbol name in the input field
set(hObject, 'UserData', 'EURUSD'); % In the UserData of the input field - save
% Hint: edit controls usually have a white background on Windows.
% See ISPC and COMPUTER.
if ispc && isequal(get(hObject,'BackgroundColor'), get(0,'defaultUicontrolBackgroundColor'))
set(hObject,'BackgroundColor','white');
end
I have given above the full texts of modify functions together with the text prepared for empty skeleton functions by the Matlab developers.
The last block enters the symbol name in the corresponding field before the GUI is launched. The entry will be copied to the 'UserData' property. We will always use the copy in 'UserData', whereas we will only use the name displayed in the field ('String') if the user tries to change the security. If the user has been mistaken when typing and a wrong name has been written in 'String', we will return to the name stored in 'UserData'.
The code below realizes the function of the user's symbol name changing:
function editPair_Callback(hObject, eventdata, handles)
% hObject handle to editPair (see GCBO)
% eventdata reserved - to be defined in a future version of MATLAB
% handles structure with handles and user data (see GUIDATA)
oldPair = get(hObject,'UserData'); % previous symbol name
newPair = get(hObject,'String'); % new symbol name
channel = handles.chann; % get the channel ID
disconn = ddeunadv(channel,oldPair); % disconnect
if (disconn==0) % if you fail to disconnect
set(hObject,'String',oldPair); % restore the old symbol name in the input field
else % if diconnected
conn = ddeadv(channel, newPair,'newTick(x)','x',[1 1]); % establish a new connection
if (conn==1) % if the connection is established
set(hObject,'UserData',newPair); % memorize what symbol is used
else % if you fail to establish a new connection
ddeadv(channel, oldPair,'newTick(x)','x',[1 1]); % restore the old one
set(hObject,'String',oldPair); % restore the old symbol name in the input field
end
end
% Hints: get(hObject,'String') returns contents of editPair as text
% str2double(get(hObject,'String')) returns contents of editPair as a double
Receiving Ticks
Consider that the connection is established and, at arrival of a new tick, the "newTick(x)" function is called that "seals" the argument received from MT 4 into a console. First, let's display the last received quote in the corresponding line of our GUI.
For this, we must have a structure of GUI graphical objects descriptors - handles are at the disposal of the "newTick" function. Let's use the setappdata(h,name,value) function that saves the data to the application domain. Specify "0" as the application ID. It is the descriptor of the Matlab object 'root', it is invariant, so we can always know it.
Add the line of "setappdata(0,'hndls',handles);" immediately after the heading of the "DDEs_OpeningFcn" function:
function DDEs_OpeningFcn(hObject, eventdata, handles, varargin)
setappdata(0,'hndls',handles); %
Now, in function "newTick", we can extract the handles by the function of value = getappdata(h,name), having specified "0" as the argument of "h". Then we will be able to manage the GUI objects from the "newTick" function.
Then we transform the string argument passed to the function from the DDE server and display the value of Bid in GUI. Besides, we detect the local time of receiving the quote and display it, as well, but in the GUI status bar. Local time is necessary, since DDE server passes the time with accuracy up to minutes, which is unacceptable for working with ticks. The 'now' function returns the local time with accuracy up to fractions of a millisecond, so we will not be worried about that different ticks will have the same time fixed. We will also extract the server time from the line received from DDE server and transform into the Matlab time format.
Below is one more example of the "newTick" function:
function newTick(simbols)
% NEW TICK PROCESSING
timeLocal = now; % Detect the exact local time
handles = getappdata(0,'hndls'); % Receive handles from root
% disp(simbols); % put the argument into console (commented)
song = wavread('C:\WINDOWS\Media\Windows XP - launch.wav'); %read the sound
wavplay(song,40000); % play the sound with the sampling rate of 40 kHz
set(handles.textInfo,'String', datestr(timeLocal)); % show the local time in GUI
% --- transforming the line received from MT 4 ---
parts = sscanf(simbols, '%i/%i/%i %i:%i %f %f' ); % studying the line according
%to the format: int/int/int int:int float float
timeServerVect = parts(1:5); % extract the time
timeServerVect = timeServerVect'; % transpose (column into line)
timeServerVect = [timeServerVect 00]; % add seconds
timeServer = datenum(timeServerVect); % transform into the Matlab time format
Bid = parts(6); % extract Bid
Ask = parts(7); % extract Ask
% --- end of transforming ---
set(handles.textBid,'String',['Bid: ' num2str(Bid)]); % Show Bid in GUI
Drawing a Tick Chart
Here is the continuation of the "newTick" function that was started above. The code is provided with detailed comments, so, I suppose, it will be no trouble for you to make head or tail of it.
I will only explain that the Bid quotes array, like that of handles, is stored in the 'root' object area, but saved as "data". The data stored represents a structure that consists of two fields:
data.name - symbol name of a currency pair;
data.array - quotes array itself.
In the "newTick" function, this data figures under the name of "ticks", and the fields of the structure have the names of ticks.name and ticks.array, repectively.
ticks.array represents an array consisting of three columns:
- local time in the Matlab time format (with accuracy supported by Matlab [microseconds]);
- server time in the Matlab time format (with accuracy to minutes);
- Bid.
The "newTick" function empties the quotes array, if the symbol name in the "editPair" field has changed and the quotes for another symbol have started to arrive. If that has NOT changed, lines are added to the existing array.
The block of operations with the chart defines the parameters (size and position) of the axesChart window and extracts the window width in pixels from them. This is necessary for the program to set the horizontal scale of the displaying - one quote by one pixel.
If there are fewer quotes than there are pixels in the window width, the chart will be drawn as a whole. If there are more quotes than pixels, then only the latest data that fits in the chart will be displayed.
% --- working with quotes array ---
GUIpairName = get(handles.editPair, 'UserData'); % symbol name
if (~isappdata(0,'data')) % if no data
ticks.name = GUIpairName; % form the name field
ticks.array = []; % form a field - an empty array
setappdata(0,'data',ticks); % write the data into root
end
ticks = getappdata(0,'data'); % extract data
if ~strcmp(ticks.name,GUIpairName) % if the name has changed
ticks.name = GUIpairName; % form the name field
ticks.array = []; % form a field - an empty array
setappdata(0,'data',ticks); % write the data into root
end
ticks.array = [ticks.array; timeLocal timeServer Bid]; % add a line
% containing the new data to the existing data array
setappdata(0,'data',ticks); % write the data into root
% --- end of working with the array ---
% --- working with chart ---
chartSize = get(handles.axesChart,'Position');% get the chart window size
chartSize = chartSize(3); % extract the chart window width
lenArray = size(ticks.array); % get the size of the data array
lenArray = lenArray(1); % extract the amount of lines in the data array
set(handles.axesChart, 'NextPlot','replace'); % drawing mode - replace
% the old chart with a new one
if (chartSize >= lenArray)
stairs(handles.axesChart,ticks.array(:,3)); % draw the whole chart
else
stairs(handles.axesChart,ticks.array(lenArray-chartSize+1:lenArray,3));
% display the latest data fitting into the chart
end
set(handles.axesChart,'XLim',[1 chartSize]); % set the scale - one count
% in one width pixel
set(handles.axesChart, 'NextPlot','add'); % drawing mode - adding
plot(handles.axesChart,[1 chartSize], [Bid Bid],'m');% draw the Bid horizontal
Saving Data in File
The last function to be described is saving tick data in a file by the user's request.
We will save data by pressing a button, so add the "Push Button" object to the GUI form using the editor.
Set the following object properties: Tag = pushSave, String = Save.
Upon pressing the "M-file Editor" button, the template of the pushSave_Callback function will be added to the end of the "DDEs.m" automatically.
Below is the full text of the function that saves the data:
% --- Executes on button press in pushSave.
function pushSave_Callback(hObject, eventdata, handles)
% hObject handle to pushSave (see GCBO)
% eventdata reserved - to be defined in a future version of MATLAB
% handles structure with handles and user data (see GUIDATA)
date = datestr(now,'yyyy-mm-dd'); % get to know the date (string)
time = datestr(now,'HH-MM-SS') % get to know the time (string)
name = get(handles.editPair,'UserData');% get to know the symbol name (string)
template = [name '@' date '@' time]; % form the file name
[userName, userPath] = uiputfile([template '.txt']); % get the name and the path from the user
if userName~=0 % if "Cancel" is not pressed
ticks = getappdata(0,'data'); % get the data from root
timesStr = datestr(ticks.array(:,1)); % form a string array
% of time and date
bidStr = num2str(ticks.array(:,3)); % form string array named BID
delimStr(1:length(bidStr)) =' ' ; % form a "column" separator
% more exactly, form a line that will be transposed into a column
matrix=[timesStr delimStr' bidStr]; % gather write all Str into one matrix
dlmwrite([userPath userName], matrix, '');% save the matrix in a file
end
The function prepares the file name that consists of the date, time and symbol name of the security.
At saving, the symbol matrices are preliminarily prepared:
- timesStr -- local time and date corresponding with the quotes;
- delimStr -- delimiters;
- bidStr -- BID column.
Then they all are united in one matrix.
delimStr represents a line consisting of spaces; the length of the line is equal to the length of the BID column. At merging, the delimStr line is transposed into a column and separates the quotes column from the time.
Conclusion
I hope the method described above will allow you to use the entire abundance of mathematical functions in Matlab for development and testing your automated trading strategies.
Translated from Russian by MetaQuotes Ltd.
Original article: https://www.mql5.com/ru/articles/1528
Warning: All rights to these materials are reserved by MetaQuotes Ltd. Copying or reprinting of these materials in whole or in part is prohibited.
This article was written by a user of the site and reflects their personal views. MetaQuotes Ltd is not responsible for the accuracy of the information presented, nor for any consequences resulting from the use of the solutions, strategies or recommendations described.

 All about Automated Trading Championship: Interviews with the Participants'06
 All about Automated Trading Championship: Statistical Reports
 Trend Lines Indicator Considering T. Demark's Approach
 All about Automated Trading Championship: Registration
- Free trading apps
- Over 8,000 signals for copying
- Economic news for exploring financial markets
You agree to website policy and terms of use
Hello Dmitry,
Congratulations and very thanks for your articles and for sharing with us.
I recentely buy a program named ForexKiller. An exe file that loads from a file (saved from MT4) the last 10 prices and predict the signal to Buy or Sell.
Well, my question is, how may i write an EA to send to ForexKiller las 10 prices every time one bar starts (in one hour chart on MT4)???
And then, how may i access to the signal back to the EA???
Note: I talk in EA but it may be an indicator.
Once agains, thanks for you sharing information we learn a lot from your articles and examples.
Chears,
Jose Costa
>> DDEs
Connected
??? Attempt to reference field of non-structure array.
Error in ==> DDEs>pushSave_Callback at 167
timesStr = datestr(ticks.array(:,1)); % ñôîðìèðîâàòü string-ìàññèâ
Error in ==> gui_mainfcn at 96
feval(varargin{:});
Error in ==> DDEs at 42
gui_mainfcn(gui_State, varargin{:});
??? Error while evaluating uicontrol Callback
Disconnected
>>
channel = ddeinit('MT4','QUOTE'); % initialization
pair = get(handles.editPair,'UserData'); % read the symbol name
rc = ddeadv(channel, pair,'newTick(x)','x',[1 1]); % establish connection
if (rc==1) % if the connection has been established,
disp('Connected'); % inform the console
end
handles.chann = channel; % save the channel ID in handles
Hi, thank you for your guide, I can get the Bid and Ask data through DDE. But how I can get other data? such as close, open, high,...
Dear Dmitry,
Thank you for the great article. But since it is quite old probably something changed. I'm using the following script on matlab:
pair='EURUSD';
channel = ddeinit('MT4','BID'); % initialization
rc = ddeadv(channel, pair,'disp(x)','x',[1 1]);
if (rc==1)
disp('Connected');
end
After using this script i only receive Connected and then nothing. I came to believe that this is some compatibility issue. Might you know anything about it? Currently I'm running Windows 7 with Matlab 7.11.0 and MT4. Sadly, no data is coming :| Any ideas?
Regards,
Sharas