Support Resistance Hi Low
- Indikatoren
- Version: 208.19
- Aktualisiert: 26 August 2019
- Aktivierungen: 5

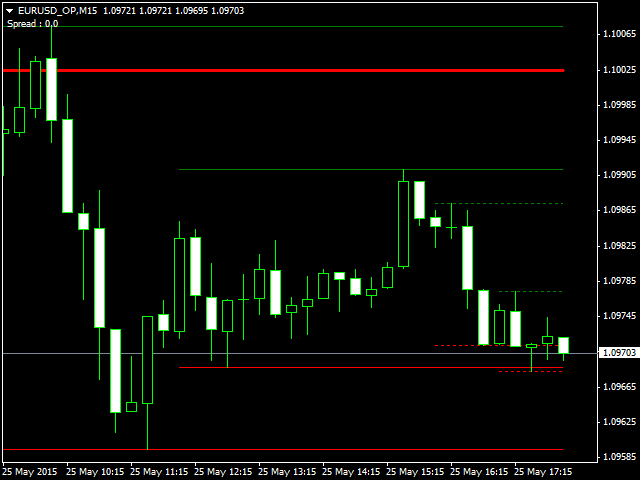
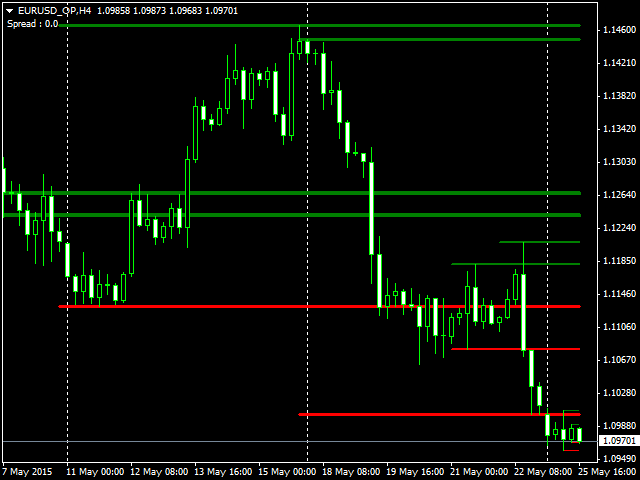
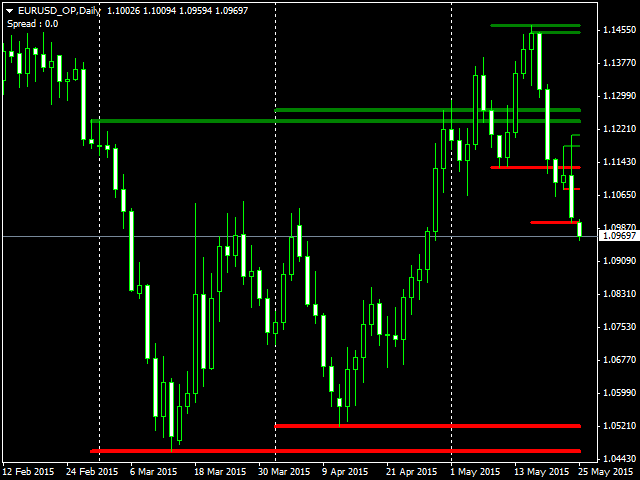
Dieser Indikator zeichnet automatisch Unterstützungs- und Widerstandslinien auf der Grundlage von High und Low Candle in jedem Zeitrahmen.
Unterstützungs- und Widerstandslinien kommen immer wieder vor, wenn ein Händler eine Strategie entwickelt. Aufgrund ihrer Bedeutung ist es für einen Händler oft sinnvoll, Objektmuster zu erstellen, um diese Preise in eine Strategie zu integrieren. Wenn starke Unterstützungs- und Widerstandsniveaus gefunden werden, kann dies Händlern ermöglichen, ihren Ansatz effektiv zu planen, Geschäfte zu verwalten und Risikoniveaus anzupassen.
Berücksichtigung des Volumens
Der Handel auf der Grundlage von Unterstützungs- und Widerstandsniveaus muss natürlich auch das Volumen berücksichtigen, da ein Wertpapier nur dann seine Unterstützungs- und Widerstandsniveaus durchbrechen kann, wenn ein ausreichendes Volumen vorhanden ist. Ein geringes Volumen kann dazu führen, dass Unterstützungs- oder Widerstandstrends lediglich eine Pause einlegen, während ein ausreichendes Volumen eine Umkehr dieser Trends bewirkt.
Die Konzepte der Unterstützung und des Widerstands basieren in der Tat auf Umkehrungen, wobei sich ein Trend an seinem oberen Ende umkehrt, wenn er den Widerstand erreicht; und der Trend kehrt sich an seinem unteren Ende um, wenn er auf seinen Unterstützungsbereich trifft.
Die Psychologie der Unterstützung und des Widerstands
Unterstützungs- und Widerstandsniveaus existieren nur deshalb, weil Händler und Anleger sich an ihre Erfahrungen mit dem Handel eines bestimmten Wertpapiers bei bestimmten Niveaus in der Vergangenheit erinnern. Anleger neigen eher dazu, sich auf demselben Niveau zu engagieren, auf dem eine große Menge von Anlegern die Aktie einst gekauft hat. Händler neigen dazu, die Erwartung zu haben, dass eine Aktie von demselben Niveau wie in der Vergangenheit wieder steigen wird. Selbst wenn diese Händler das Wertpapier in einer früheren Sitzung nicht gehalten haben, werden sie sich an der Geschichte orientieren und frühere Beispiele für Tiefststände und Unterstützungsniveaus untersuchen.
Welches Element der Unterstützung und des Widerstands funktioniert am besten?
Das hängt von Ihrer Strategie ab. Keines der oben genannten Unterstützungs- und Widerstandsniveaus hat eine Vorhersagekraft. Sie stellen lediglich eine Wahrscheinlichkeit dar, die wir erst nach Abschluss des Handels bestimmen können. Aber diese Niveaus können Händlern dabei helfen, ihren Ansatz so zu gestalten, dass sie mit diesen Wahrscheinlichkeiten arbeiten, um das Risiko zu begrenzen und gleichzeitig die Gewinne zu maximieren. Das Herzstück der Strategie ist also immer noch das Risikomanagement, da man nie wissen kann, was die nächste Kerze in einem Chart sein wird.
Die Quintessenz
Unterstützungs- und Widerstandsbereiche sind Schlüsselkonzepte, die Ihre Ausstiegsentscheidungen auf den Punkt bringen werden. Auf den ersten Blick mag die ungenaue Natur von Handelsspannen der Präzision abträglich sein, aber Ihre Trailing-Stops sorgen für einen gewissen Ausgleich dieses potenziellen Problems. Setzen Sie beim Ausstieg aus einer Position immer Trailing Stops ein und passen Sie diese je nach der gewünschten Enge oder Lockerheit Ihrer Ausstiegsstrategie an.

Der Benutzer hat keinen Kommentar hinterlassen