KT Forex Blau Balance MT5
- Indikatoren
-
KEENBASE SOFTWARE SOLUTIONS
 Keenbase Trading entwickelt professionelle MetaTrader 4- und MetaTrader 5-Indikatoren sowie Expert Advisors, die Trader dabei unterstützen, fundiertere Handelsentscheidungen zu treffen.
 - Version: 1.0
Er kann für Währungspaare und andere Märkte verwendet werden, die Ihre MT4- oder MT5-Plattform unterstützt. Sowohl kurzfristige als auch langfristige Trader können von diesem Indikator profitieren.
Wichtigste Merkmale
- Er funktioniert in allen Zeitrahmen und Instrumenten auf MT4 und MT5.
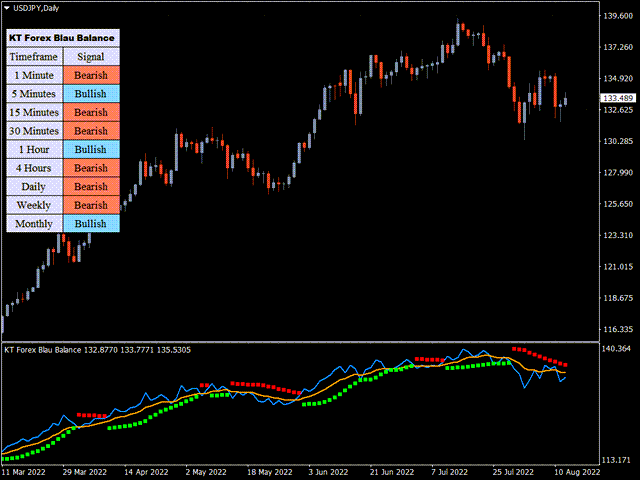
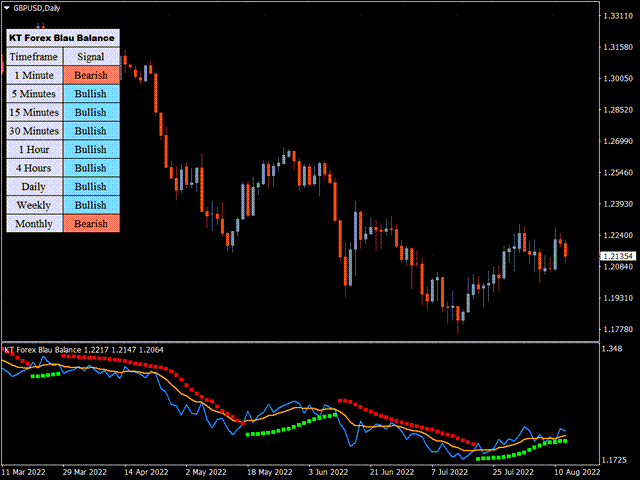
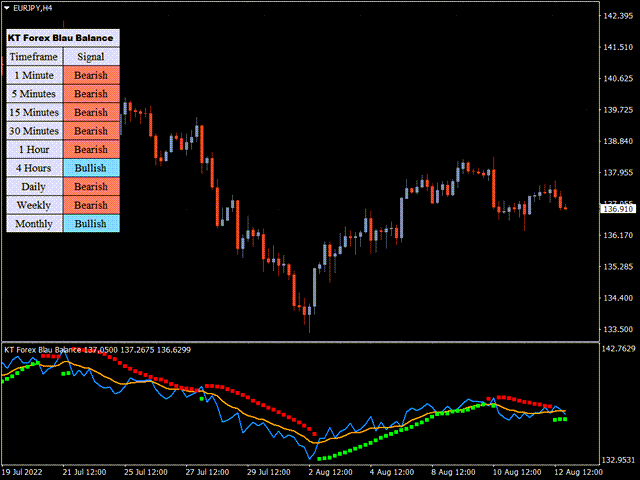
- Er verfügt über einen Multi-Timeframe-Scanner, der über alle Zeitrahmen hinweg nach den nächsten Signalen sucht.
- Sie können dieses Tool in unzählige Handelssysteme einbinden.
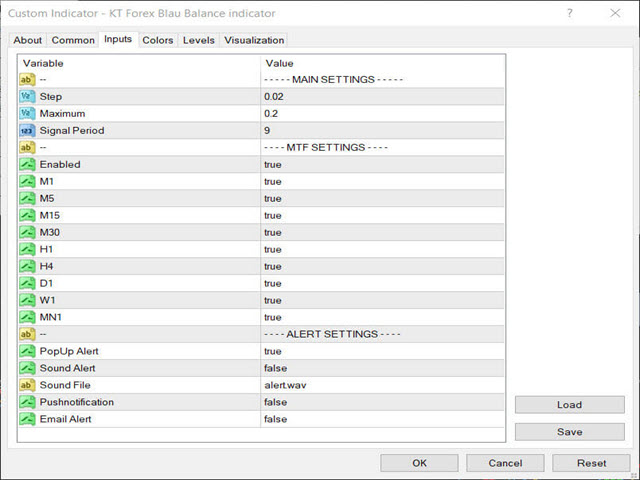
- Der Indikator hat anpassbare Eingabe-, Farb-, Level- und Visualisierungsparameter.
- Der Indikator wird am unteren Rand Ihrer Charts angezeigt.
- Der Forex Blau Balance ist einfach zu bedienen. Wenn grüne Punkte erscheinen, deutet dies auf ein Kaufsignal hin. Wenn rote Punkte auftauchen, ist das ein Verkaufssignal. Intuitiv, nicht wahr?
- Sobald Sie eine Position eingenommen haben, kann es Ihnen beim Ausstieg helfen. Wenn ein gegenteiliges Handelssignal erscheint (d. h. Rot wird zu Grün oder umgekehrt), kann dies ein Hinweis darauf sein, dass Sie Ihre Aufträge schließen sollten.
Kombinieren mit anderen Indikatoren
Wie jedes Tool können Sie ihn mit anderen Indikatoren wie gleitenden Durchschnitten, Relative Strength Index, Bollinger Bands usw. kombinieren, um die Erfolgsquote Ihrer Handelssysteme zu erhöhen.
Sie können auch den Indikator Expert Advisors (EAs) für den automatisierten Handel verwenden. Stellen Sie sicher, dass Sie die Strategien zunächst mit einem Demo-Handelskonto testen!
Zusammenfassung
Insgesamt handelt es sich um einen einfachen, aber leistungsstarken Indikator zur Identifizierung von Übergangspunkten auf dem Markt. Er kann als großartiger Bestätigungsauslöser für Ihre bestehende Strategie dienen und lässt sich gut mit anderen Indikatoren und EAs synchronisieren.