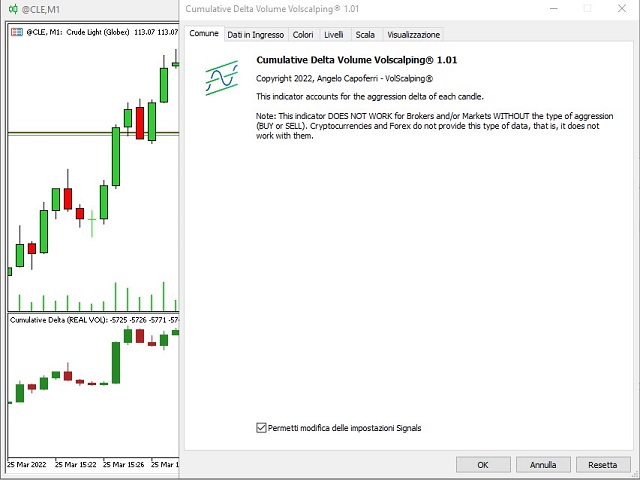
Delta Cumulative Volume
- Indikatoren
- Version: 1.1
- Aktivierungen: 5
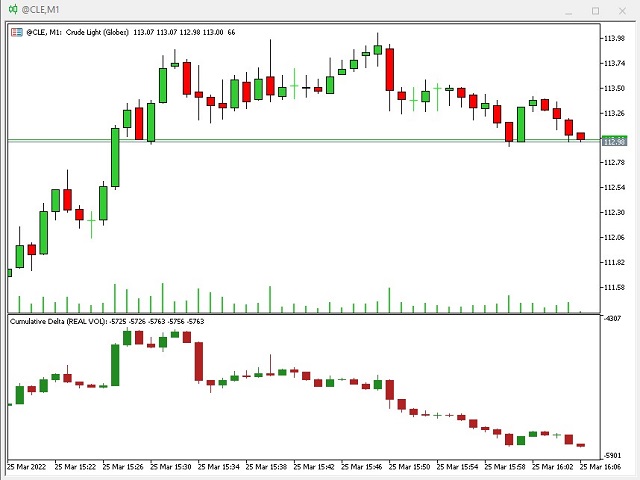
Dieser Indikator erkennt die Differenz zwischen den in Bid und Ask (Aggression) getroffenen Kontrakten für jede einzelne Kerze.
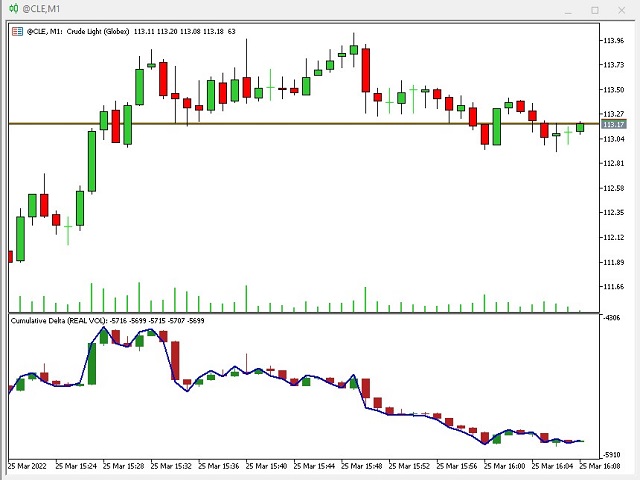
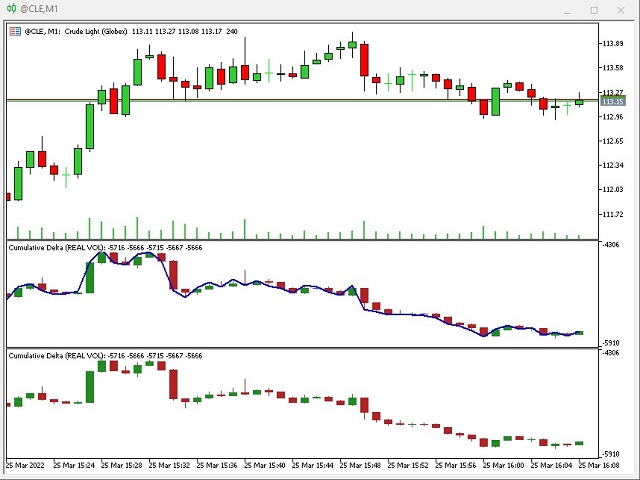
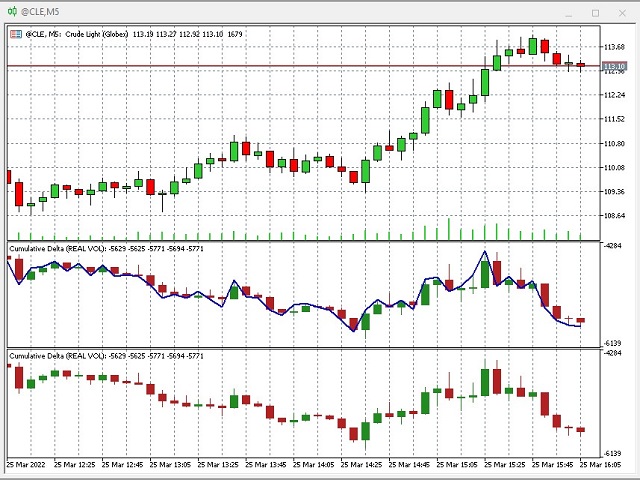
Der Indikator zeigt in dem dafür vorgesehenen Fenster unter dem Preischart Kerzen an, die genau durch die Differenz zwischen den verkauften und gekauften Kontrakten gegeben sind und die volumetrische Stärke des Marktes erzeugen.
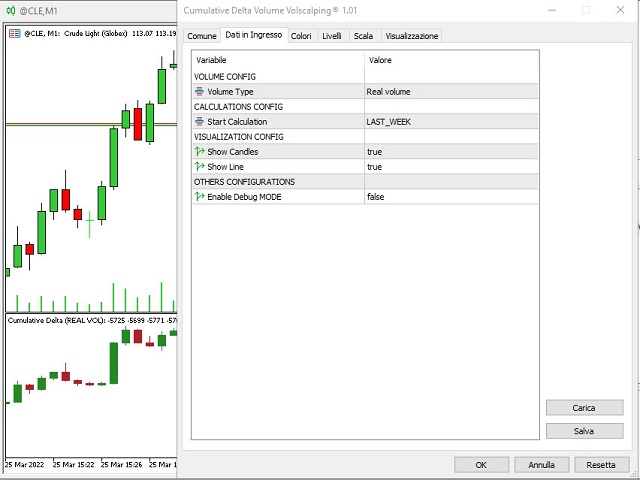
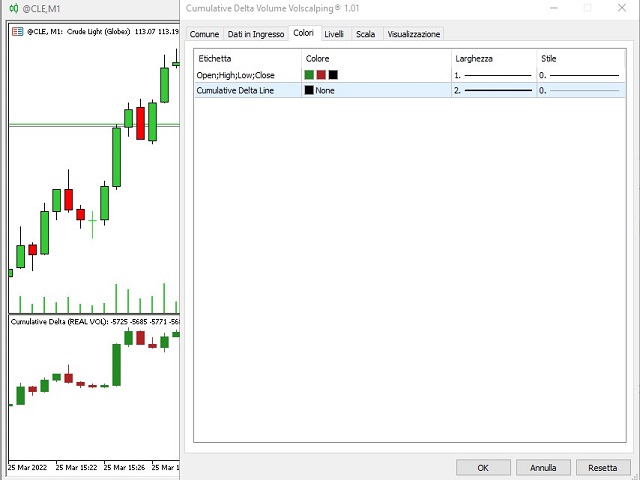
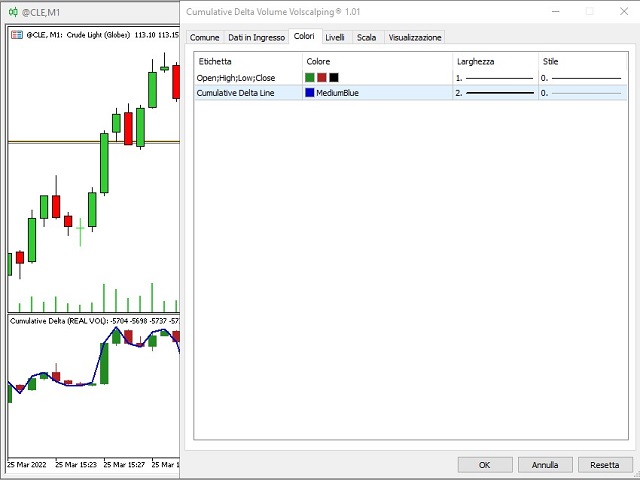
Es ist möglich (siehe Screenshots), nur das kumulative Candlestick-Delta-Diagramm oder sogar eine Trendlinie der Kerzen selbst auszuwählen: Durch Auswahl des zweiten Kästchens u "NONE" wird keine Trendlinie gezeichnet, während durch Auswahl einer Farbe, Die Trendlinie der volumetrischen Kerzen erscheint zusammen mit ihnen auf dem Chart.
WOFÜR IST DIESER INDIKATOR? Wenn Sie das Preisdiagramm mit dem volumetrischen Delta-Diagramm vergleichen, können Sie die wahre Stärke des Marktes erkennen. Die Konvergenz der beiden Diagramme bestimmt einen korrekten Anstieg / Rückgang der Preise, während eine Abweichung zwischen den Preisen und dem volumetrischen Delta ein Alarmsignal sein muss für den Händler, weil sich der Preis umkehren sollte. Dieser Indikator muss zusammen mit einer Handelsstrategie verwendet werden, um falsche Signale zu filtern und diejenigen zu eliminieren, die in einer Phase der Divergenz zwischen Preis und Volumen auftreten.
ACHTUNG: Der Indikator funktioniert NUR mit Brokern, die den Datenfluss des realen Marktes anbieten und die verkauften / gekauften Kontrakte (BID / ASK) aufteilen. CFD, FOREX UND KRYPTOWÄHRUNGEN gehören zum synthetischen Markt, sie haben keinen echten Datenfluss und daher FUNKTIONIERT der Indikator mit diesen Tools NICHT.
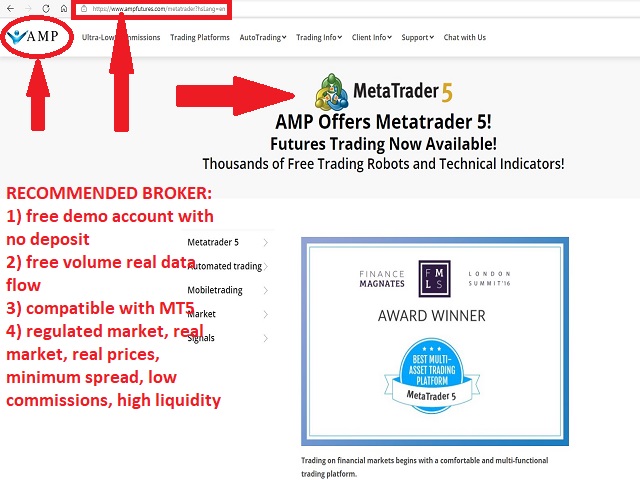
Ein Broker, der das kostenlose Demokonto ohne Einzahlung und mit echtem Datenfluss anbietet, auf dem der Indikator funktioniert, ist AMP FUTURE.